By InvestMacro
Here are the latest charts and statistics for the Commitment of Traders (COT) reports data published by the Commodities Futures Trading Commission (CFTC).
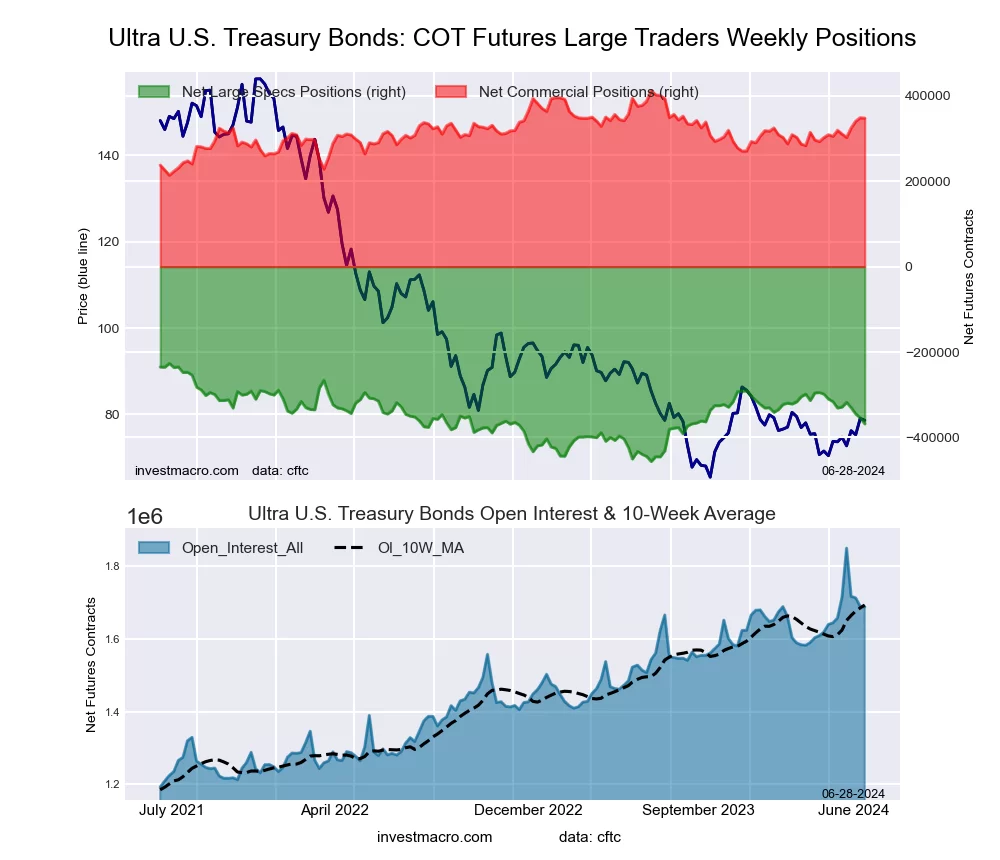
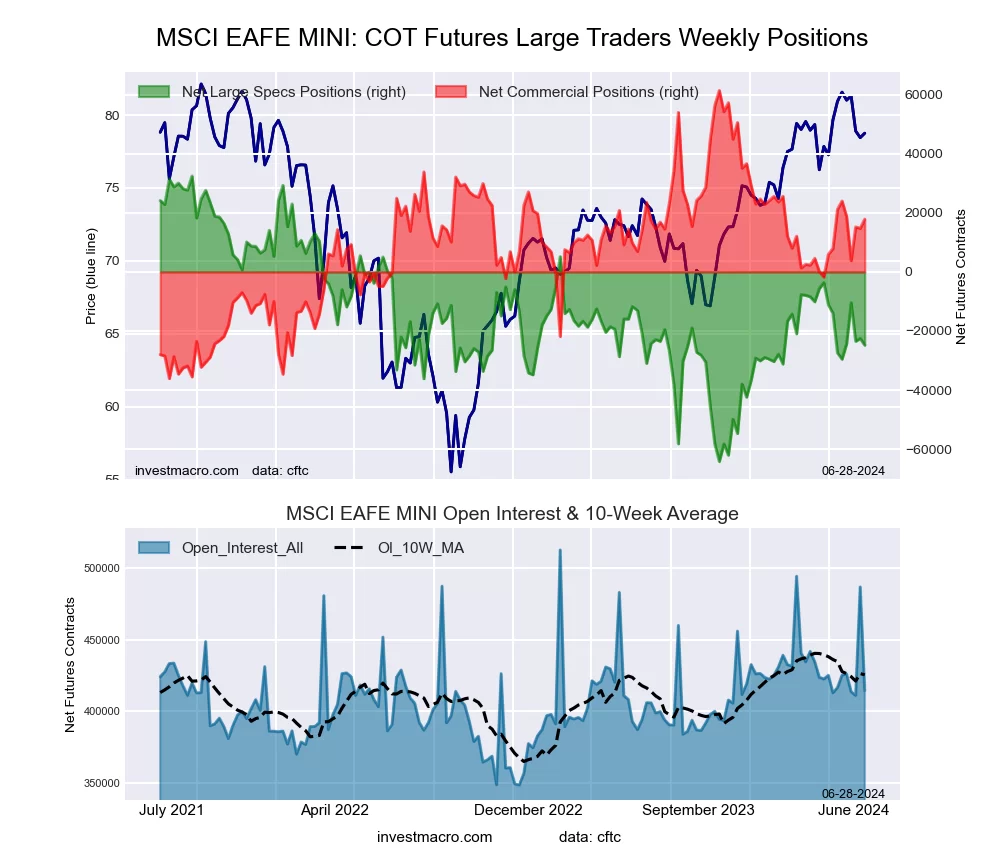
The latest COT data is updated through Tuesday July 9th and shows a quick view of how large traders (for-profit speculators and commercial entities) were positioned in the futures markets.
Weekly Speculator Changes led by Soybean Oil & Coffee
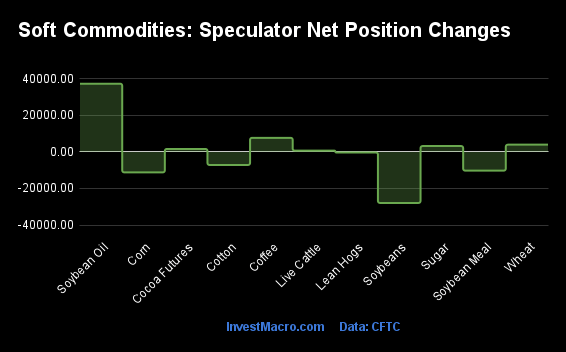
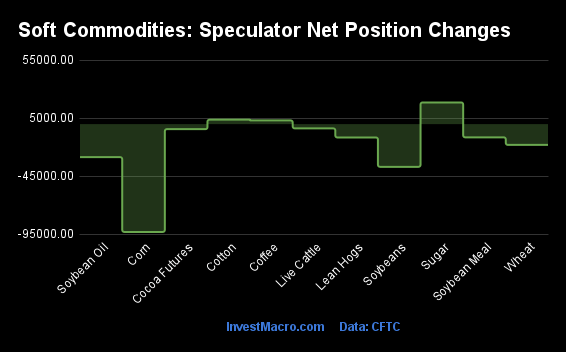
The COT soft commodities markets speculator bets were higher this week as six out of the eleven softs markets we cover had higher positioning while the other five markets had lower speculator contracts.
Leading the gains for the softs markets was Soybean Oil (37,237 contracts) with Coffee (7,659 contracts), Wheat (3,904 contracts), Sugar (3,161 contracts), Cocoa (1,578 contracts) and Live Cattle (665 contracts) also showing positive weeks.
The markets with the declines in speculator bets this week were Corn (-11,230 contracts), Soybeans (-27,936 contracts), Soybean Meal (-10,279 contracts), Cotton (-7,188 contracts) and with Lean Hogs (-368 contracts) also registering lower bets on the week.
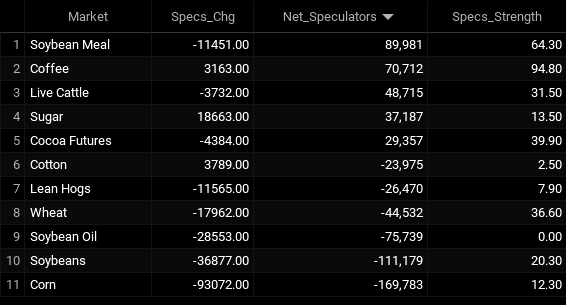
Soft Commodities Net Speculators Leaderboard
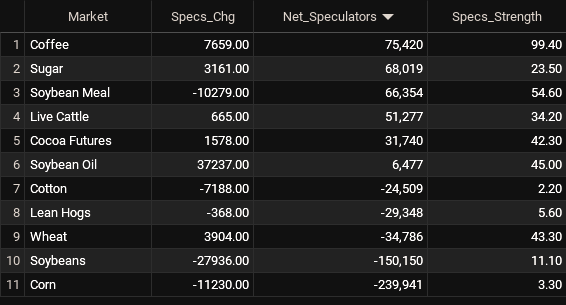
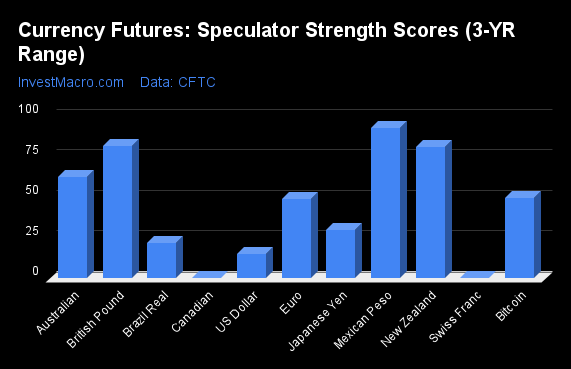
Legend: Weekly Speculators Change | Speculators Current Net Position | Speculators Strength Score compared to last 3-Years (0-100 range)
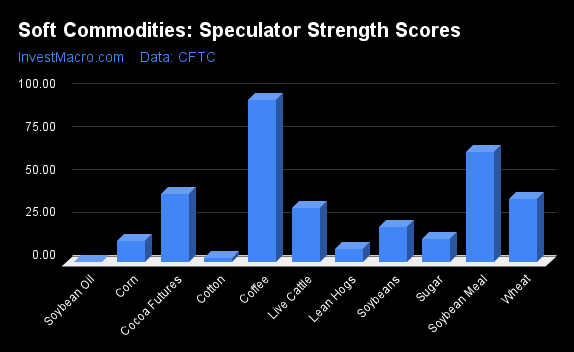
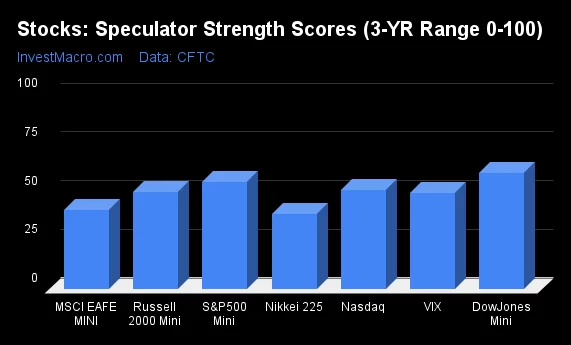
Strength Scores led by Coffee
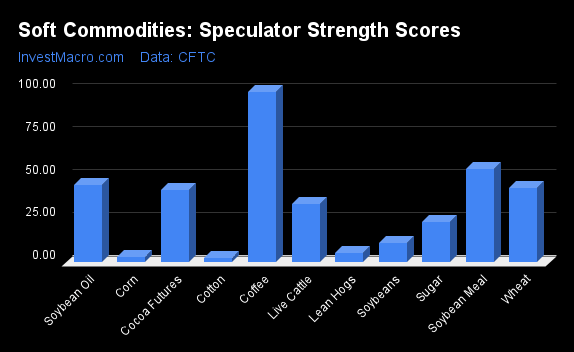
COT Strength Scores (a normalized measure of Speculator positions over a 3-Year range, from 0 to 100 where above 80 is Extreme-Bullish and below 20 is Extreme-Bearish) showed that Coffee (99 percent) leads the softs markets this week. Soybean Meal (55 percent), Soybean Oil (45 percent), Wheat (43 percent) and Cocoa (42 percent) come in as the next highest in the weekly strength scores.
On the downside, Cotton (2 percent), Corn (3 percent), Lean Hogs (6 percent) and the Soybeans (11 percent) come in at the lowest strength levels currently and are in Extreme-Bearish territory (below 20 percent).
Strength Statistics:
Corn (3.3 percent) vs Corn previous week (4.8 percent)
Sugar (23.5 percent) vs Sugar previous week (22.5 percent)
Coffee (99.4 percent) vs Coffee previous week (91.9 percent)
Soybeans (11.1 percent) vs Soybeans previous week (17.7 percent)
Soybean Oil (45.0 percent) vs Soybean Oil previous week (24.6 percent)
Soybean Meal (54.6 percent) vs Soybean Meal previous week (58.8 percent)
Live Cattle (34.2 percent) vs Live Cattle previous week (33.5 percent)
Lean Hogs (5.6 percent) vs Lean Hogs previous week (5.9 percent)
Cotton (2.2 percent) vs Cotton previous week (7.0 percent)
Cocoa (42.3 percent) vs Cocoa previous week (40.7 percent)
Wheat (43.3 percent) vs Wheat previous week (40.6 percent)
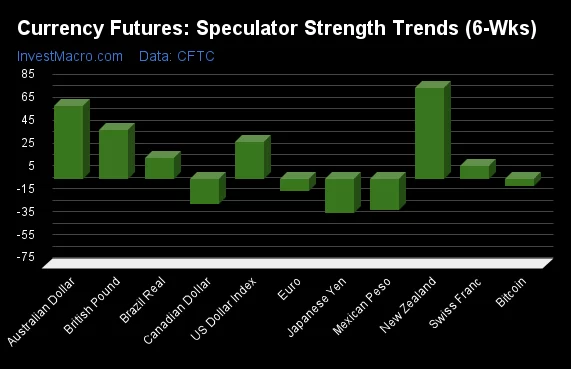
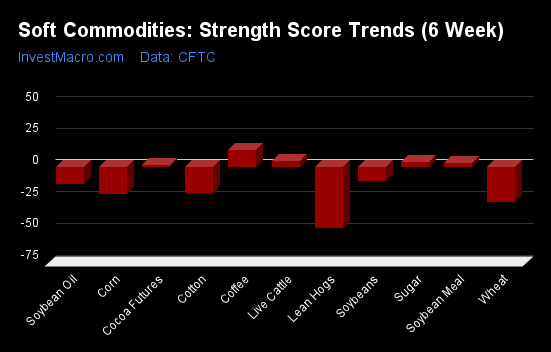
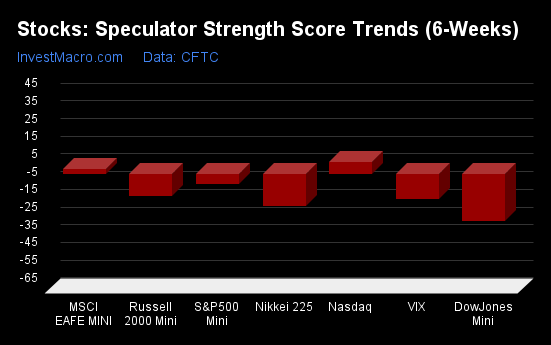
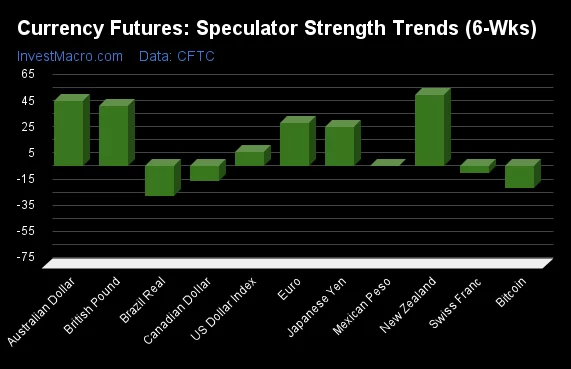
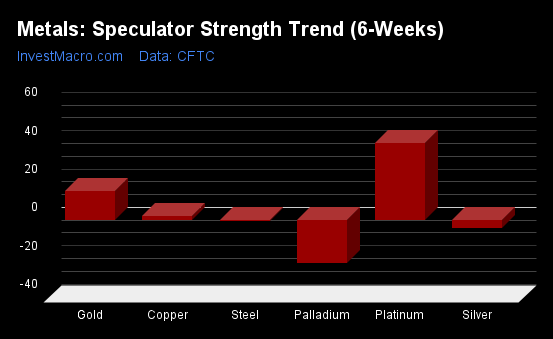
Sugar & Soybean Oil top the 6-Week Strength Trends
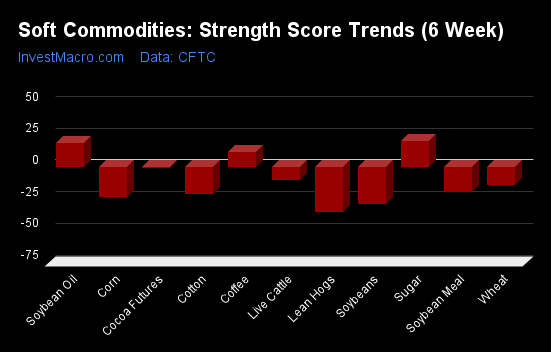
COT Strength Score Trends (or move index, calculates the 6-week changes in strength scores) showed that Sugar (21 percent) and Soybean Oil (19 percent) lead the past six weeks trends for soft commodities. Coffee (12 percent) is the next highest positive mover in the latest trends data.
Lean Hogs (-35 percent) leads the downside trend scores currently with Soybeans (-29 percent), Corn (-24 percent) and Cotton (-22 percent) following next with lower trend scores.
Strength Trend Statistics:
Corn (-24.0 percent) vs Corn previous week (-23.8 percent)
Sugar (20.5 percent) vs Sugar previous week (18.4 percent)
Coffee (12.0 percent) vs Coffee previous week (8.1 percent)
Soybeans (-29.3 percent) vs Soybeans previous week (-18.2 percent)
Soybean Oil (19.0 percent) vs Soybean Oil previous week (3.0 percent)
Soybean Meal (-19.8 percent) vs Soybean Meal previous week (-5.2 percent)
Live Cattle (-10.3 percent) vs Live Cattle previous week (-0.0 percent)
Lean Hogs (-35.3 percent) vs Lean Hogs previous week (-42.6 percent)
Cotton (-21.6 percent) vs Cotton previous week (-11.5 percent)
Cocoa (-0.8 percent) vs Cocoa previous week (1.3 percent)
Wheat (-14.2 percent) vs Wheat previous week (-18.2 percent)
Individual Soft Commodities Markets:
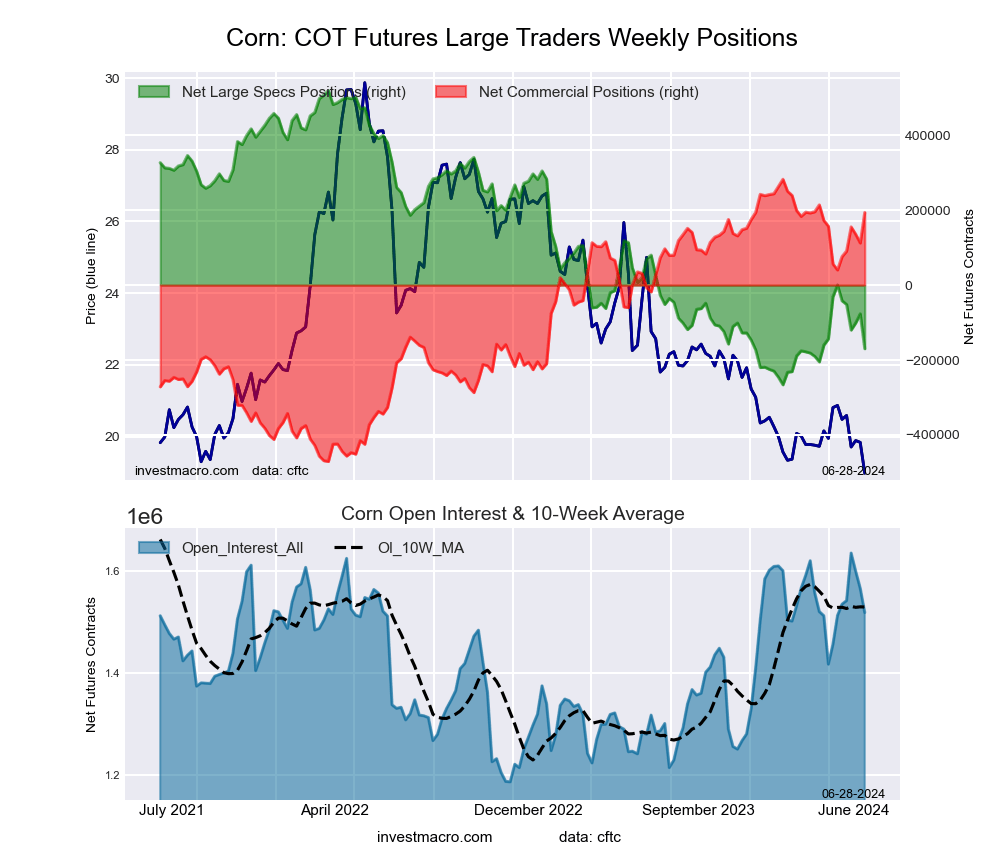
CORN Futures:
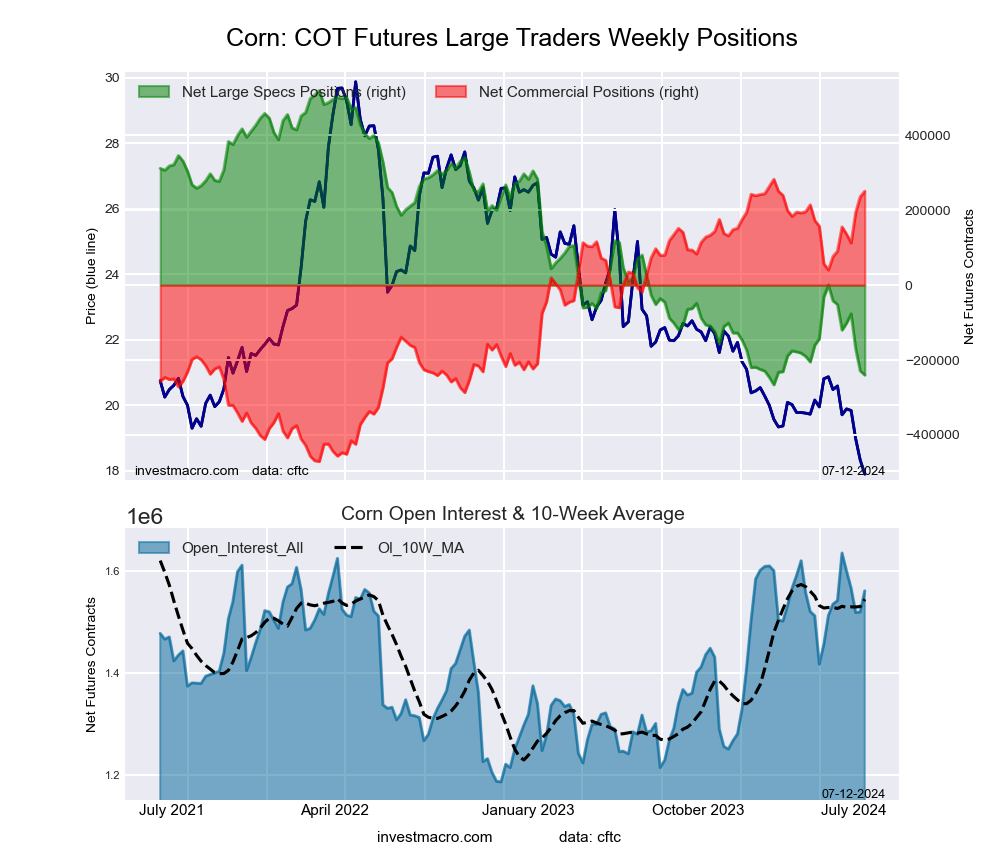 The CORN large speculator standing this week totaled a net position of -239,941 contracts in the data reported through Tuesday. This was a weekly decline of -11,230 contracts from the previous week which had a total of -228,711 net contracts.
This week’s current strength score (the trader positioning range over the past three years, measured from 0 to 100) shows the speculators are currently Bearish-Extreme with a score of 3.3 percent. The commercials are Bullish-Extreme with a score of 95.8 percent and the small traders (not shown in chart) are Bullish-Extreme with a score of 93.5 percent.
Price Trend-Following Model: Strong Downtrend
Our weekly trend-following model classifies the current market price position as: Strong Downtrend. The current action for the model is considered to be: Hold – Maintain Short Position.
| CORN Futures Statistics | SPECULATORS | COMMERCIALS | SMALL TRADERS |
| – Percent of Open Interest Longs: | 19.8 | 44.7 | 9.7 |
| – Percent of Open Interest Shorts: | 35.2 | 28.7 | 10.3 |
| – Net Position: | -239,941 | 250,562 | -10,621 |
| – Gross Longs: | 309,195 | 698,186 | 150,884 |
| – Gross Shorts: | 549,136 | 447,624 | 161,505 |
| – Long to Short Ratio: | 0.6 to 1 | 1.6 to 1 | 0.9 to 1 |
| NET POSITION TREND: | |||
| – Strength Index Score (3 Year Range Pct): | 3.3 | 95.8 | 93.5 |
| – Strength Index Reading (3 Year Range): | Bearish-Extreme | Bullish-Extreme | Bullish-Extreme |
| NET POSITION MOVEMENT INDEX: | |||
| – 6-Week Change in Strength Index: | -24.0 | 21.2 | 38.0 |
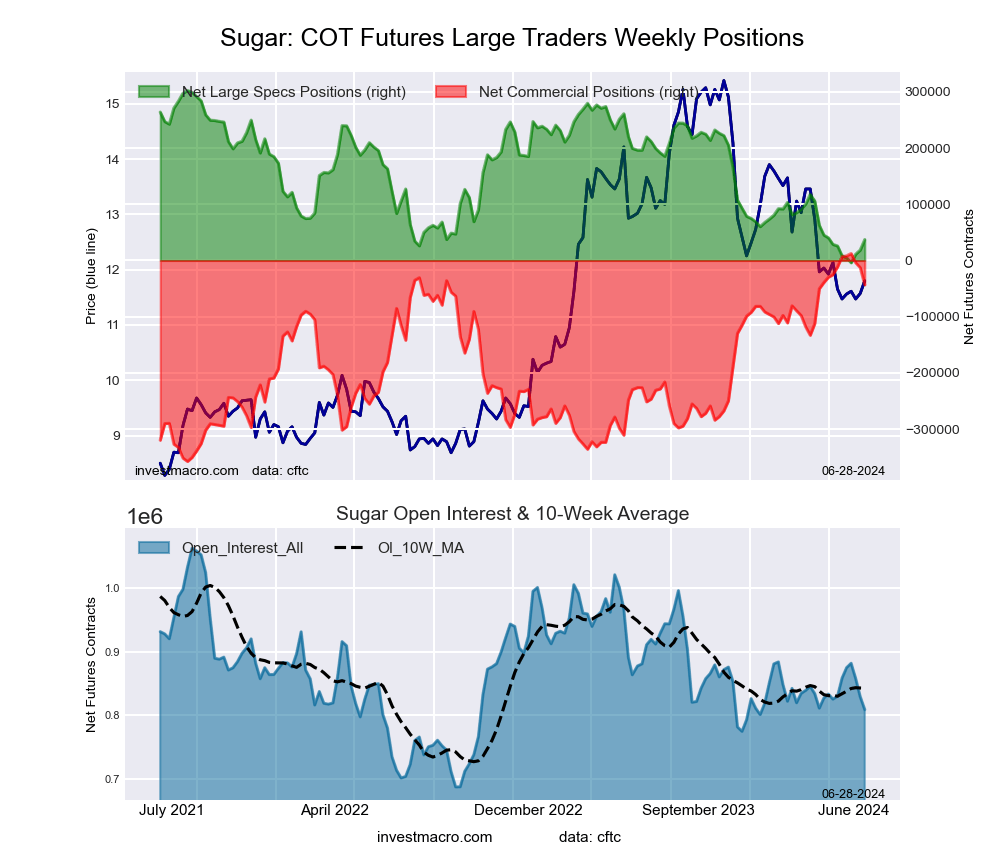
SUGAR Futures:
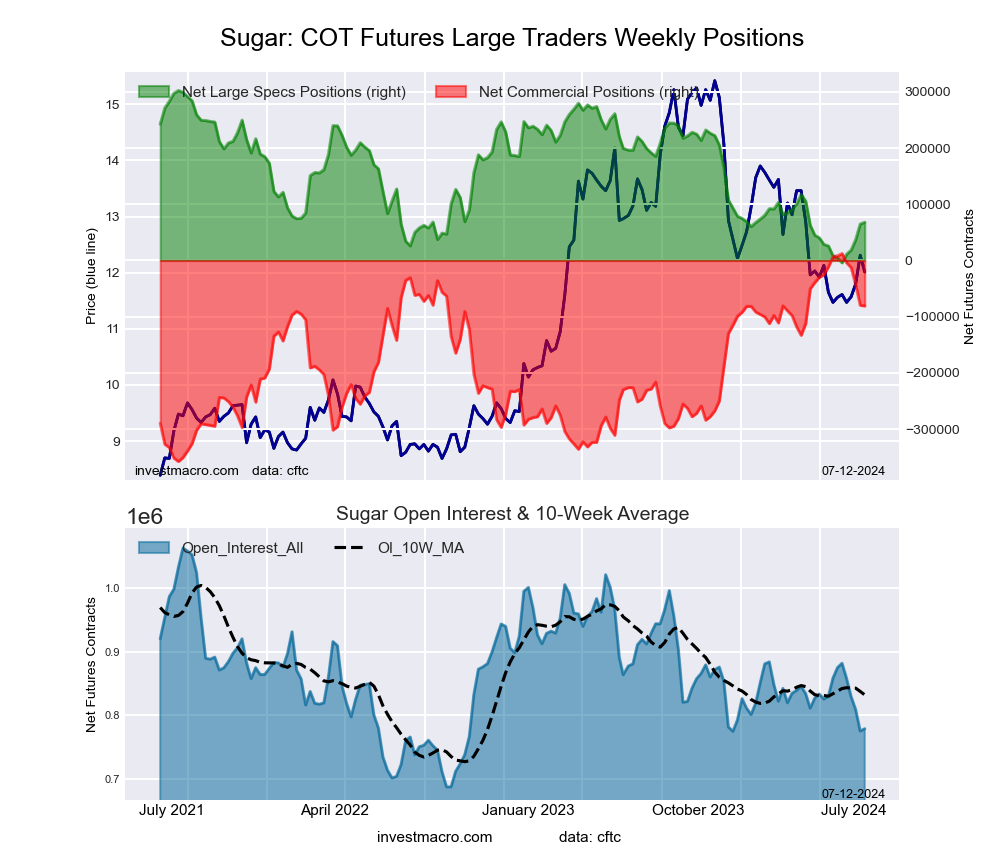 The SUGAR large speculator standing this week totaled a net position of 68,019 contracts in the data reported through Tuesday. This was a weekly boost of 3,161 contracts from the previous week which had a total of 64,858 net contracts.
This week’s current strength score (the trader positioning range over the past three years, measured from 0 to 100) shows the speculators are currently Bearish with a score of 23.5 percent. The commercials are Bullish with a score of 74.8 percent and the small traders (not shown in chart) are Bearish with a score of 36.2 percent.
Price Trend-Following Model: Downtrend
Our weekly trend-following model classifies the current market price position as: Downtrend. The current action for the model is considered to be: Hold – Maintain Short Position.
| SUGAR Futures Statistics | SPECULATORS | COMMERCIALS | SMALL TRADERS |
| – Percent of Open Interest Longs: | 22.5 | 53.6 | 9.1 |
| – Percent of Open Interest Shorts: | 13.8 | 64.0 | 7.5 |
| – Net Position: | 68,019 | -80,789 | 12,770 |
| – Gross Longs: | 175,342 | 417,731 | 71,188 |
| – Gross Shorts: | 107,323 | 498,520 | 58,418 |
| – Long to Short Ratio: | 1.6 to 1 | 0.8 to 1 | 1.2 to 1 |
| NET POSITION TREND: | |||
| – Strength Index Score (3 Year Range Pct): | 23.5 | 74.8 | 36.2 |
| – Strength Index Reading (3 Year Range): | Bearish | Bullish | Bearish |
| NET POSITION MOVEMENT INDEX: | |||
| – 6-Week Change in Strength Index: | 20.5 | -24.1 | 34.1 |
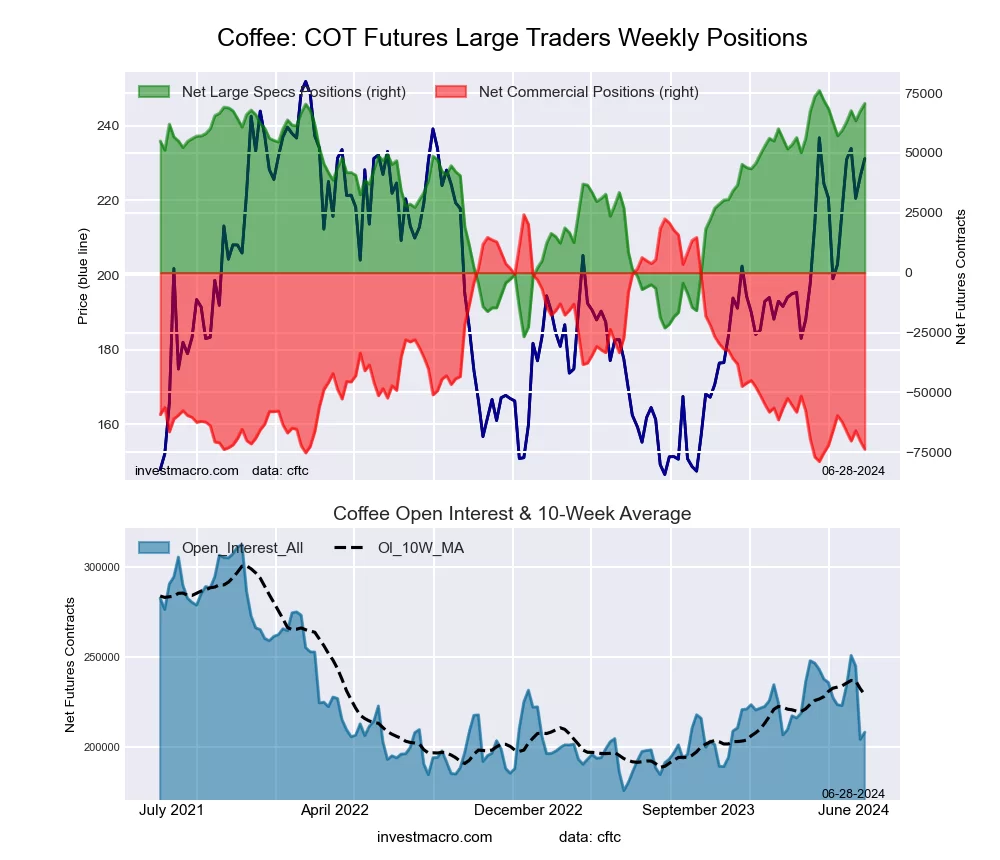
COFFEE Futures:
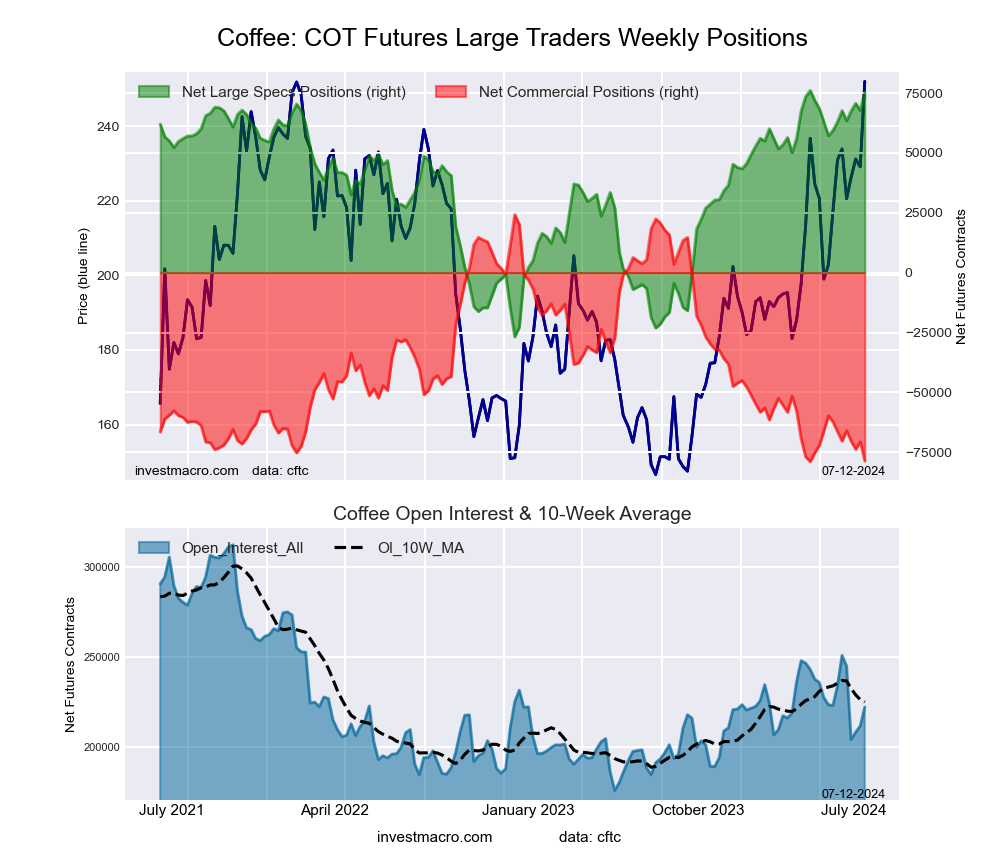 The COFFEE large speculator standing this week totaled a net position of 75,420 contracts in the data reported through Tuesday. This was a weekly rise of 7,659 contracts from the previous week which had a total of 67,761 net contracts.
This week’s current strength score (the trader positioning range over the past three years, measured from 0 to 100) shows the speculators are currently Bullish-Extreme with a score of 99.4 percent. The commercials are Bearish-Extreme with a score of 0.2 percent and the small traders (not shown in chart) are Bullish with a score of 65.2 percent.
Price Trend-Following Model: Strong Uptrend
Our weekly trend-following model classifies the current market price position as: Strong Uptrend. The current action for the model is considered to be: Hold – Maintain Long Position.
| COFFEE Futures Statistics | SPECULATORS | COMMERCIALS | SMALL TRADERS |
| – Percent of Open Interest Longs: | 40.8 | 34.0 | 3.9 |
| – Percent of Open Interest Shorts: | 6.8 | 69.4 | 2.5 |
| – Net Position: | 75,420 | -78,578 | 3,158 |
| – Gross Longs: | 90,458 | 75,501 | 8,606 |
| – Gross Shorts: | 15,038 | 154,079 | 5,448 |
| – Long to Short Ratio: | 6.0 to 1 | 0.5 to 1 | 1.6 to 1 |
| NET POSITION TREND: | |||
| – Strength Index Score (3 Year Range Pct): | 99.4 | 0.2 | 65.2 |
| – Strength Index Reading (3 Year Range): | Bullish-Extreme | Bearish-Extreme | Bullish |
| NET POSITION MOVEMENT INDEX: | |||
| – 6-Week Change in Strength Index: | 12.0 | -11.8 | -2.8 |
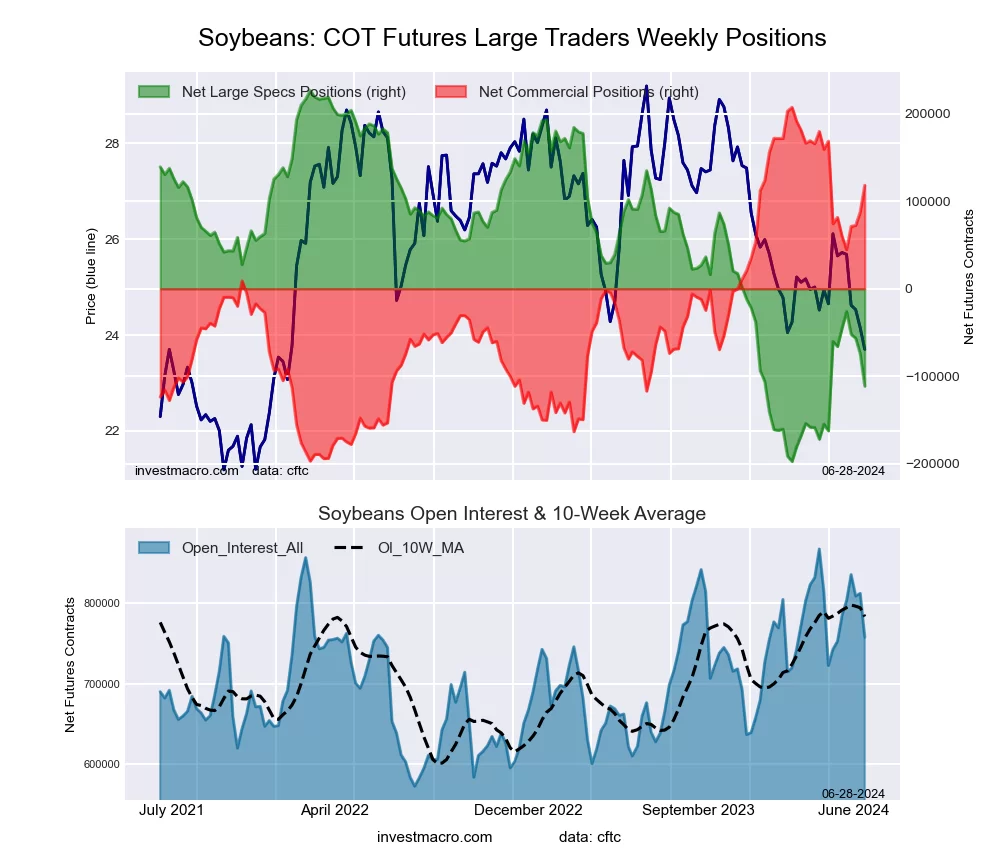
SOYBEANS Futures:
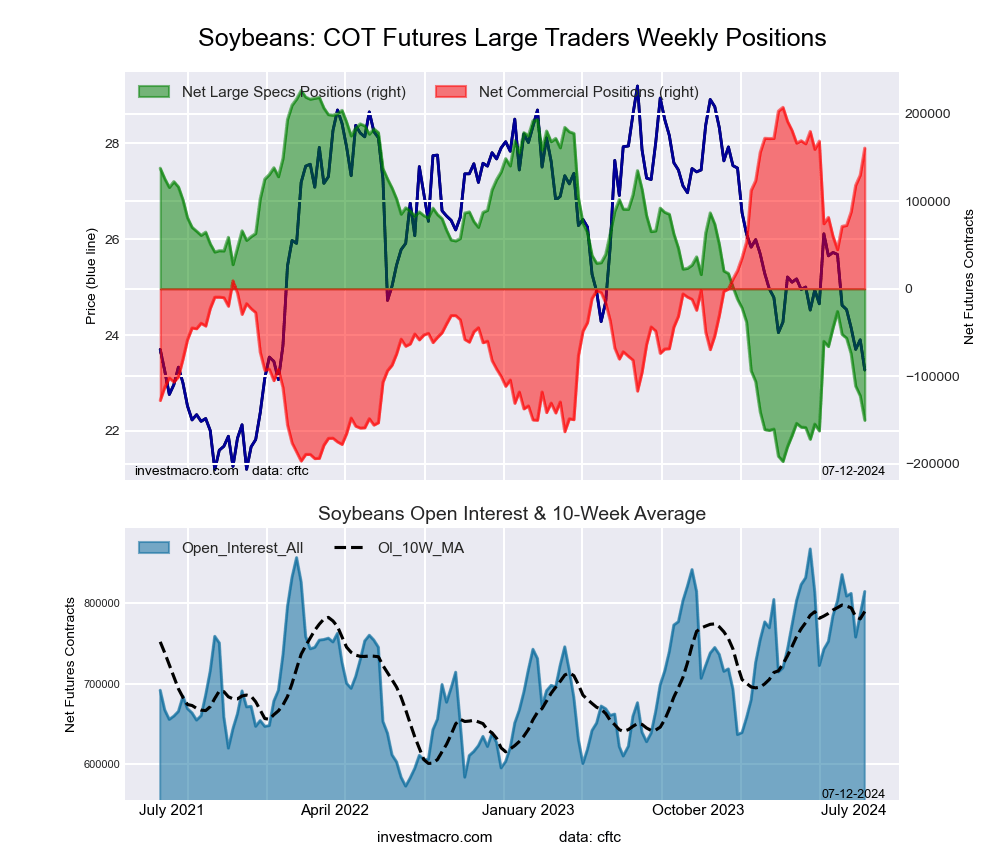 The SOYBEANS large speculator standing this week totaled a net position of -150,150 contracts in the data reported through Tuesday. This was a weekly lowering of -27,936 contracts from the previous week which had a total of -122,214 net contracts.
This week’s current strength score (the trader positioning range over the past three years, measured from 0 to 100) shows the speculators are currently Bearish-Extreme with a score of 11.1 percent. The commercials are Bullish-Extreme with a score of 88.5 percent and the small traders (not shown in chart) are Bullish-Extreme with a score of 84.9 percent.
Price Trend-Following Model: Strong Downtrend
Our weekly trend-following model classifies the current market price position as: Strong Downtrend. The current action for the model is considered to be: Hold – Maintain Short Position.
| SOYBEANS Futures Statistics | SPECULATORS | COMMERCIALS | SMALL TRADERS |
| – Percent of Open Interest Longs: | 15.3 | 60.2 | 6.0 |
| – Percent of Open Interest Shorts: | 33.7 | 40.5 | 7.3 |
| – Net Position: | -150,150 | 160,682 | -10,532 |
| – Gross Longs: | 124,357 | 490,906 | 49,133 |
| – Gross Shorts: | 274,507 | 330,224 | 59,665 |
| – Long to Short Ratio: | 0.5 to 1 | 1.5 to 1 | 0.8 to 1 |
| NET POSITION TREND: | |||
| – Strength Index Score (3 Year Range Pct): | 11.1 | 88.5 | 84.9 |
| – Strength Index Reading (3 Year Range): | Bearish-Extreme | Bullish-Extreme | Bullish-Extreme |
| NET POSITION MOVEMENT INDEX: | |||
| – 6-Week Change in Strength Index: | -29.3 | 28.7 | 21.6 |
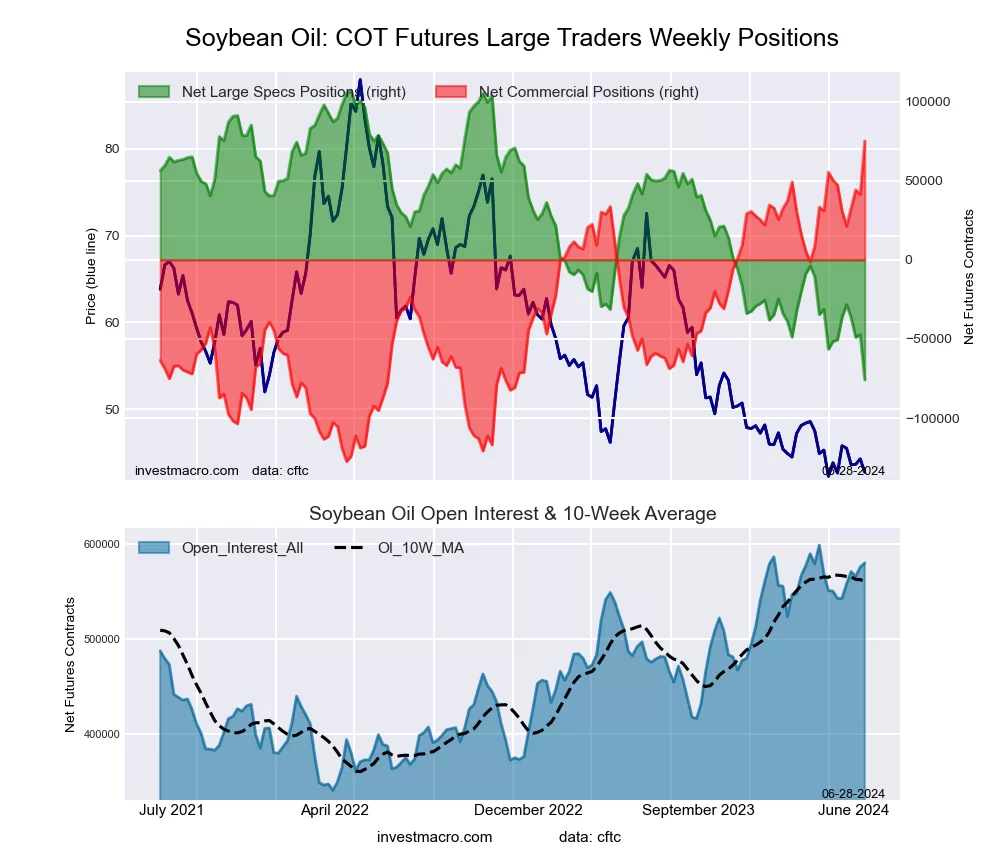
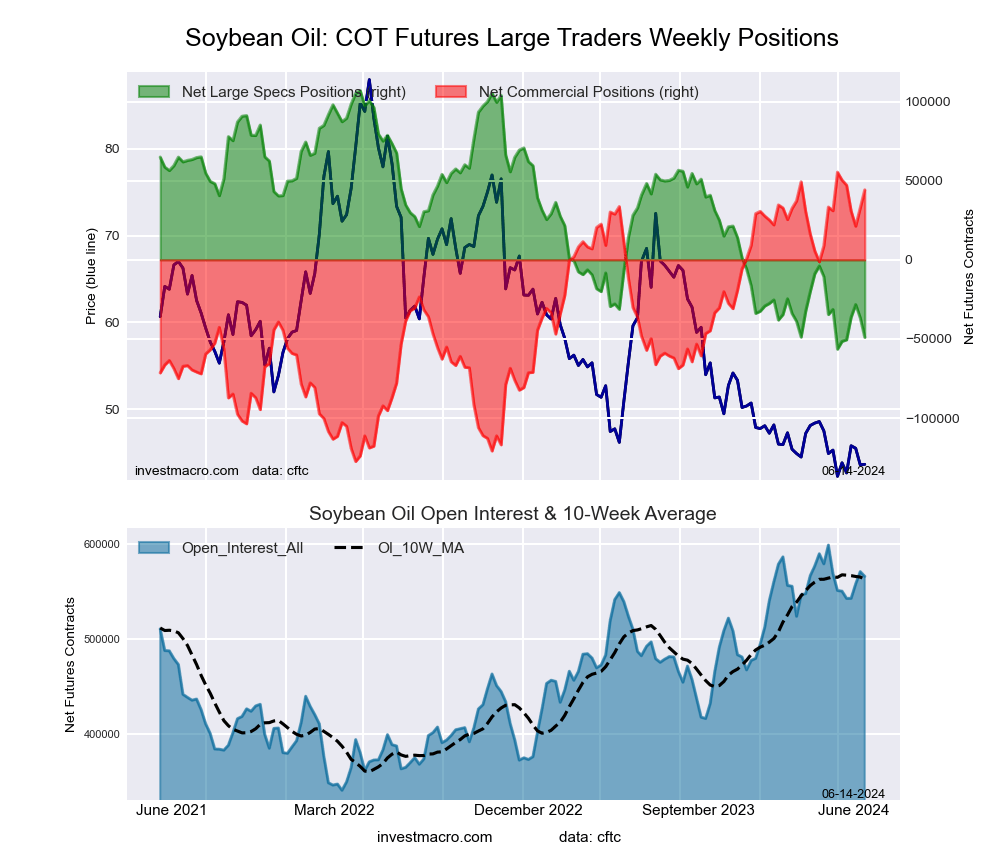
SOYBEAN OIL Futures:
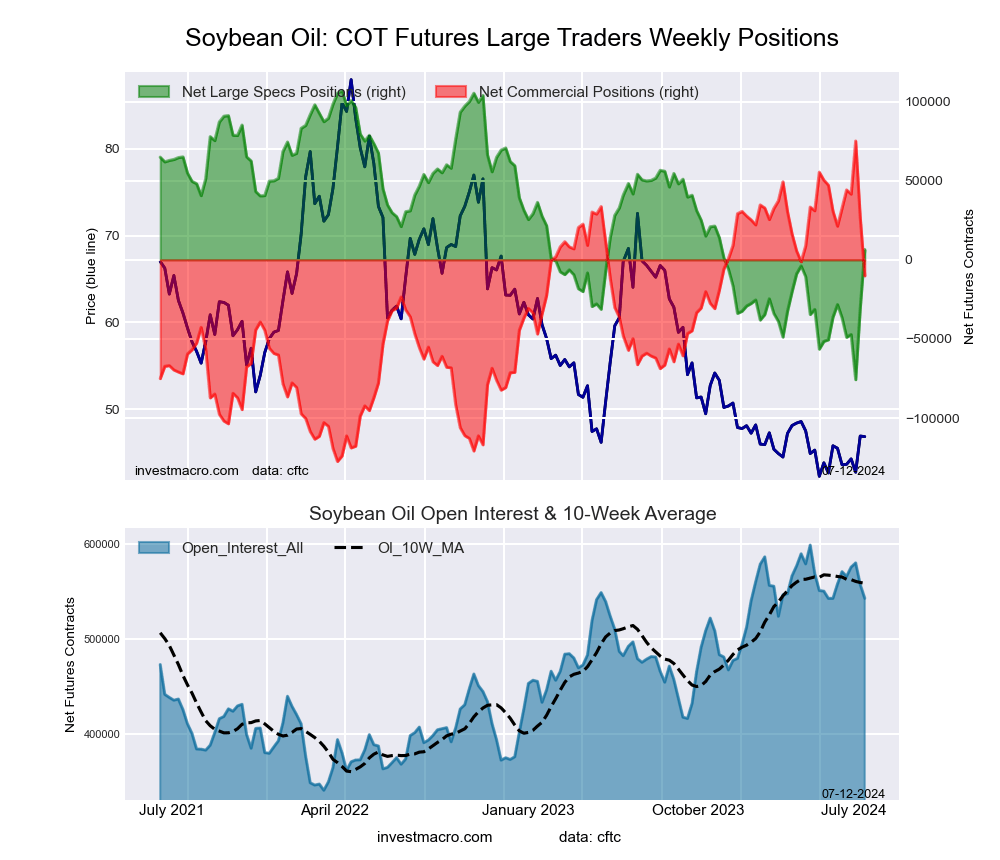 The SOYBEAN OIL large speculator standing this week totaled a net position of 6,477 contracts in the data reported through Tuesday. This was a weekly gain of 37,237 contracts from the previous week which had a total of -30,760 net contracts.
This week’s current strength score (the trader positioning range over the past three years, measured from 0 to 100) shows the speculators are currently Bearish with a score of 45.0 percent. The commercials are Bullish with a score of 57.9 percent and the small traders (not shown in chart) are Bearish with a score of 28.3 percent.
Price Trend-Following Model: Weak Downtrend
Our weekly trend-following model classifies the current market price position as: Weak Downtrend. The current action for the model is considered to be: Hold – Maintain Short Position.
| SOYBEAN OIL Futures Statistics | SPECULATORS | COMMERCIALS | SMALL TRADERS |
| – Percent of Open Interest Longs: | 20.9 | 51.6 | 5.3 |
| – Percent of Open Interest Shorts: | 19.7 | 53.5 | 4.6 |
| – Net Position: | 6,477 | -10,143 | 3,666 |
| – Gross Longs: | 113,261 | 280,271 | 28,641 |
| – Gross Shorts: | 106,784 | 290,414 | 24,975 |
| – Long to Short Ratio: | 1.1 to 1 | 1.0 to 1 | 1.1 to 1 |
| NET POSITION TREND: | |||
| – Strength Index Score (3 Year Range Pct): | 45.0 | 57.9 | 28.3 |
| – Strength Index Reading (3 Year Range): | Bearish | Bullish | Bearish |
| NET POSITION MOVEMENT INDEX: | |||
| – 6-Week Change in Strength Index: | 19.0 | -15.5 | -12.9 |
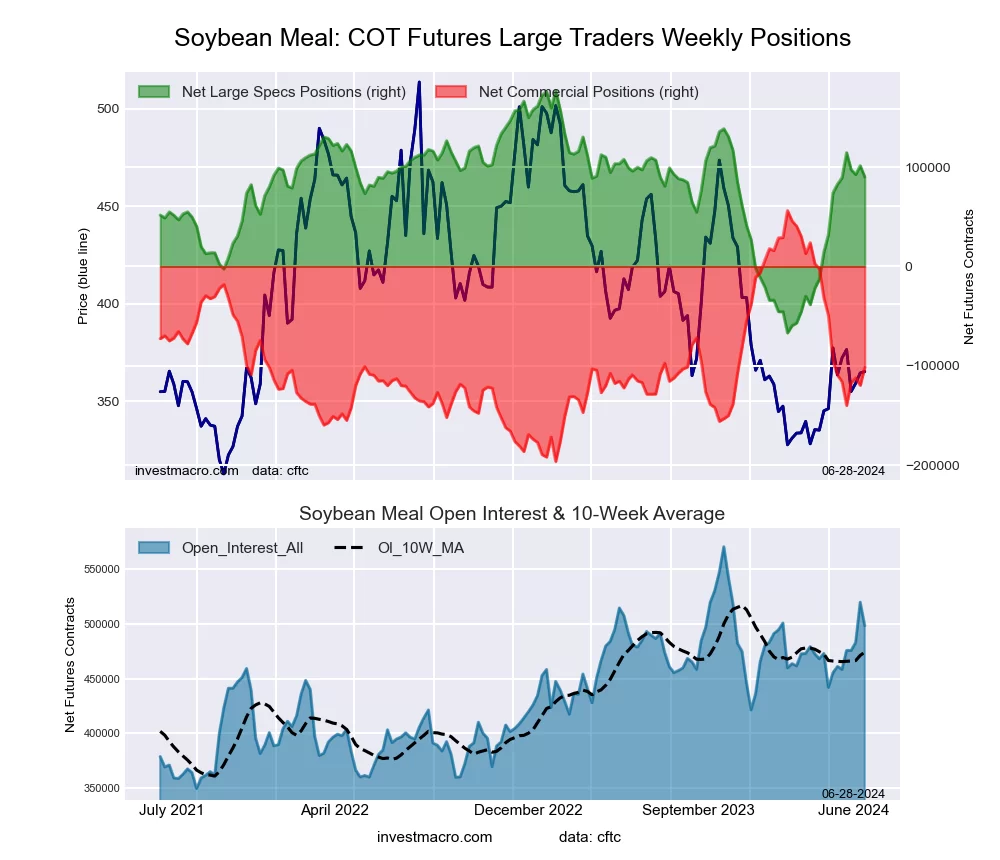
SOYBEAN MEAL Futures:
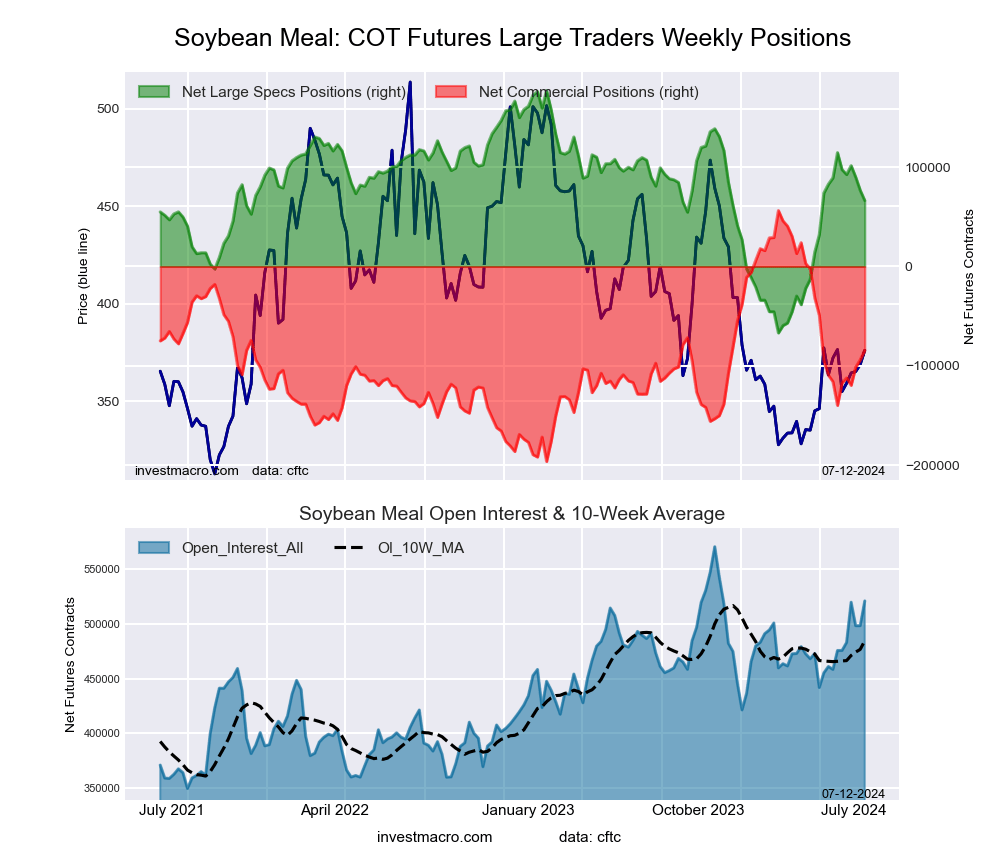 The SOYBEAN MEAL large speculator standing this week totaled a net position of 66,354 contracts in the data reported through Tuesday. This was a weekly decline of -10,279 contracts from the previous week which had a total of 76,633 net contracts.
This week’s current strength score (the trader positioning range over the past three years, measured from 0 to 100) shows the speculators are currently Bullish with a score of 54.6 percent. The commercials are Bearish with a score of 44.3 percent and the small traders (not shown in chart) are Bearish with a score of 37.0 percent.
Price Trend-Following Model: Uptrend
Our weekly trend-following model classifies the current market price position as: Uptrend. The current action for the model is considered to be: Hold – Maintain Long Position.
| SOYBEAN MEAL Futures Statistics | SPECULATORS | COMMERCIALS | SMALL TRADERS |
| – Percent of Open Interest Longs: | 27.6 | 40.0 | 8.7 |
| – Percent of Open Interest Shorts: | 14.8 | 56.2 | 5.3 |
| – Net Position: | 66,354 | -84,429 | 18,075 |
| – Gross Longs: | 143,642 | 208,260 | 45,589 |
| – Gross Shorts: | 77,288 | 292,689 | 27,514 |
| – Long to Short Ratio: | 1.9 to 1 | 0.7 to 1 | 1.7 to 1 |
| NET POSITION TREND: | |||
| – Strength Index Score (3 Year Range Pct): | 54.6 | 44.3 | 37.0 |
| – Strength Index Reading (3 Year Range): | Bullish | Bearish | Bearish |
| NET POSITION MOVEMENT INDEX: | |||
| – 6-Week Change in Strength Index: | -19.8 | 21.9 | -32.5 |
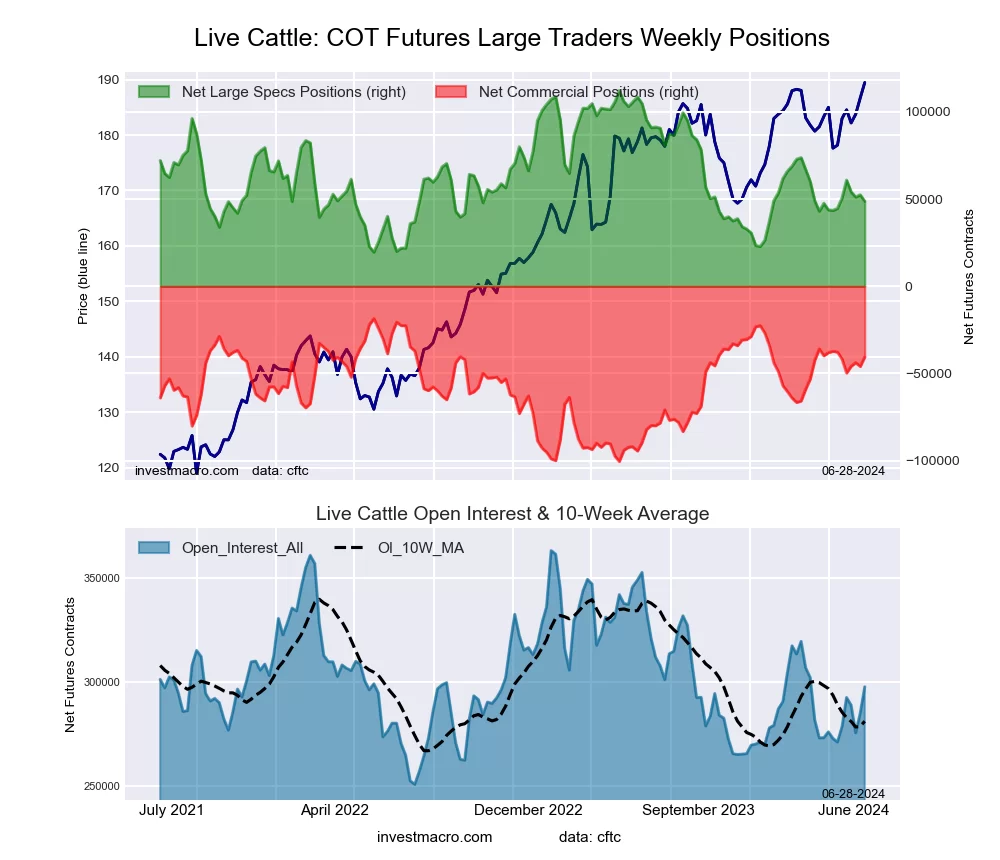
LIVE CATTLE Futures:
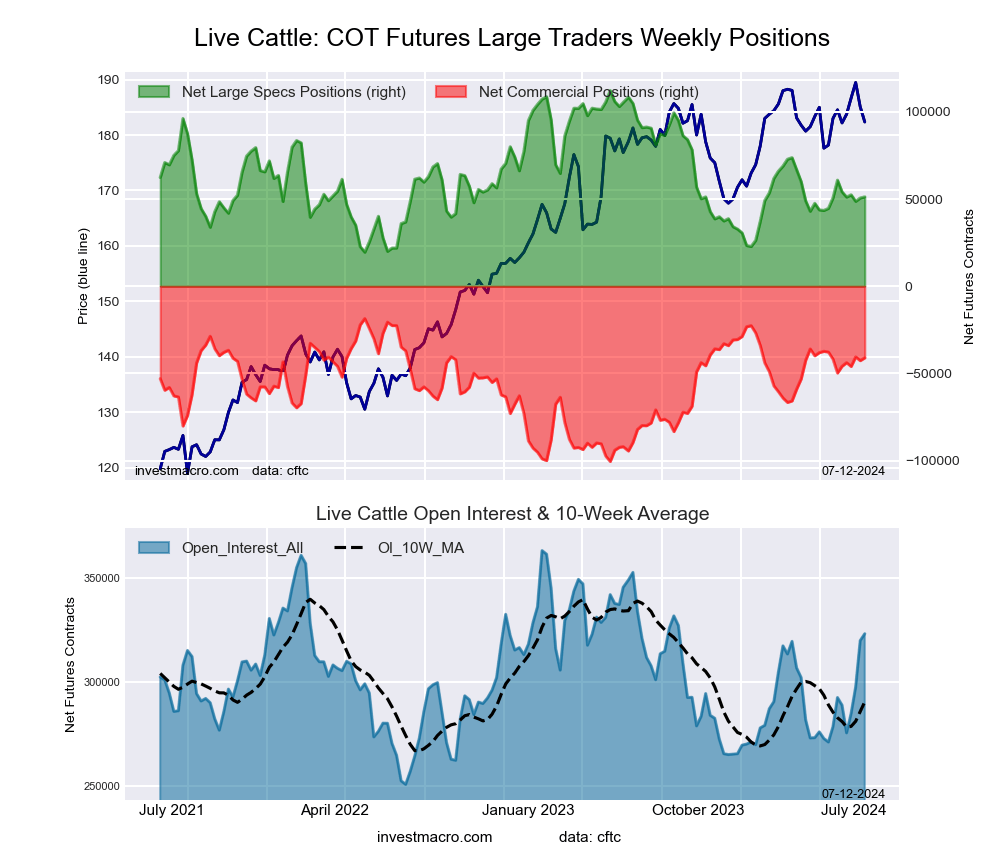 The LIVE CATTLE large speculator standing this week totaled a net position of 51,277 contracts in the data reported through Tuesday. This was a weekly lift of 665 contracts from the previous week which had a total of 50,612 net contracts.
This week’s current strength score (the trader positioning range over the past three years, measured from 0 to 100) shows the speculators are currently Bearish with a score of 34.2 percent. The commercials are Bullish with a score of 72.5 percent and the small traders (not shown in chart) are Bearish with a score of 35.3 percent.
Price Trend-Following Model: Weak Uptrend
Our weekly trend-following model classifies the current market price position as: Weak Uptrend. The current action for the model is considered to be: Hold – Maintain Long Position.
| LIVE CATTLE Futures Statistics | SPECULATORS | COMMERCIALS | SMALL TRADERS |
| – Percent of Open Interest Longs: | 39.1 | 31.3 | 8.9 |
| – Percent of Open Interest Shorts: | 23.2 | 44.0 | 12.1 |
| – Net Position: | 51,277 | -41,067 | -10,210 |
| – Gross Longs: | 126,376 | 101,255 | 28,792 |
| – Gross Shorts: | 75,099 | 142,322 | 39,002 |
| – Long to Short Ratio: | 1.7 to 1 | 0.7 to 1 | 0.7 to 1 |
| NET POSITION TREND: | |||
| – Strength Index Score (3 Year Range Pct): | 34.2 | 72.5 | 35.3 |
| – Strength Index Reading (3 Year Range): | Bearish | Bullish | Bearish |
| NET POSITION MOVEMENT INDEX: | |||
| – 6-Week Change in Strength Index: | -10.3 | 10.6 | 4.8 |
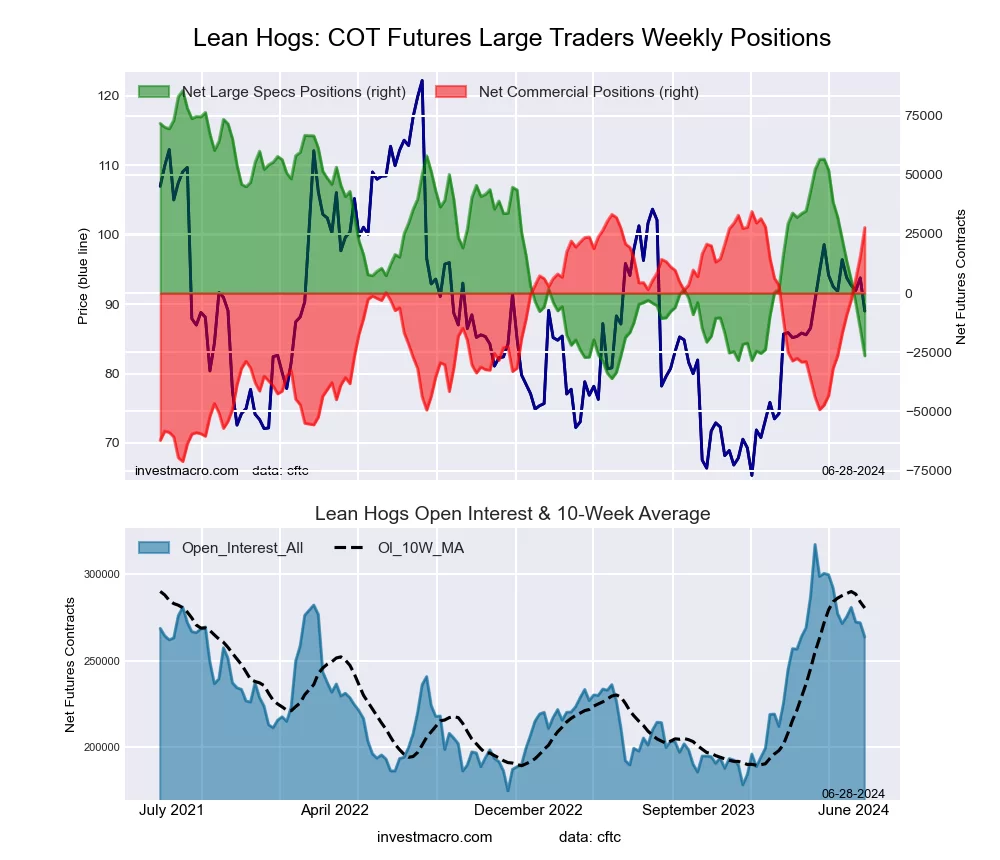
LEAN HOGS Futures:
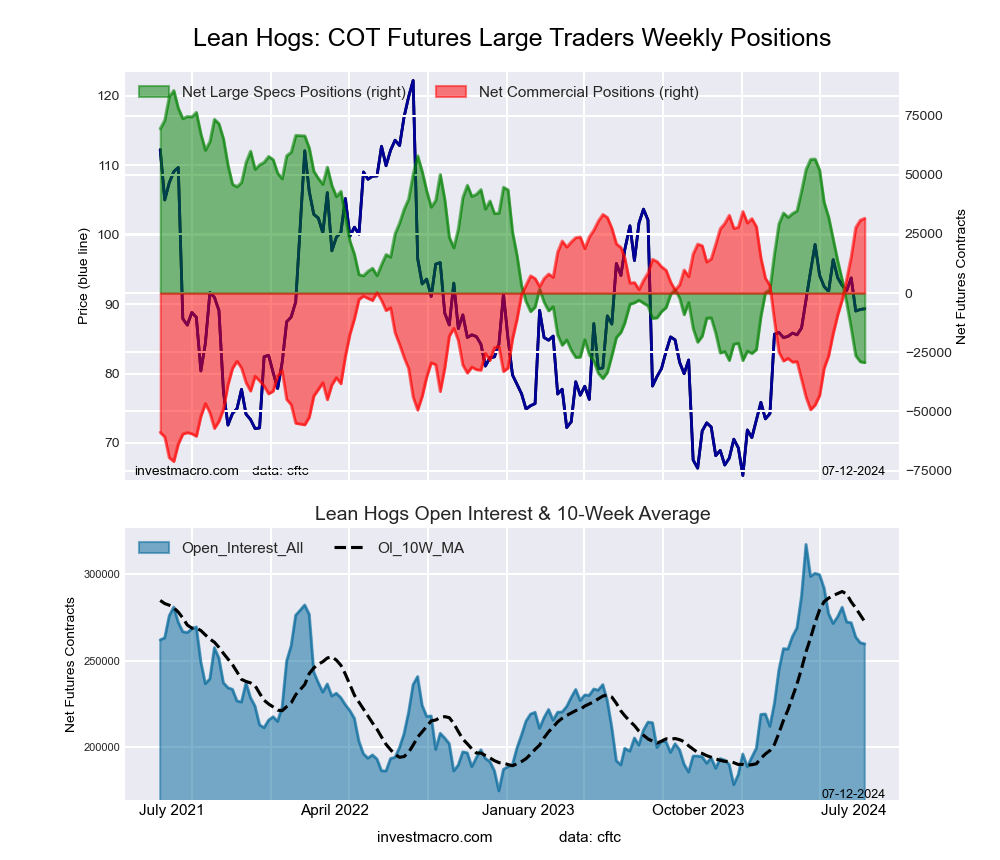 The LEAN HOGS large speculator standing this week totaled a net position of -29,348 contracts in the data reported through Tuesday. This was a weekly fall of -368 contracts from the previous week which had a total of -28,980 net contracts.
This week’s current strength score (the trader positioning range over the past three years, measured from 0 to 100) shows the speculators are currently Bearish-Extreme with a score of 5.6 percent. The commercials are Bullish-Extreme with a score of 97.3 percent and the small traders (not shown in chart) are Bullish with a score of 73.3 percent.
Price Trend-Following Model: Weak Uptrend
Our weekly trend-following model classifies the current market price position as: Weak Uptrend. The current action for the model is considered to be: Hold – Maintain Long Position.
| LEAN HOGS Futures Statistics | SPECULATORS | COMMERCIALS | SMALL TRADERS |
| – Percent of Open Interest Longs: | 29.8 | 40.7 | 7.4 |
| – Percent of Open Interest Shorts: | 41.1 | 28.5 | 8.3 |
| – Net Position: | -29,348 | 31,597 | -2,249 |
| – Gross Longs: | 77,382 | 105,676 | 19,335 |
| – Gross Shorts: | 106,730 | 74,079 | 21,584 |
| – Long to Short Ratio: | 0.7 to 1 | 1.4 to 1 | 0.9 to 1 |
| NET POSITION TREND: | |||
| – Strength Index Score (3 Year Range Pct): | 5.6 | 97.3 | 73.3 |
| – Strength Index Reading (3 Year Range): | Bearish-Extreme | Bullish-Extreme | Bullish |
| NET POSITION MOVEMENT INDEX: | |||
| – 6-Week Change in Strength Index: | -35.3 | 38.7 | 9.5 |
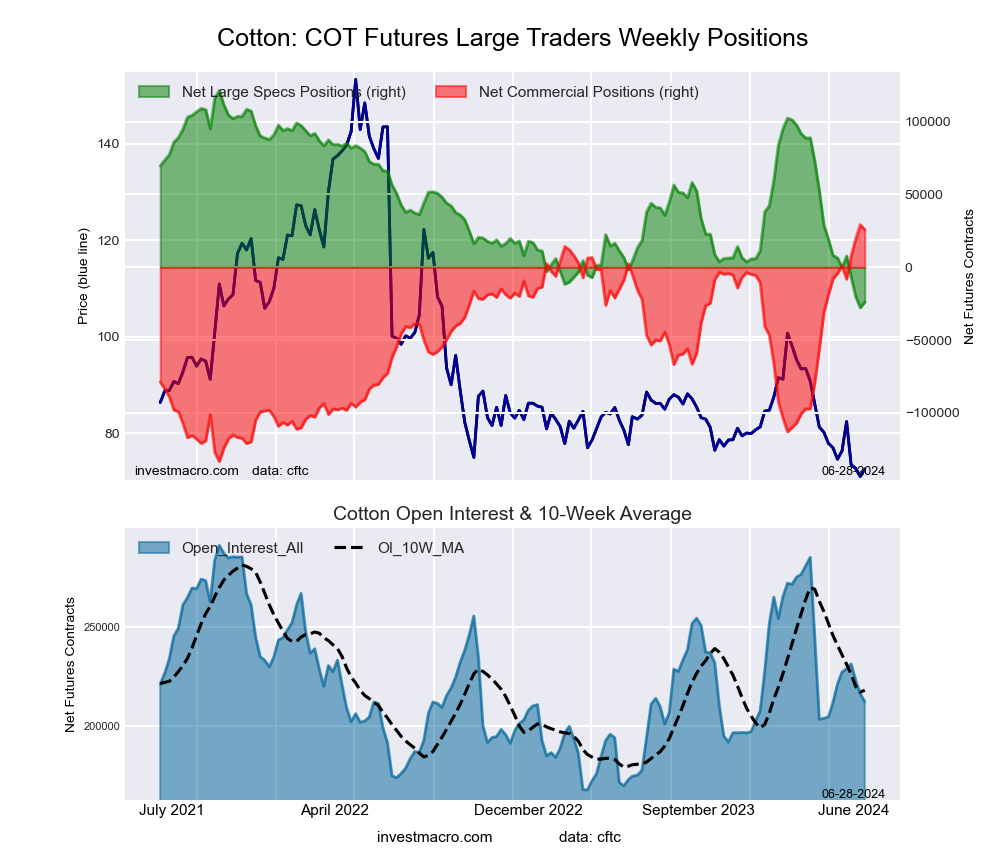
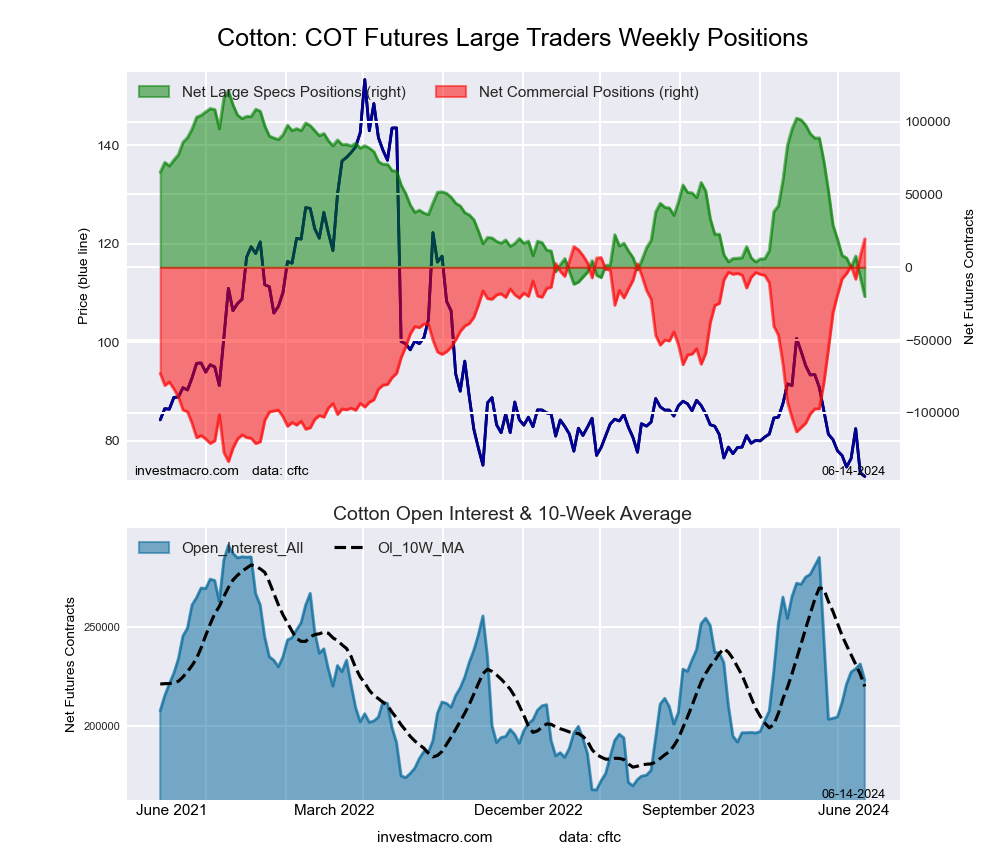
COTTON Futures:
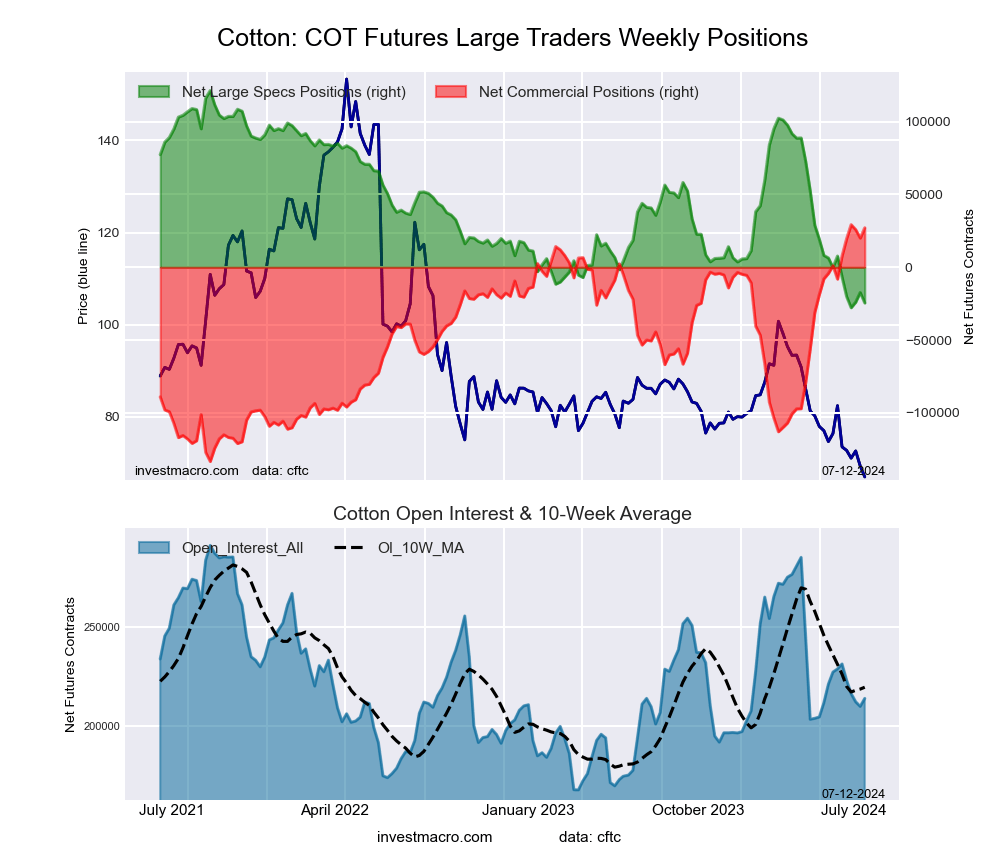 The COTTON large speculator standing this week totaled a net position of -24,509 contracts in the data reported through Tuesday. This was a weekly fall of -7,188 contracts from the previous week which had a total of -17,321 net contracts.
This week’s current strength score (the trader positioning range over the past three years, measured from 0 to 100) shows the speculators are currently Bearish-Extreme with a score of 2.2 percent. The commercials are Bullish-Extreme with a score of 98.7 percent and the small traders (not shown in chart) are Bearish-Extreme with a score of 0.7 percent.
Price Trend-Following Model: Downtrend
Our weekly trend-following model classifies the current market price position as: Downtrend. The current action for the model is considered to be: Hold – Maintain Short Position.
| COTTON Futures Statistics | SPECULATORS | COMMERCIALS | SMALL TRADERS |
| – Percent of Open Interest Longs: | 28.2 | 49.2 | 5.1 |
| – Percent of Open Interest Shorts: | 39.7 | 36.5 | 6.3 |
| – Net Position: | -24,509 | 27,098 | -2,589 |
| – Gross Longs: | 60,412 | 105,227 | 10,940 |
| – Gross Shorts: | 84,921 | 78,129 | 13,529 |
| – Long to Short Ratio: | 0.7 to 1 | 1.3 to 1 | 0.8 to 1 |
| NET POSITION TREND: | |||
| – Strength Index Score (3 Year Range Pct): | 2.2 | 98.7 | 0.7 |
| – Strength Index Reading (3 Year Range): | Bearish-Extreme | Bullish-Extreme | Bearish-Extreme |
| NET POSITION MOVEMENT INDEX: | |||
| – 6-Week Change in Strength Index: | -21.6 | 21.7 | -18.4 |
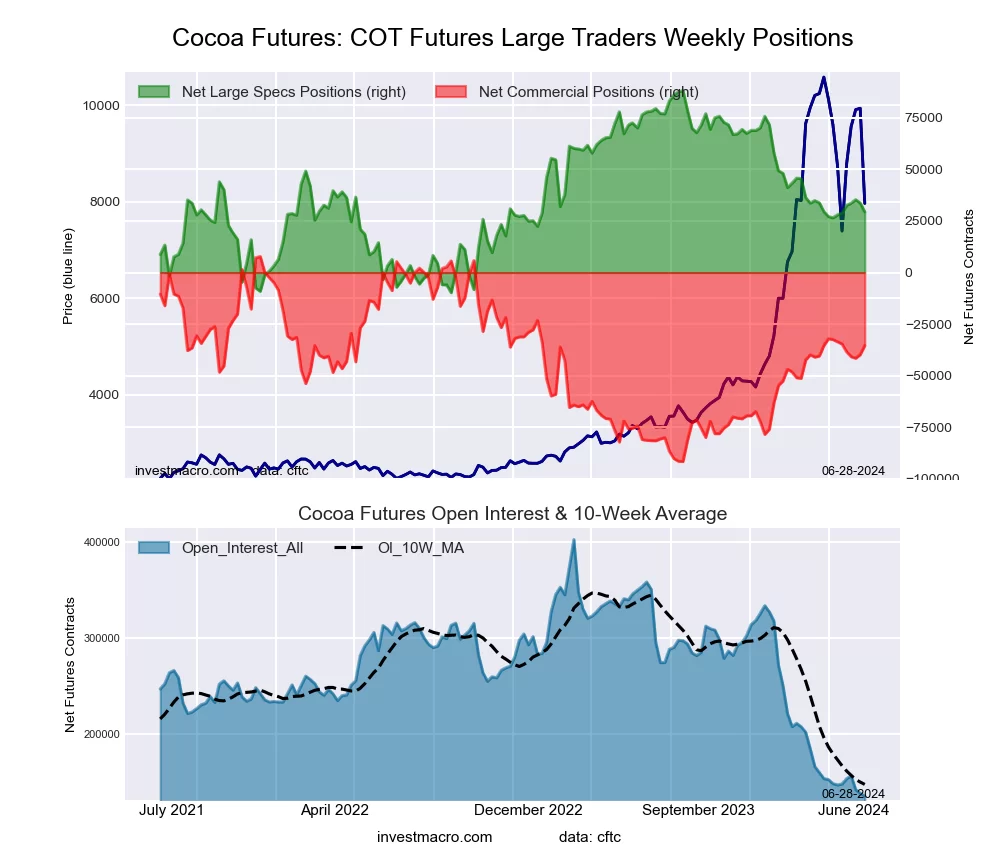
COCOA Futures:
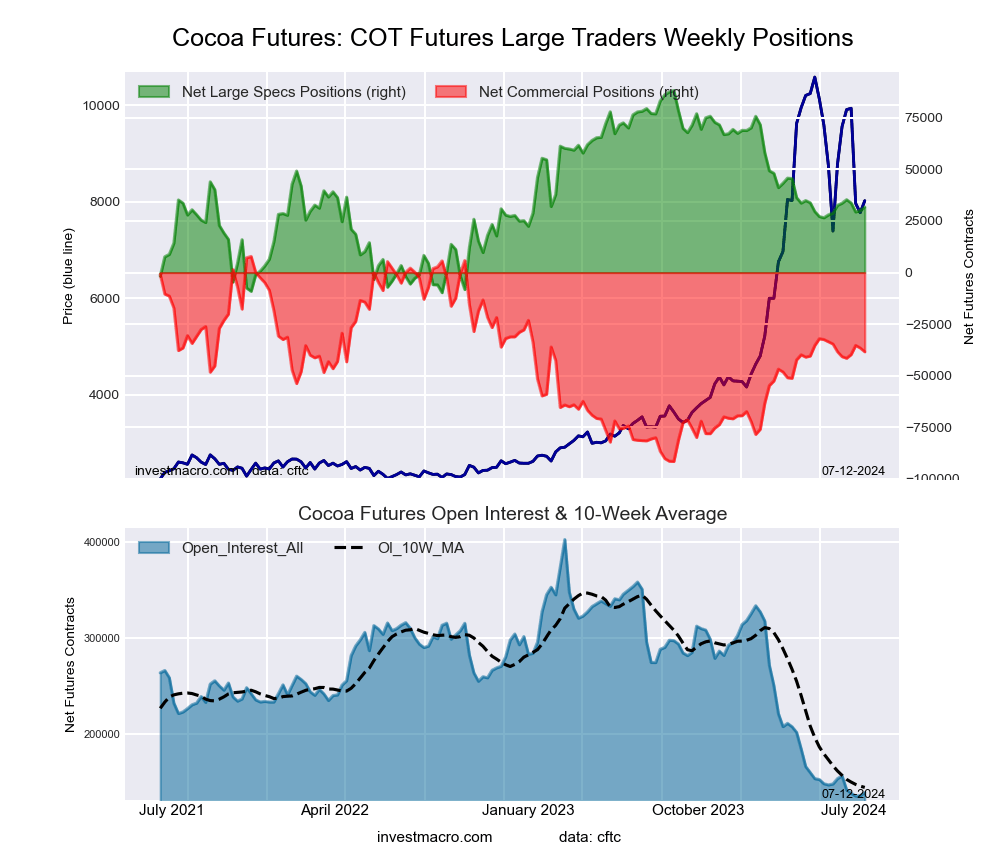 The COCOA large speculator standing this week totaled a net position of 31,740 contracts in the data reported through Tuesday. This was a weekly lift of 1,578 contracts from the previous week which had a total of 30,162 net contracts.
This week’s current strength score (the trader positioning range over the past three years, measured from 0 to 100) shows the speculators are currently Bearish with a score of 42.3 percent. The commercials are Bullish with a score of 53.5 percent and the small traders (not shown in chart) are Bullish with a score of 69.1 percent.
Price Trend-Following Model: Weak Uptrend
Our weekly trend-following model classifies the current market price position as: Weak Uptrend. The current action for the model is considered to be: Hold – Maintain Long Position.
| COCOA Futures Statistics | SPECULATORS | COMMERCIALS | SMALL TRADERS |
| – Percent of Open Interest Longs: | 32.7 | 34.1 | 8.6 |
| – Percent of Open Interest Shorts: | 9.8 | 61.8 | 3.8 |
| – Net Position: | 31,740 | -38,427 | 6,687 |
| – Gross Longs: | 45,335 | 47,143 | 11,883 |
| – Gross Shorts: | 13,595 | 85,570 | 5,196 |
| – Long to Short Ratio: | 3.3 to 1 | 0.6 to 1 | 2.3 to 1 |
| NET POSITION TREND: | |||
| – Strength Index Score (3 Year Range Pct): | 42.3 | 53.5 | 69.1 |
| – Strength Index Reading (3 Year Range): | Bearish | Bullish | Bullish |
| NET POSITION MOVEMENT INDEX: | |||
| – 6-Week Change in Strength Index: | -0.8 | -0.0 | 7.1 |
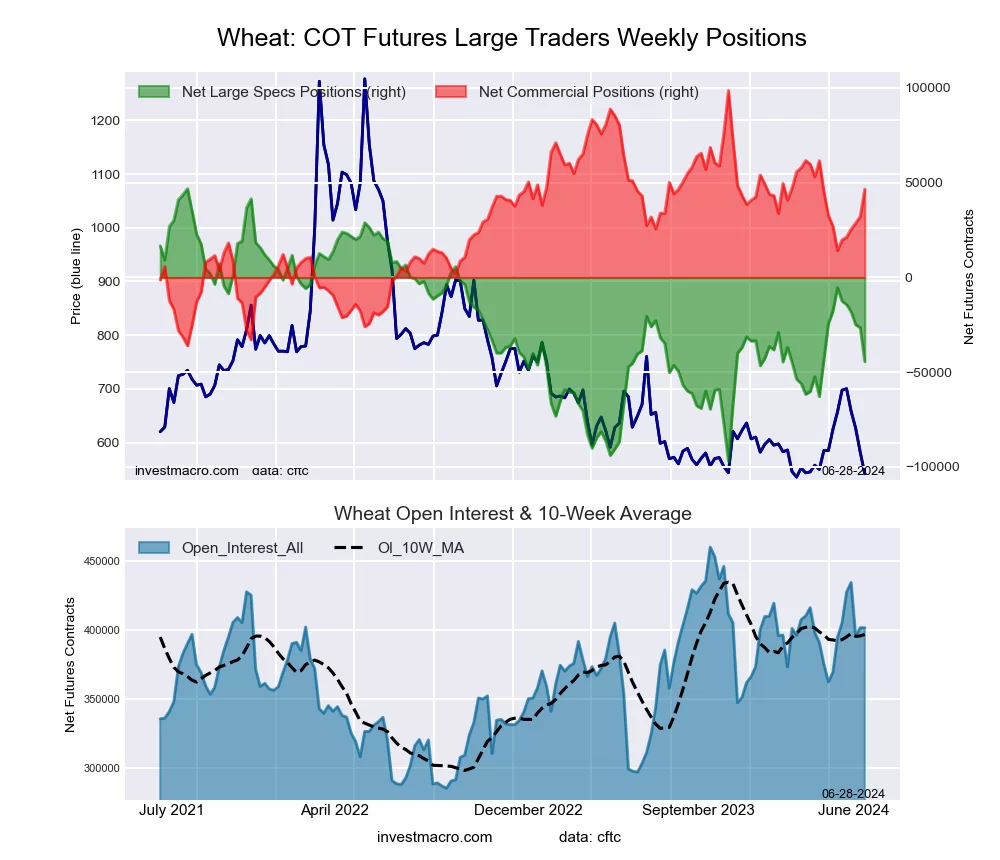
WHEAT Futures:
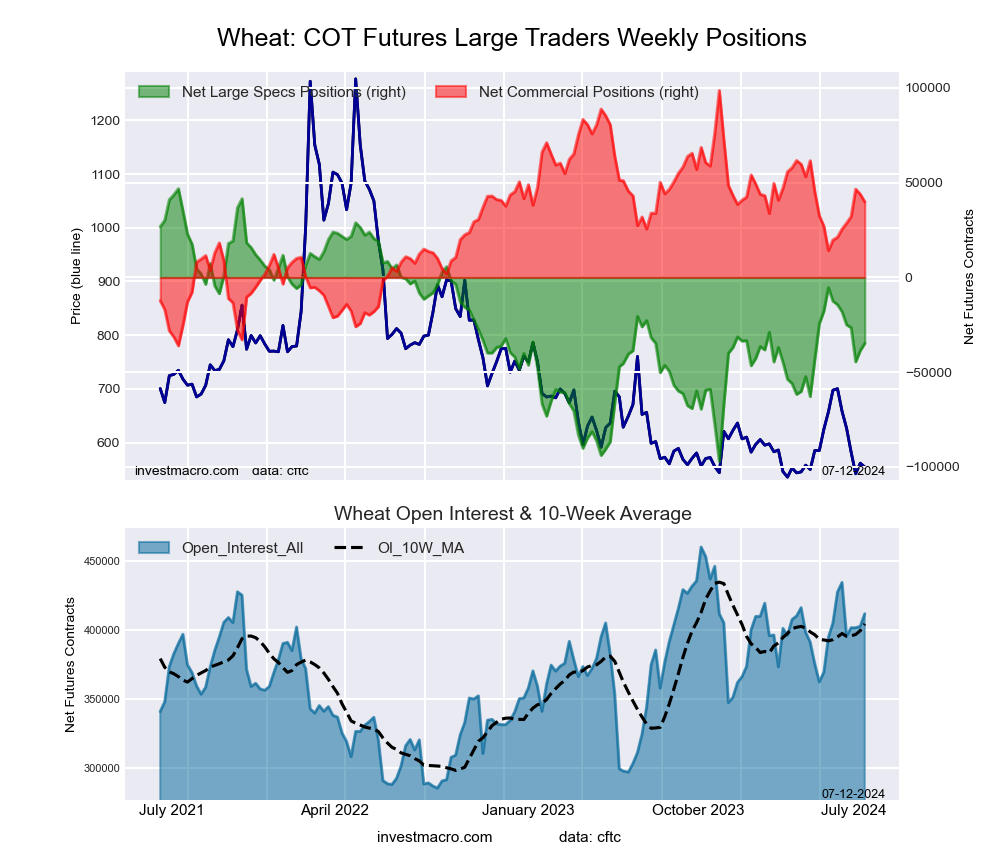 The WHEAT large speculator standing this week totaled a net position of -34,786 contracts in the data reported through Tuesday. This was a weekly gain of 3,904 contracts from the previous week which had a total of -38,690 net contracts.
This week’s current strength score (the trader positioning range over the past three years, measured from 0 to 100) shows the speculators are currently Bearish with a score of 43.3 percent. The commercials are Bullish with a score of 56.4 percent and the small traders (not shown in chart) are Bearish with a score of 42.1 percent.
Price Trend-Following Model: Weak Uptrend
Our weekly trend-following model classifies the current market price position as: Weak Uptrend. The current action for the model is considered to be: Hold – Maintain Long Position.
| WHEAT Futures Statistics | SPECULATORS | COMMERCIALS | SMALL TRADERS |
| – Percent of Open Interest Longs: | 31.8 | 38.4 | 7.8 |
| – Percent of Open Interest Shorts: | 40.3 | 28.7 | 9.0 |
| – Net Position: | -34,786 | 39,865 | -5,079 |
| – Gross Longs: | 131,162 | 158,097 | 32,120 |
| – Gross Shorts: | 165,948 | 118,232 | 37,199 |
| – Long to Short Ratio: | 0.8 to 1 | 1.3 to 1 | 0.9 to 1 |
| NET POSITION TREND: | |||
| – Strength Index Score (3 Year Range Pct): | 43.3 | 56.4 | 42.1 |
| – Strength Index Reading (3 Year Range): | Bearish | Bullish | Bearish |
| NET POSITION MOVEMENT INDEX: | |||
| – 6-Week Change in Strength Index: | -14.2 | 13.8 | 7.8 |
Article By InvestMacro – Receive our weekly COT Newsletter
*COT Report: The COT data, released weekly to the public each Friday, is updated through the most recent Tuesday (data is 3 days old) and shows a quick view of how large speculators or non-commercials (for-profit traders) were positioned in the futures markets.
The CFTC categorizes trader positions according to commercial hedgers (traders who use futures contracts for hedging as part of the business), non-commercials (large traders who speculate to realize trading profits) and nonreportable traders (usually small traders/speculators) as well as their open interest (contracts open in the market at time of reporting). See CFTC criteria here.