By InvestMacro

Here are the latest charts and statistics for the Commitment of Traders (COT) reports data published by the Commodities Futures Trading Commission (CFTC).
The latest COT data is updated through Tuesday January 20th and shows a quick view of how large traders (for-profit speculators and commercial hedgers) were positioned in the futures markets.
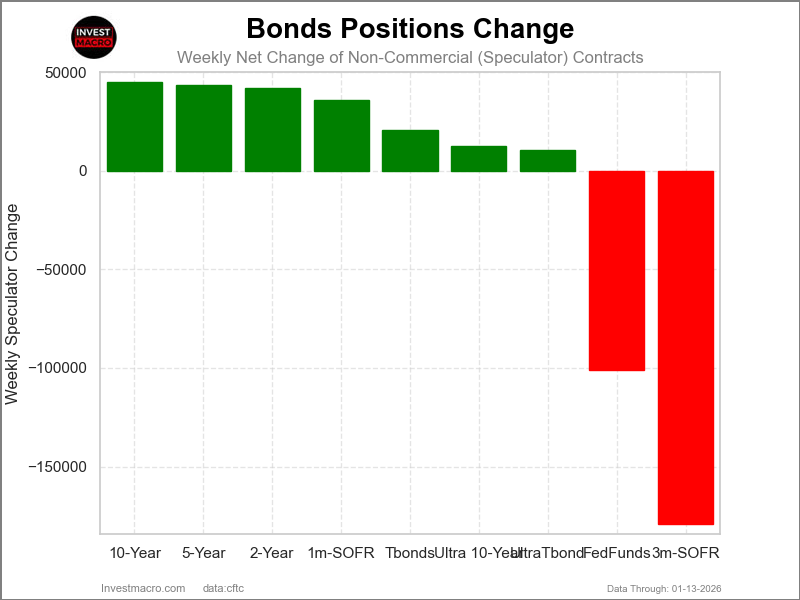
Weekly Speculator Changes led by 10-Year Bonds & 5-Year Bonds

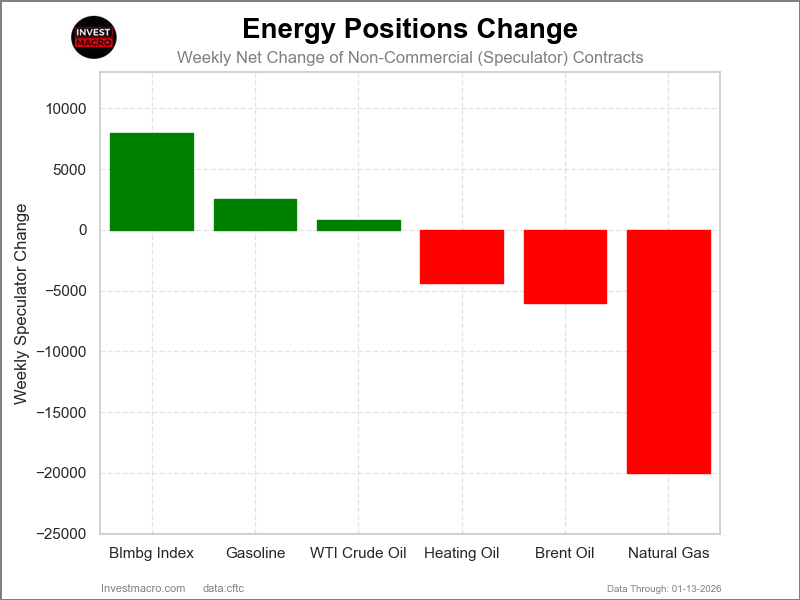
The COT bond market speculator bets were slightly lower overall this week as four out of the nine bond markets we cover had higher positioning while the other five markets had lower speculator contracts.
Leading the gains for the bond markets was the 10-Year Bonds (214,865 contracts) with the 5-Year Bonds (132,601 contracts), the 2-Year Bonds (79,758 contracts) and the Ultra 10-Year Bonds (13,920 contracts) also recording positive weeks.
The bond markets with declines in speculator bets for the week were the Fed Funds (-137,251 contracts), the SOFR 3-Months (-70,989 contracts), the US Treasury Bonds (-36,905 contracts), the Ultra Treasury Bonds (-23,725 contracts) and with the SOFR 1-Month (-689 contracts) also registering lower bets on the week.
Bond Market Price were relatively unchanged on the week
The bond market price changes this week were relatively muted. The one-month SOFR and the three-month SOFR markets were a bit higher over the past 5 days at 0.06% and 0.04% gains, respectively. The two-year bond also edged up by 0.04%, while the Fed Funds was virtually unchanged.
The five-year bond edged lower at -0.16, followed by the 10-year note, which saw a minor dip of -0.36, and the long US Treasury bond was lower by -0.43. Over the past 30 days, the bond markets have not seen much movement, with no market seeing a move higher or lower by over one percent. Over the past 90 days, the Fed Funds is up by 1.80% while on the downside, the 10-year note is lower by -1.23% and the long US Treasury bond is lower by -2.47%.
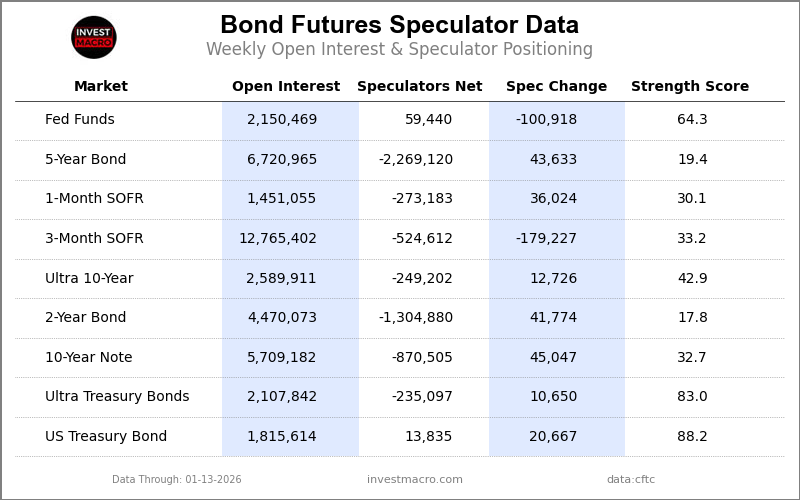
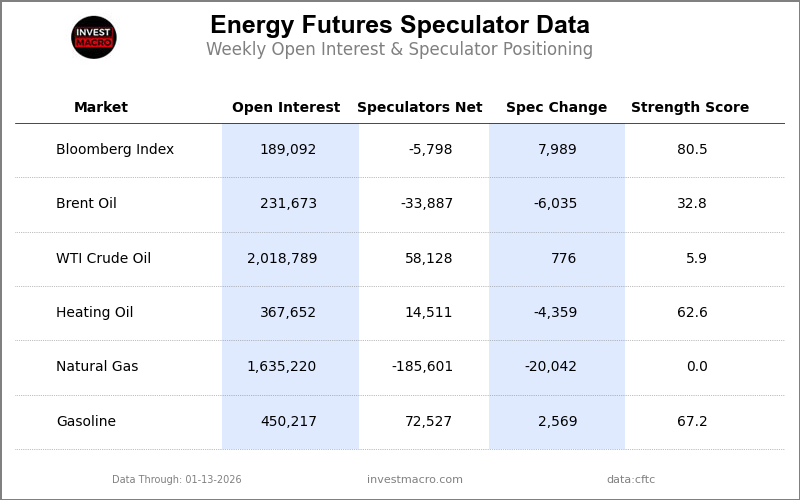
Bonds Data:
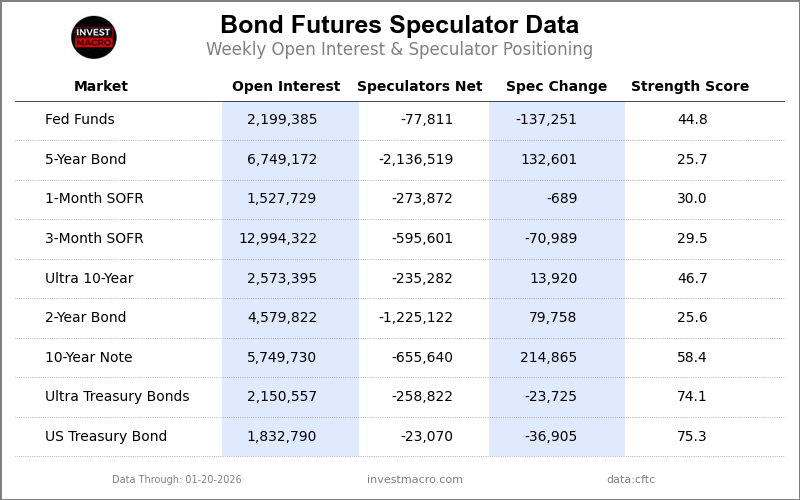
Legend: Open Interest | Speculators Current Net Position | Weekly Specs Change | Specs Strength Score compared to last 3-Years (0-100 range)
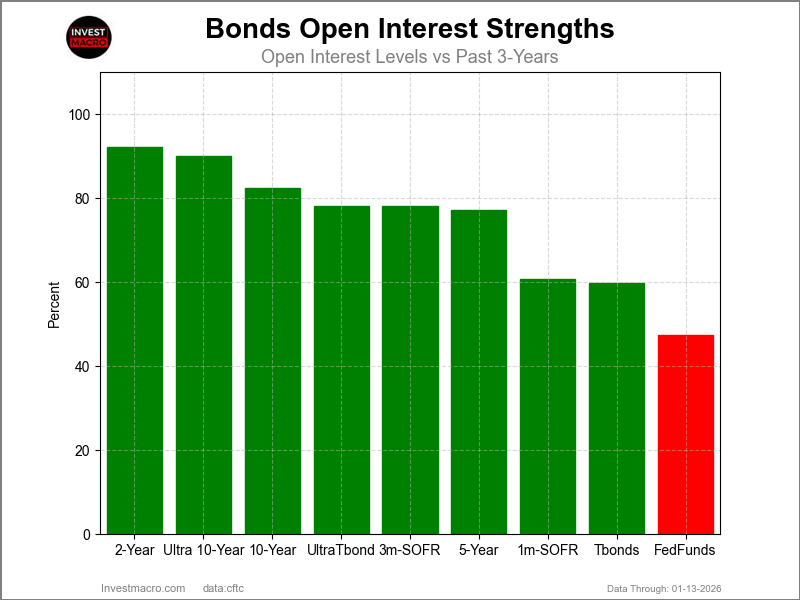
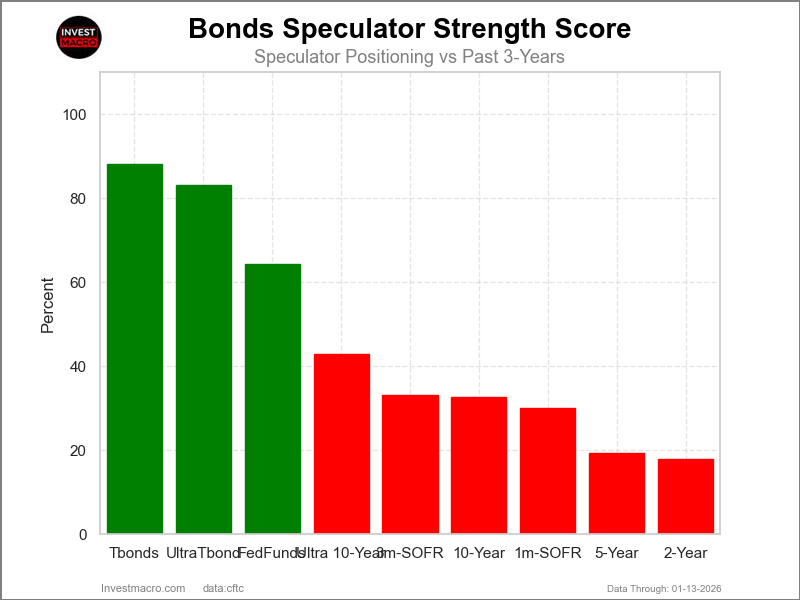
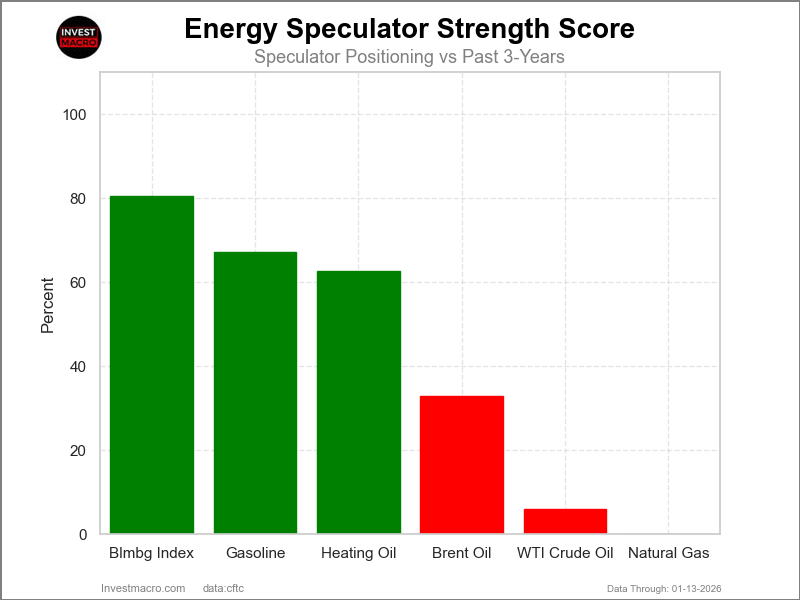
Strength Scores led by US Treasury Bonds & Ultra Treasury Bonds
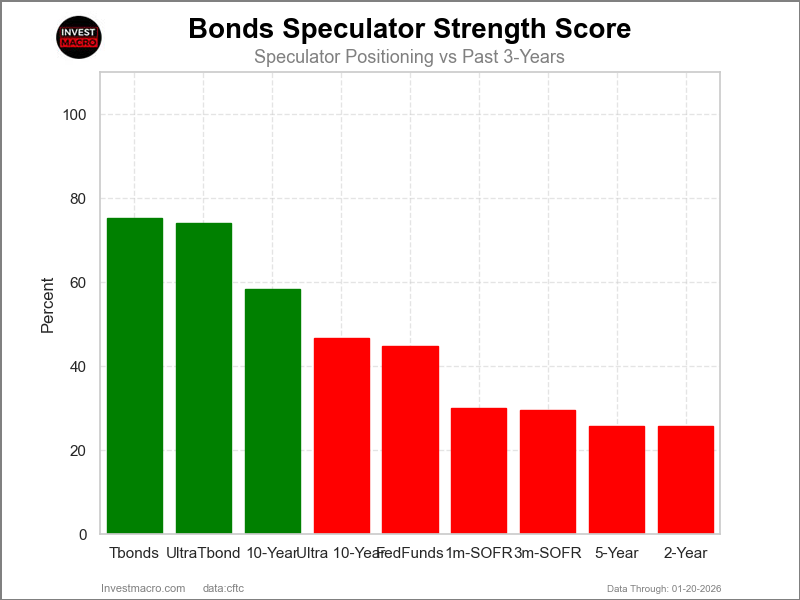
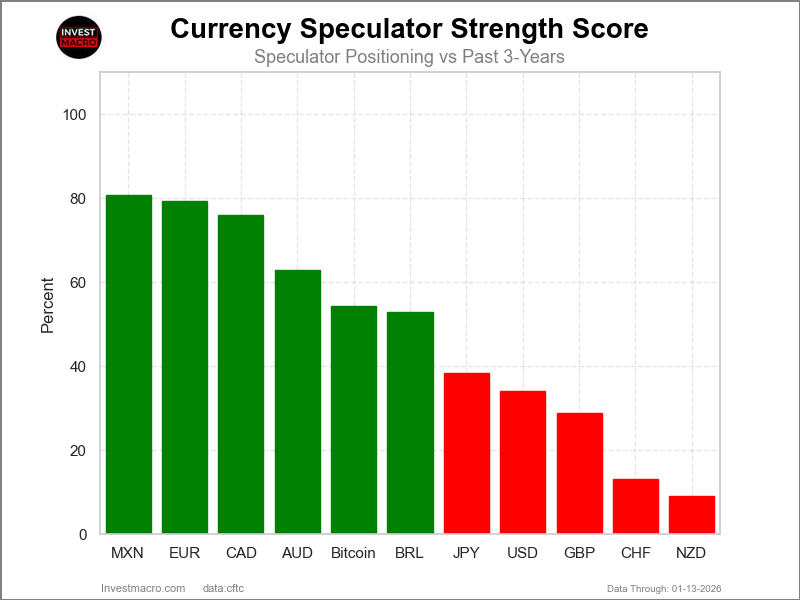
COT Strength Scores (a normalized measure of Speculator positions over a 3-Year range, from 0 to 100 where above 80 is Extreme-Bullish and below 20 is Extreme-Bearish) showed that the US Treasury Bonds (75 percent) and the Ultra Treasury Bonds (74 percent) lead the bond markets this week. The 10-Year Bonds (58 percent) comes in as the next highest in the weekly strength scores.
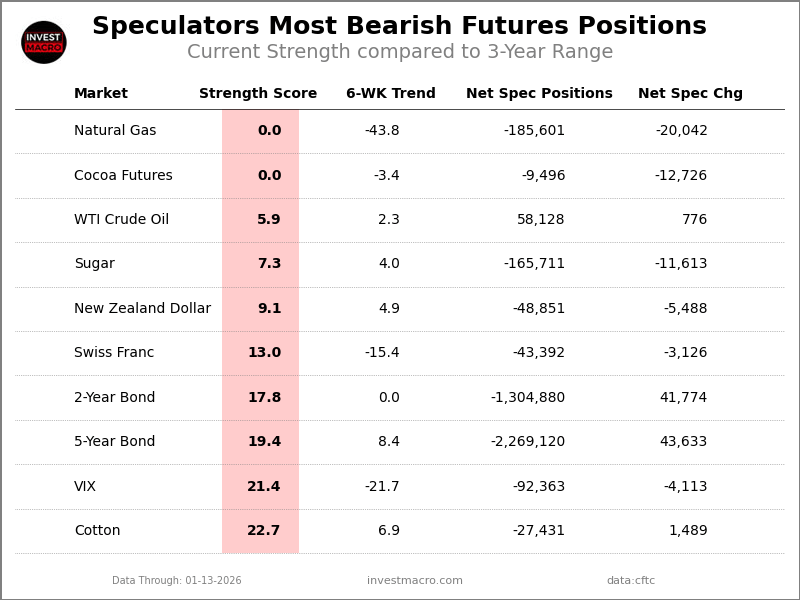
On the downside, the 2-Year Bonds (26 percent), the 5-Year Bond (26 percent), the SOFR 1-Month (30 percent) and the SOFR 3-Months (30 percent) come in at the lowest strength levels currently.
Strength Statistics:
Fed Funds (44.8 percent) vs Fed Funds previous week (64.3 percent)
2-Year Bond (25.6 percent) vs 2-Year Bond previous week (17.8 percent)
5-Year Bond (25.7 percent) vs 5-Year Bond previous week (19.4 percent)
10-Year Bond (58.4 percent) vs 10-Year Bond previous week (32.7 percent)
Ultra 10-Year Bond (46.7 percent) vs Ultra 10-Year Bond previous week (42.9 percent)
US Treasury Bond (75.3 percent) vs US Treasury Bond previous week (88.2 percent)
Ultra US Treasury Bond (74.1 percent) vs Ultra US Treasury Bond previous week (83.0 percent)
SOFR 1-Month (30.0 percent) vs SOFR 1-Month previous week (30.1 percent)
SOFR 3-Months (29.5 percent) vs SOFR 3-Months previous week (33.2 percent)
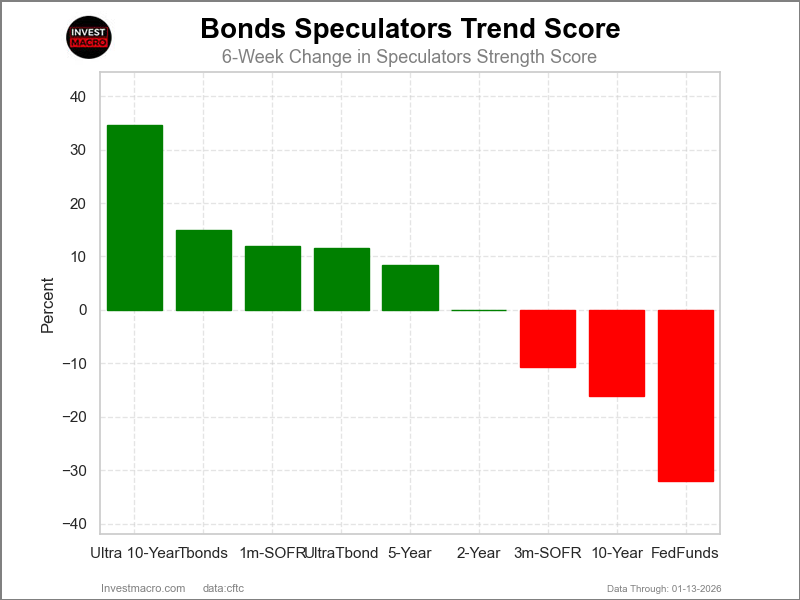
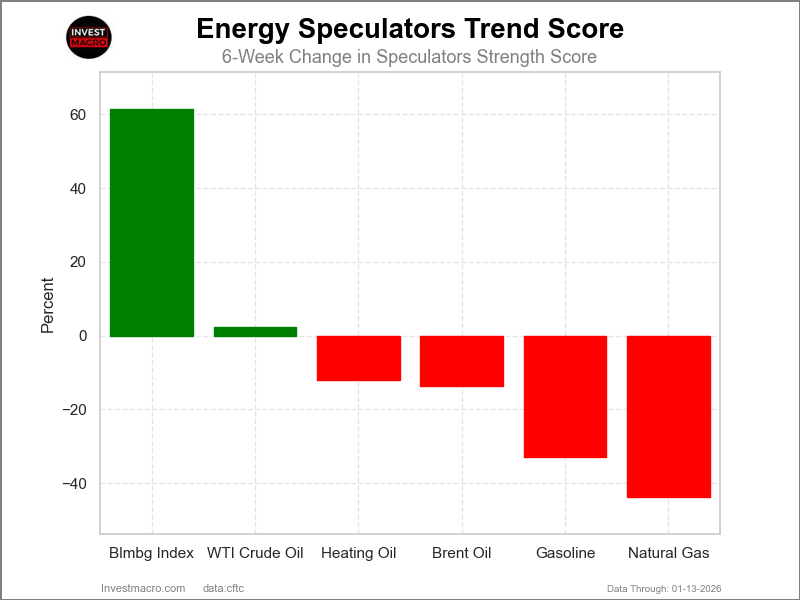
Ultra 10-Year Bonds & SOFR 1-Month top the 6-Week Strength Trends

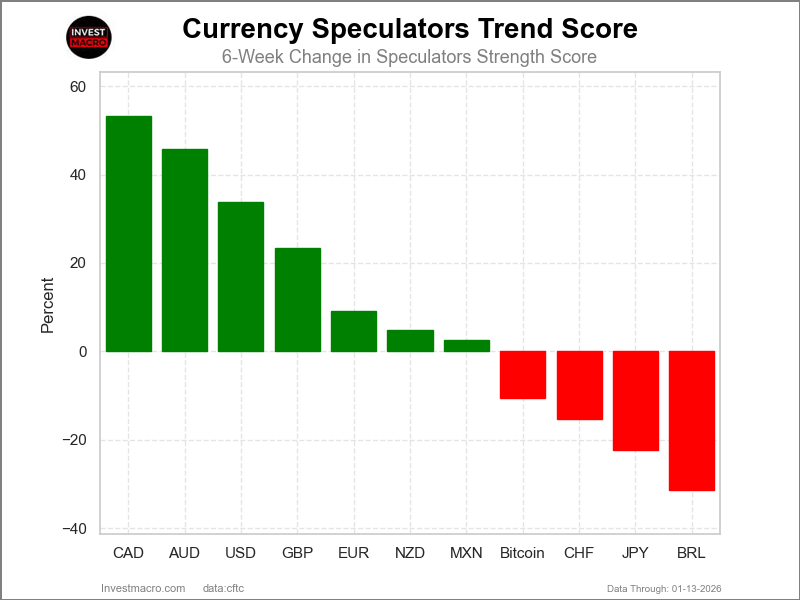
COT Strength Score Trends (or move index, calculates the 6-week changes in strength scores) showed that the Ultra 10-Year Bonds (31 percent) and the SOFR 1-Month (19 percent) lead the past six weeks trends for bonds. The 2-Year Bonds (16 percent) are the next highest positive movers in the latest trends data.
The Fed Funds (-55 percent) leads the downside trend scores currently with the SOFR 3-Months (-15 percent) following next with lower trend scores.
Strength Trend Statistics:
Fed Funds (-55.2 percent) vs Fed Funds previous week (-31.9 percent)
2-Year Bond (16.0 percent) vs 2-Year Bond previous week (0.0 percent)
5-Year Bond (12.2 percent) vs 5-Year Bond previous week (8.4 percent)
10-Year Bond (3.7 percent) vs 10-Year Bond previous week (-16.0 percent)
Ultra 10-Year Bond (31.0 percent) vs Ultra 10-Year Bond previous week (34.5 percent)
US Treasury Bond (6.0 percent) vs US Treasury Bond previous week (15.0 percent)
Ultra US Treasury Bond (-8.6 percent) vs Ultra US Treasury Bond previous week (11.5 percent)
SOFR 1-Month (19.3 percent) vs SOFR 1-Month previous week (12.0 percent)
SOFR 3-Months (-15.4 percent) vs SOFR 3-Months previous week (-10.6 percent)
30-Day Federal Funds Futures:
 The 30-Day Federal Funds large speculator standing this week equaled a net position of -77,811 contracts in the data reported through Tuesday. This was a weekly reduction of -137,251 contracts from the previous week which had a total of 59,440 net contracts.
This week’s current strength score (the trader positioning range over the past three years, measured from 0 to 100) shows the speculators are currently Bearish with a score of 44.8 percent. The commercials are Bullish with a score of 53.0 percent and the small traders (not shown in chart) are Bullish-Extreme with a score of 89.0 percent.
Price Trend-Following Model: Uptrend
Our weekly trend-following model classifies the current market price position as: Uptrend.
| 30-Day Federal Funds Statistics | SPECULATORS | COMMERCIALS | SMALL TRADERS |
| – Percent of Open Interest Longs: | 16.7 | 62.2 | 2.4 |
| – Percent of Open Interest Shorts: | 20.3 | 59.6 | 1.5 |
| – Net Position: | -77,811 | 57,423 | 20,388 |
| – Gross Longs: | 367,713 | 1,368,009 | 53,049 |
| – Gross Shorts: | 445,524 | 1,310,586 | 32,661 |
| – Long to Short Ratio: | 0.8 to 1 | 1.0 to 1 | 1.6 to 1 |
| NET POSITION TREND: | |||
| – Strength Index Score (3 Year Range Pct): | 44.8 | 53.0 | 89.0 |
| – Strength Index Reading (3 Year Range): | Bearish | Bullish | Bullish-Extreme |
| NET POSITION MOVEMENT INDEX: | |||
| – 6-Week Change in Strength Index: | -55.2 | 53.0 | 21.0 |
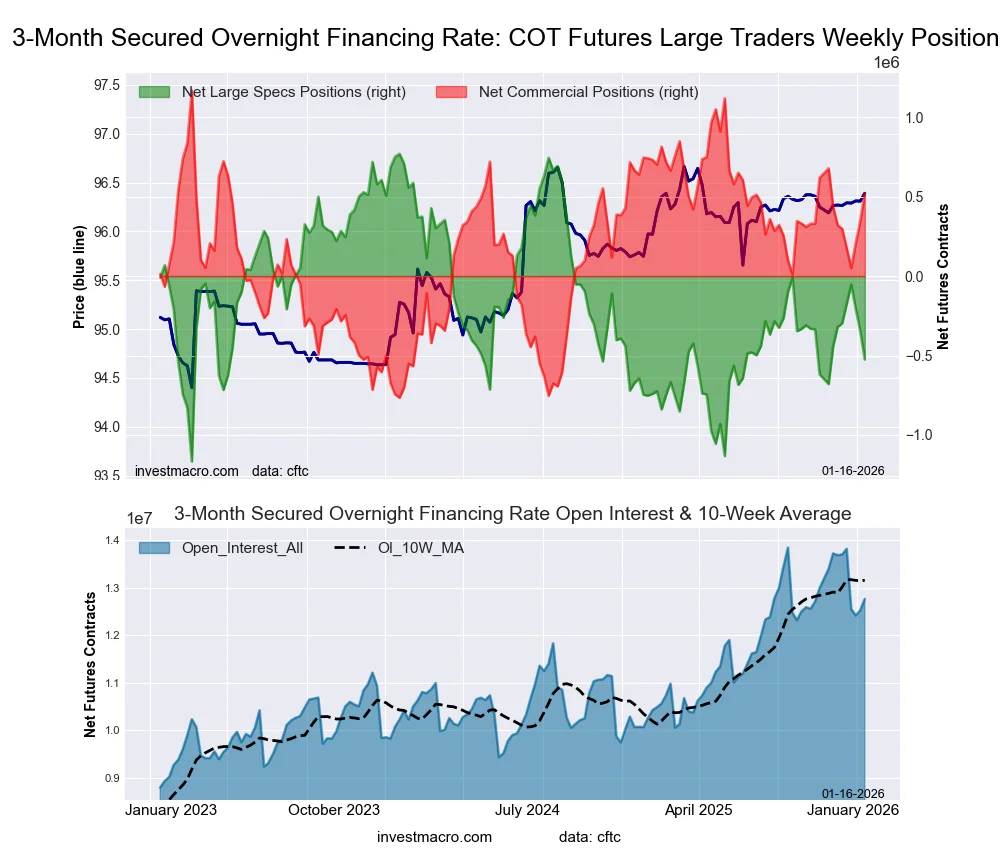
Secured Overnight Financing Rate (3-Month) Futures:
 The Secured Overnight Financing Rate (3-Month) large speculator standing this week equaled a net position of -595,601 contracts in the data reported through Tuesday. This was a weekly decrease of -70,989 contracts from the previous week which had a total of -524,612 net contracts.
This week’s current strength score (the trader positioning range over the past three years, measured from 0 to 100) shows the speculators are currently Bearish with a score of 29.5 percent. The commercials are Bullish with a score of 70.4 percent and the small traders (not shown in chart) are Bullish with a score of 77.8 percent.
Price Trend-Following Model: Weak Uptrend
Our weekly trend-following model classifies the current market price position as: Weak Uptrend.
| SOFR 3-Months Statistics | SPECULATORS | COMMERCIALS | SMALL TRADERS |
| – Percent of Open Interest Longs: | 13.4 | 56.8 | 0.3 |
| – Percent of Open Interest Shorts: | 17.9 | 52.2 | 0.3 |
| – Net Position: | -595,601 | 596,564 | -963 |
| – Gross Longs: | 1,736,807 | 7,384,520 | 33,194 |
| – Gross Shorts: | 2,332,408 | 6,787,956 | 34,157 |
| – Long to Short Ratio: | 0.7 to 1 | 1.1 to 1 | 1.0 to 1 |
| NET POSITION TREND: | |||
| – Strength Index Score (3 Year Range Pct): | 29.5 | 70.4 | 77.8 |
| – Strength Index Reading (3 Year Range): | Bearish | Bullish | Bullish |
| NET POSITION MOVEMENT INDEX: | |||
| – 6-Week Change in Strength Index: | -15.4 | 15.5 | -0.2 |
Individual Bond Markets:
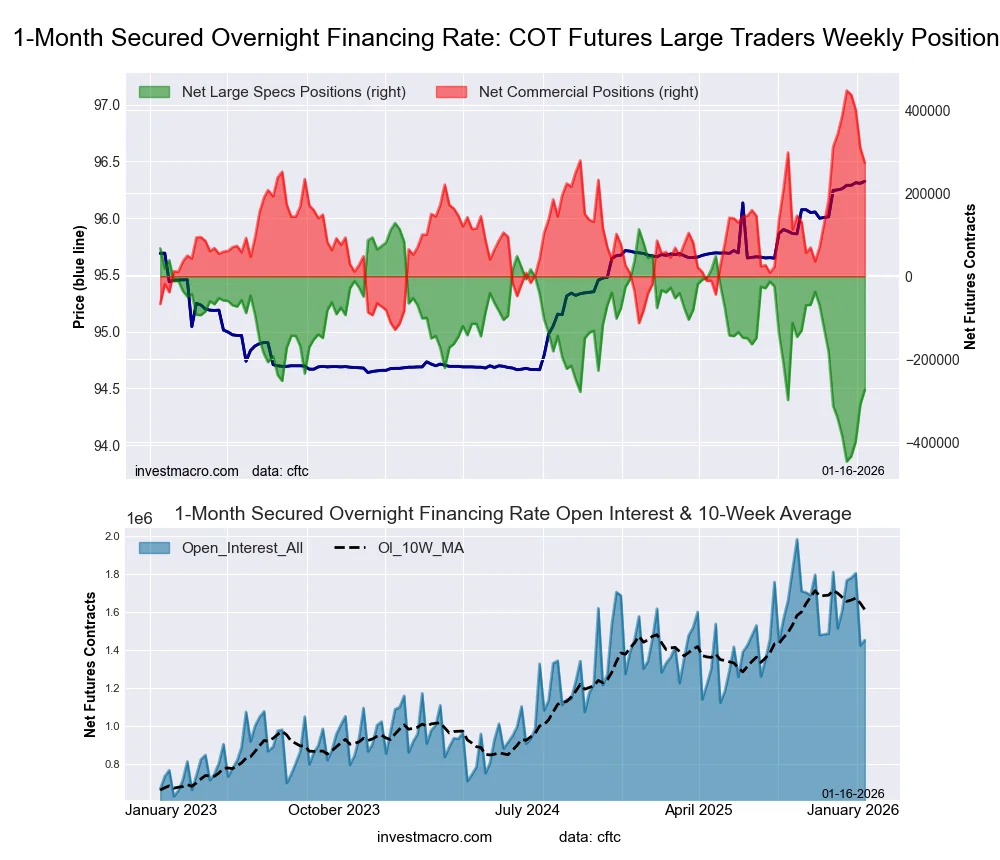
Secured Overnight Financing Rate (1-Month) Futures:
 The Secured Overnight Financing Rate (1-Month) large speculator standing this week equaled a net position of -273,872 contracts in the data reported through Tuesday. This was a weekly lowering of -689 contracts from the previous week which had a total of -273,183 net contracts.
This week’s current strength score (the trader positioning range over the past three years, measured from 0 to 100) shows the speculators are currently Bearish with a score of 30.0 percent. The commercials are Bullish with a score of 70.0 percent and the small traders (not shown in chart) are Bullish with a score of 66.7 percent.
Price Trend-Following Model: Uptrend
Our weekly trend-following model classifies the current market price position as: Uptrend.
| SOFR 1-Month Statistics | SPECULATORS | COMMERCIALS | SMALL TRADERS |
| – Percent of Open Interest Longs: | 16.3 | 69.6 | 0.0 |
| – Percent of Open Interest Shorts: | 34.3 | 51.7 | 0.0 |
| – Net Position: | -273,872 | 273,962 | -90 |
| – Gross Longs: | 249,472 | 1,063,233 | 174 |
| – Gross Shorts: | 523,344 | 789,271 | 264 |
| – Long to Short Ratio: | 0.5 to 1 | 1.3 to 1 | 0.7 to 1 |
| NET POSITION TREND: | |||
| – Strength Index Score (3 Year Range Pct): | 30.0 | 70.0 | 66.7 |
| – Strength Index Reading (3 Year Range): | Bearish | Bullish | Bullish |
| NET POSITION MOVEMENT INDEX: | |||
| – 6-Week Change in Strength Index: | 19.3 | -19.5 | 2.4 |
2-Year Treasury Note Futures:
 The 2-Year Treasury Note large speculator standing this week equaled a net position of -1,225,122 contracts in the data reported through Tuesday. This was a weekly boost of 79,758 contracts from the previous week which had a total of -1,304,880 net contracts.
This week’s current strength score (the trader positioning range over the past three years, measured from 0 to 100) shows the speculators are currently Bearish with a score of 25.6 percent. The commercials are Bullish with a score of 75.4 percent and the small traders (not shown in chart) are Bearish with a score of 43.9 percent.
Price Trend-Following Model: Weak Downtrend
Our weekly trend-following model classifies the current market price position as: Weak Downtrend.
| 2-Year Treasury Note Statistics | SPECULATORS | COMMERCIALS | SMALL TRADERS |
| – Percent of Open Interest Longs: | 16.4 | 74.1 | 5.4 |
| – Percent of Open Interest Shorts: | 43.2 | 49.8 | 3.0 |
| – Net Position: | -1,225,122 | 1,115,768 | 109,354 |
| – Gross Longs: | 752,084 | 3,395,299 | 245,486 |
| – Gross Shorts: | 1,977,206 | 2,279,531 | 136,132 |
| – Long to Short Ratio: | 0.4 to 1 | 1.5 to 1 | 1.8 to 1 |
| NET POSITION TREND: | |||
| – Strength Index Score (3 Year Range Pct): | 25.6 | 75.4 | 43.9 |
| – Strength Index Reading (3 Year Range): | Bearish | Bullish | Bearish |
| NET POSITION MOVEMENT INDEX: | |||
| – 6-Week Change in Strength Index: | 16.0 | -18.6 | 0.9 |
5-Year Treasury Note Futures:
 The 5-Year Treasury Note large speculator standing this week equaled a net position of -2,136,519 contracts in the data reported through Tuesday. This was a weekly advance of 132,601 contracts from the previous week which had a total of -2,269,120 net contracts.
This week’s current strength score (the trader positioning range over the past three years, measured from 0 to 100) shows the speculators are currently Bearish with a score of 25.7 percent. The commercials are Bullish with a score of 73.8 percent and the small traders (not shown in chart) are Bullish with a score of 68.0 percent.
Price Trend-Following Model: Strong Downtrend
Our weekly trend-following model classifies the current market price position as: Strong Downtrend.
| 5-Year Treasury Note Statistics | SPECULATORS | COMMERCIALS | SMALL TRADERS |
| – Percent of Open Interest Longs: | 8.9 | 81.9 | 6.5 |
| – Percent of Open Interest Shorts: | 40.6 | 52.4 | 4.4 |
| – Net Position: | -2,136,519 | 1,990,497 | 146,022 |
| – Gross Longs: | 603,975 | 5,528,980 | 440,705 |
| – Gross Shorts: | 2,740,494 | 3,538,483 | 294,683 |
| – Long to Short Ratio: | 0.2 to 1 | 1.6 to 1 | 1.5 to 1 |
| NET POSITION TREND: | |||
| – Strength Index Score (3 Year Range Pct): | 25.7 | 73.8 | 68.0 |
| – Strength Index Reading (3 Year Range): | Bearish | Bullish | Bullish |
| NET POSITION MOVEMENT INDEX: | |||
| – 6-Week Change in Strength Index: | 12.2 | -13.5 | -0.6 |
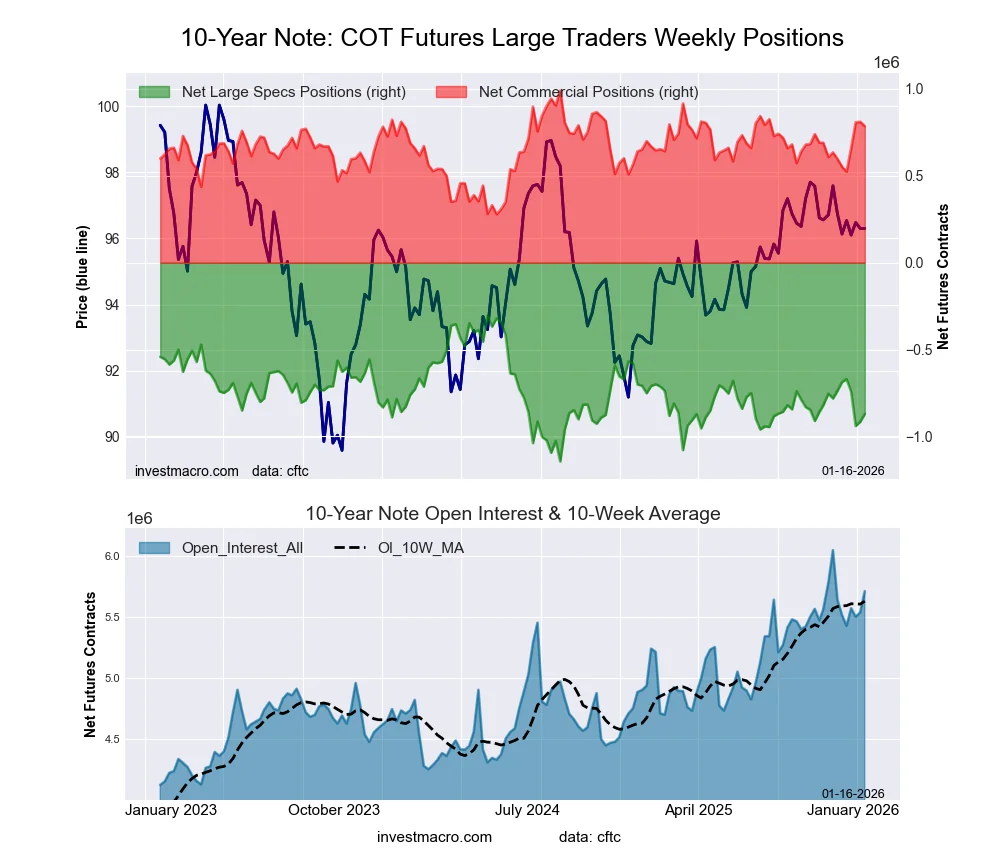
10-Year Treasury Note Futures:
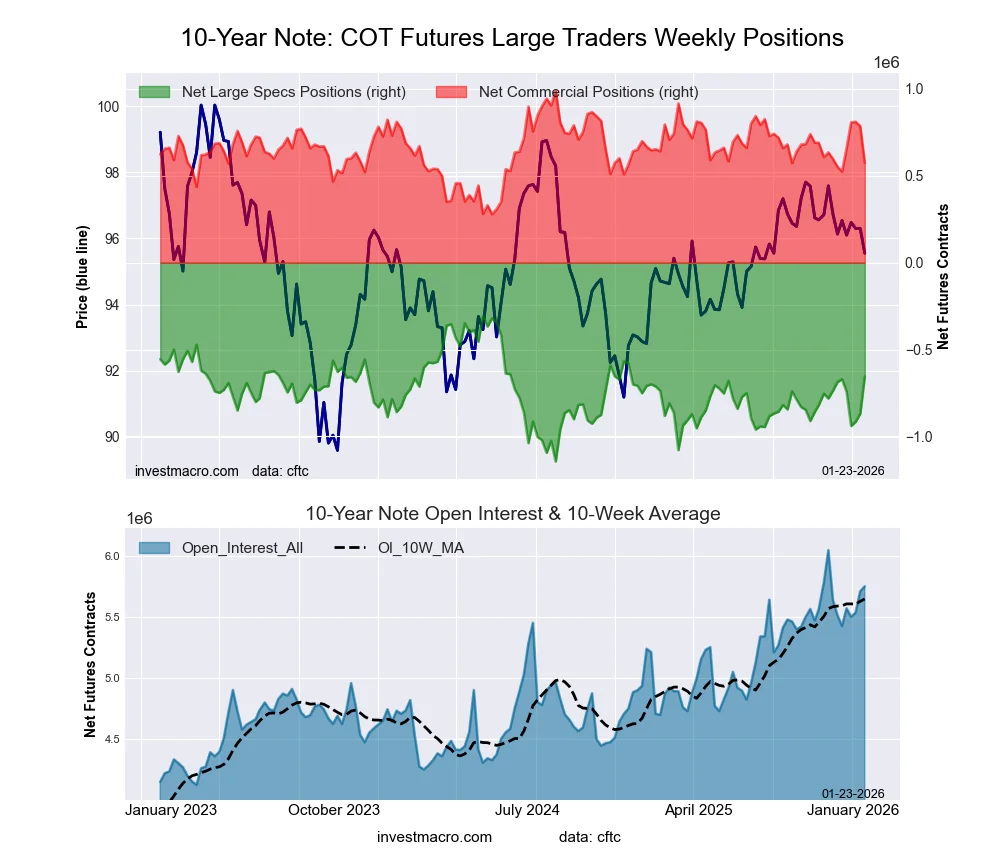 The 10-Year Treasury Note large speculator standing this week equaled a net position of -655,640 contracts in the data reported through Tuesday. This was a weekly advance of 214,865 contracts from the previous week which had a total of -870,505 net contracts.
This week’s current strength score (the trader positioning range over the past three years, measured from 0 to 100) shows the speculators are currently Bullish with a score of 58.4 percent. The commercials are Bearish with a score of 41.3 percent and the small traders (not shown in chart) are Bullish with a score of 67.6 percent.
Price Trend-Following Model: Strong Downtrend
Our weekly trend-following model classifies the current market price position as: Strong Downtrend.
| 10-Year Treasury Note Statistics | SPECULATORS | COMMERCIALS | SMALL TRADERS |
| – Percent of Open Interest Longs: | 15.0 | 73.9 | 7.7 |
| – Percent of Open Interest Shorts: | 26.4 | 63.9 | 6.2 |
| – Net Position: | -655,640 | 573,096 | 82,544 |
| – Gross Longs: | 861,222 | 4,248,520 | 441,892 |
| – Gross Shorts: | 1,516,862 | 3,675,424 | 359,348 |
| – Long to Short Ratio: | 0.6 to 1 | 1.2 to 1 | 1.2 to 1 |
| NET POSITION TREND: | |||
| – Strength Index Score (3 Year Range Pct): | 58.4 | 41.3 | 67.6 |
| – Strength Index Reading (3 Year Range): | Bullish | Bearish | Bullish |
| NET POSITION MOVEMENT INDEX: | |||
| – 6-Week Change in Strength Index: | 3.7 | 3.0 | -17.4 |
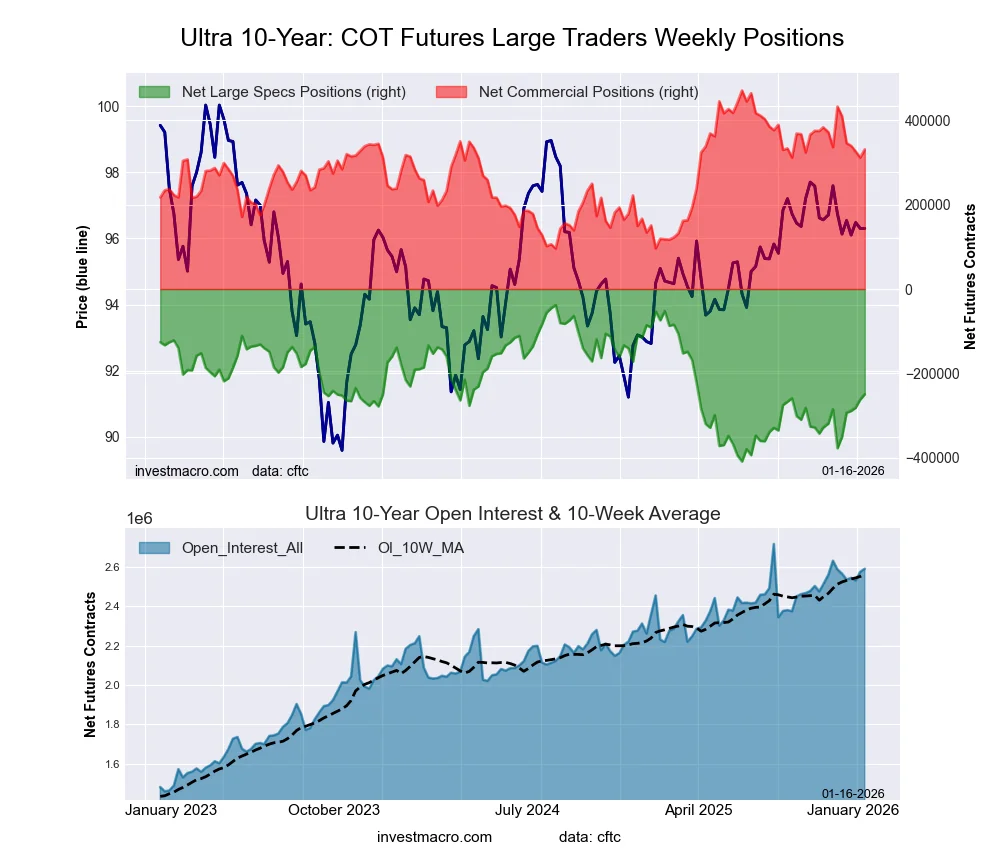
Ultra 10-Year Notes Futures:
 The Ultra 10-Year Notes large speculator standing this week equaled a net position of -235,282 contracts in the data reported through Tuesday. This was a weekly boost of 13,920 contracts from the previous week which had a total of -249,202 net contracts.
This week’s current strength score (the trader positioning range over the past three years, measured from 0 to 100) shows the speculators are currently Bearish with a score of 46.7 percent. The commercials are Bullish with a score of 68.7 percent and the small traders (not shown in chart) are Bearish-Extreme with a score of 0.0 percent.
Price Trend-Following Model: Strong Downtrend
Our weekly trend-following model classifies the current market price position as: Strong Downtrend.
| Ultra 10-Year Notes Statistics | SPECULATORS | COMMERCIALS | SMALL TRADERS |
| – Percent of Open Interest Longs: | 12.0 | 78.6 | 8.5 |
| – Percent of Open Interest Shorts: | 21.1 | 64.8 | 13.1 |
| – Net Position: | -235,282 | 352,921 | -117,639 |
| – Gross Longs: | 308,830 | 2,021,438 | 219,966 |
| – Gross Shorts: | 544,112 | 1,668,517 | 337,605 |
| – Long to Short Ratio: | 0.6 to 1 | 1.2 to 1 | 0.7 to 1 |
| NET POSITION TREND: | |||
| – Strength Index Score (3 Year Range Pct): | 46.7 | 68.7 | 0.0 |
| – Strength Index Reading (3 Year Range): | Bearish | Bullish | Bearish-Extreme |
| NET POSITION MOVEMENT INDEX: | |||
| – 6-Week Change in Strength Index: | 31.0 | -15.0 | -54.3 |
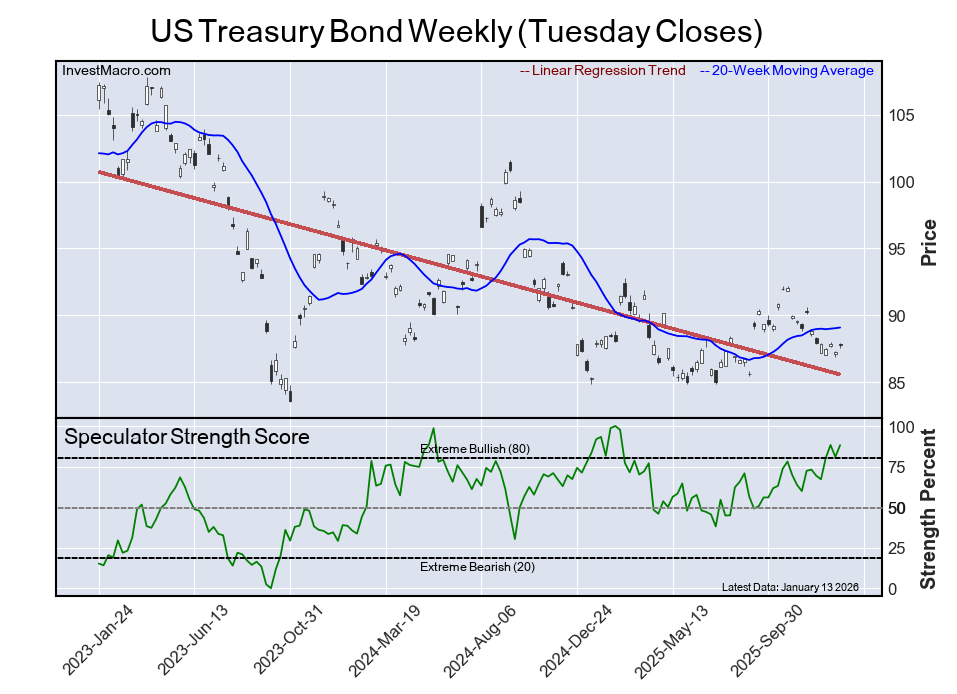
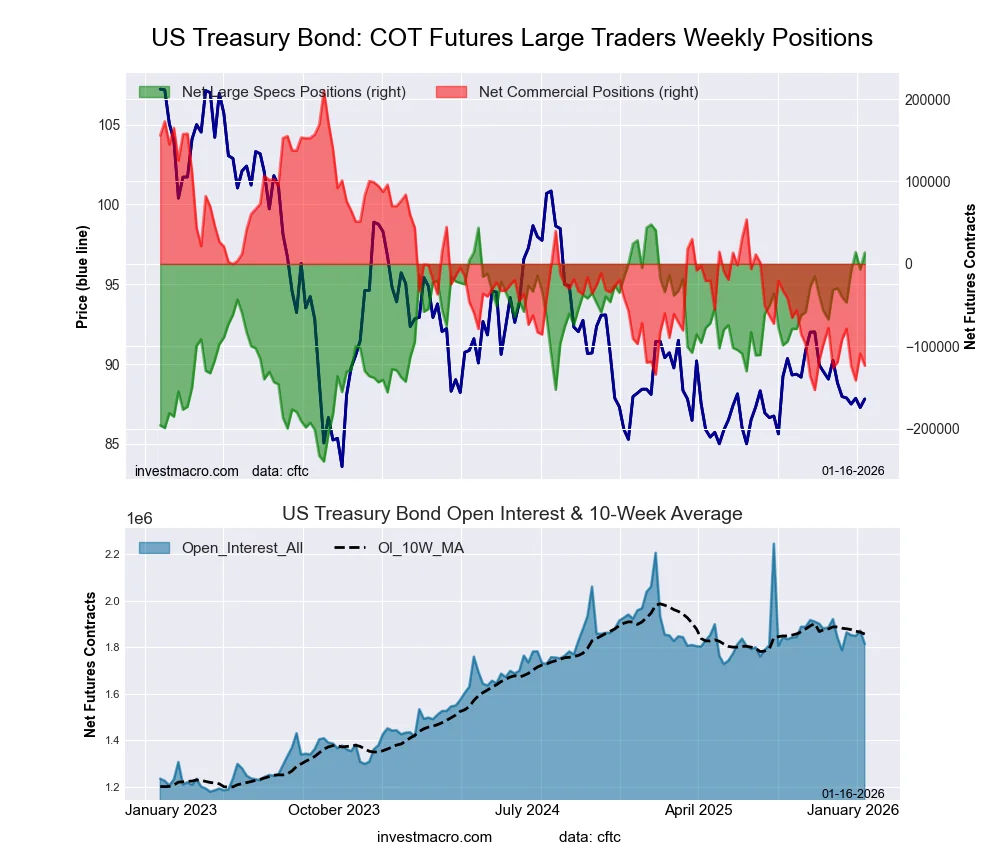
US Treasury Bonds Futures:
 The US Treasury Bonds large speculator standing this week equaled a net position of -23,070 contracts in the data reported through Tuesday. This was a weekly lowering of -36,905 contracts from the previous week which had a total of 13,835 net contracts.
This week’s current strength score (the trader positioning range over the past three years, measured from 0 to 100) shows the speculators are currently Bullish with a score of 75.3 percent. The commercials are Bearish-Extreme with a score of 16.2 percent and the small traders (not shown in chart) are Bullish with a score of 66.7 percent.
Price Trend-Following Model: Downtrend
Our weekly trend-following model classifies the current market price position as: Downtrend.
| US Treasury Bonds Statistics | SPECULATORS | COMMERCIALS | SMALL TRADERS |
| – Percent of Open Interest Longs: | 9.3 | 76.1 | 13.5 |
| – Percent of Open Interest Shorts: | 10.6 | 81.3 | 7.1 |
| – Net Position: | -23,070 | -93,965 | 117,035 |
| – Gross Longs: | 170,563 | 1,395,383 | 247,802 |
| – Gross Shorts: | 193,633 | 1,489,348 | 130,767 |
| – Long to Short Ratio: | 0.9 to 1 | 0.9 to 1 | 1.9 to 1 |
| NET POSITION TREND: | |||
| – Strength Index Score (3 Year Range Pct): | 75.3 | 16.2 | 66.7 |
| – Strength Index Reading (3 Year Range): | Bullish | Bearish-Extreme | Bullish |
| NET POSITION MOVEMENT INDEX: | |||
| – 6-Week Change in Strength Index: | 6.0 | -0.6 | -9.8 |
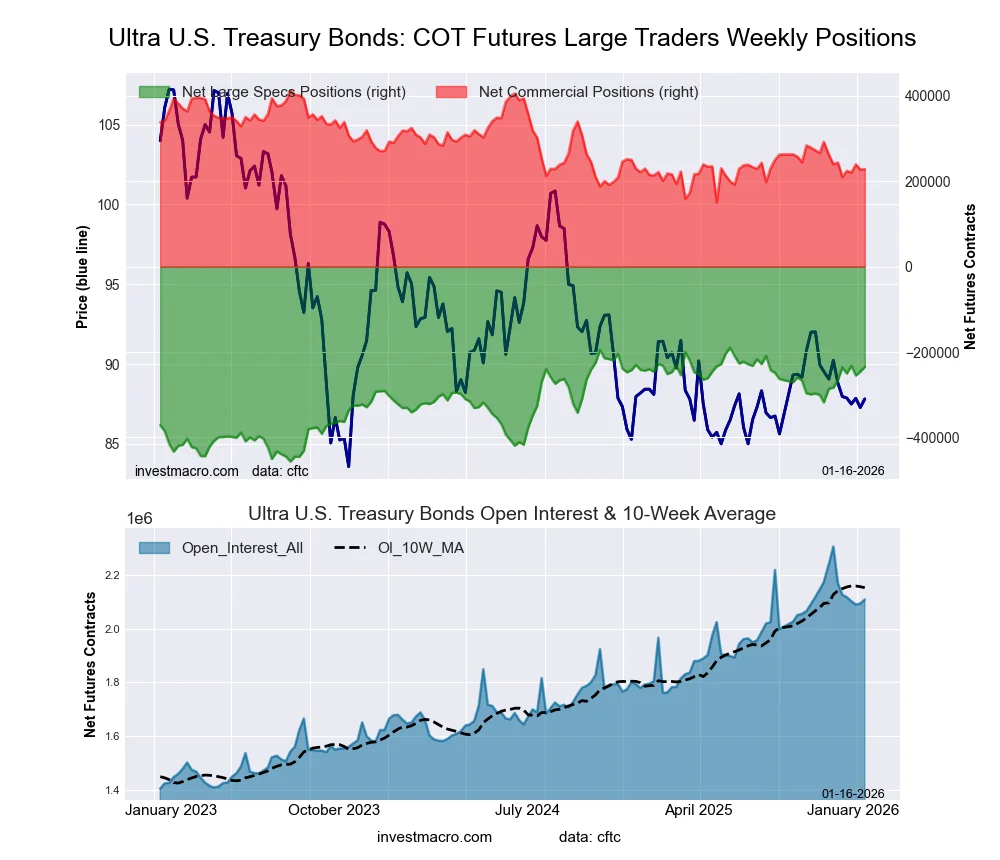
Ultra US Treasury Bonds Futures:
 The Ultra US Treasury Bonds large speculator standing this week equaled a net position of -258,822 contracts in the data reported through Tuesday. This was a weekly reduction of -23,725 contracts from the previous week which had a total of -235,097 net contracts.
This week’s current strength score (the trader positioning range over the past three years, measured from 0 to 100) shows the speculators are currently Bullish with a score of 74.1 percent. The commercials are Bearish with a score of 39.1 percent and the small traders (not shown in chart) are Bearish with a score of 20.8 percent.
Price Trend-Following Model: Downtrend
Our weekly trend-following model classifies the current market price position as: Downtrend.
| Ultra US Treasury Bonds Statistics | SPECULATORS | COMMERCIALS | SMALL TRADERS |
| – Percent of Open Interest Longs: | 6.9 | 83.3 | 8.7 |
| – Percent of Open Interest Shorts: | 19.0 | 71.5 | 8.4 |
| – Net Position: | -258,822 | 253,269 | 5,553 |
| – Gross Longs: | 149,136 | 1,791,990 | 187,039 |
| – Gross Shorts: | 407,958 | 1,538,721 | 181,486 |
| – Long to Short Ratio: | 0.4 to 1 | 1.2 to 1 | 1.0 to 1 |
| NET POSITION TREND: | |||
| – Strength Index Score (3 Year Range Pct): | 74.1 | 39.1 | 20.8 |
| – Strength Index Reading (3 Year Range): | Bullish | Bearish | Bearish |
| NET POSITION MOVEMENT INDEX: | |||
| – 6-Week Change in Strength Index: | -8.6 | 16.4 | -20.7 |
Article By InvestMacro – Receive our weekly COT Newsletter
*COT Report: The COT data, released weekly to the public each Friday, is updated through the most recent Tuesday (data is 3 days old) and shows a quick view of how large speculators or non-commercials (for-profit traders) were positioned in the futures markets.
The CFTC categorizes trader positions according to commercial hedgers (traders who use futures contracts for hedging as part of the business), non-commercials (large traders who speculate to realize trading profits) and nonreportable traders (usually small traders/speculators) as well as their open interest (contracts open in the market at time of reporting). See CFTC criteria here.