By InvestMacro
Here are the latest charts and statistics for the Commitment of Traders (COT) reports data published by the Commodities Futures Trading Commission (CFTC).
The latest COT data is updated through Tuesday February 3rd and shows a quick view of how large traders (for-profit speculators and commercial entities) were positioned in the futures markets.
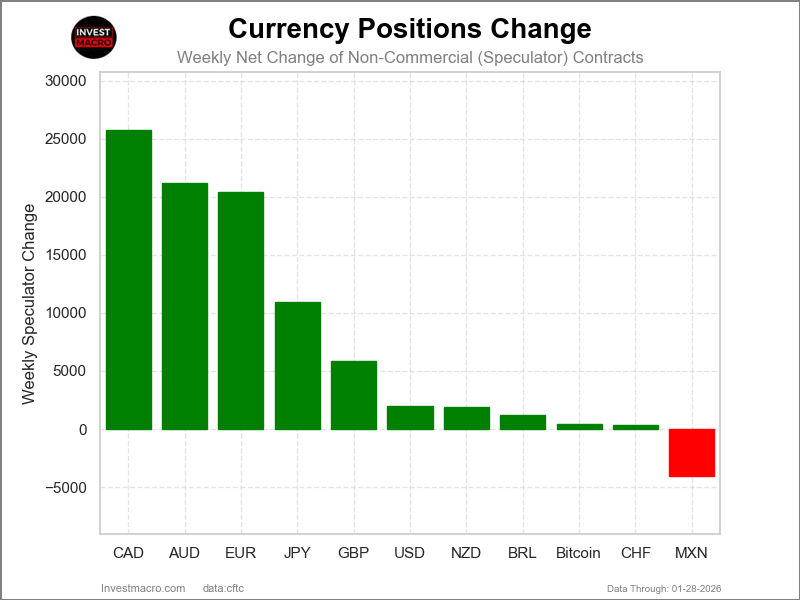
Weekly Speculator Changes led by Wheat & Lean Hogs
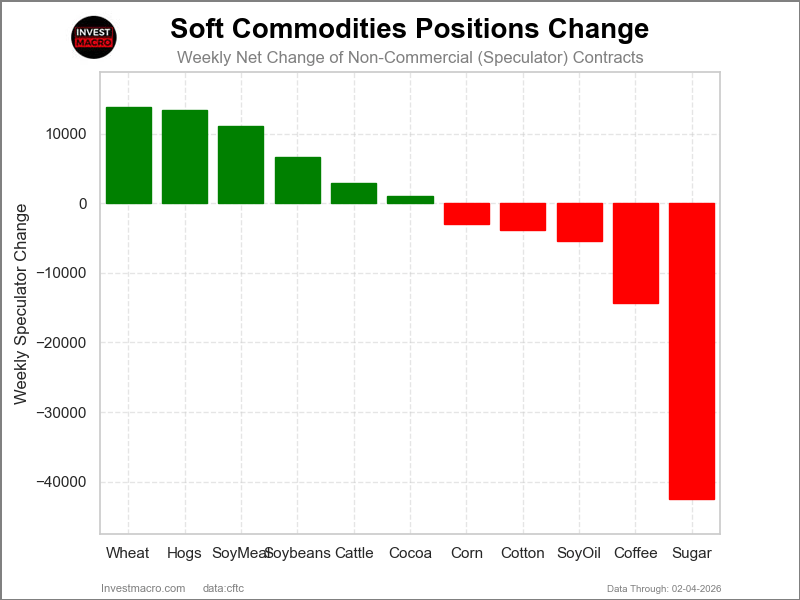
The COT soft commodities markets speculator bets were slightly higher this week as six out of the eleven softs markets we cover had higher positioning while the other five markets had lower speculator contracts.
Leading the gains for the softs markets was Lean Hogs (13,433 contracts) with Wheat (13,894 contracts), Soybean Meal (11,118 contracts), Soybeans (6,736 contracts), Live Cattle (2,871 contracts) and Cocoa (994 contracts) also showing positive weeks.
The markets with the declines in speculator bets this week were Sugar (-42,536 contracts), Coffee (-14,370 contracts), Soybean Oil (-5,369 contracts), Cotton (-3,777 contracts) and with Corn (-3,027 contracts) also registering lower bets on the week.
Soft commodities price performance was led by Lean Hogs, Soybean Oil, and Soybeans
The top movers this week in price performance for the soft commodities markets were Lean Hogs with a gain of 3.74%, followed by Soybean Oil which rose by 3.17%, and Soybeans which rose by 3.46% over the past five days. Corn was virtually unchanged with a small rise of 0.11%, while Live Cattle was unchanged on the week.
On the downside, Sugar fell by -0.76%, while Cocoa was lower by -1.10% and wheat was down by -1.29%. Cotton dropped by over two percent with a -2.30% decline, while Soybean Meal fell by -3.76%. Coffee was the biggest decliner on the week with a sharp drop of -10.05%.
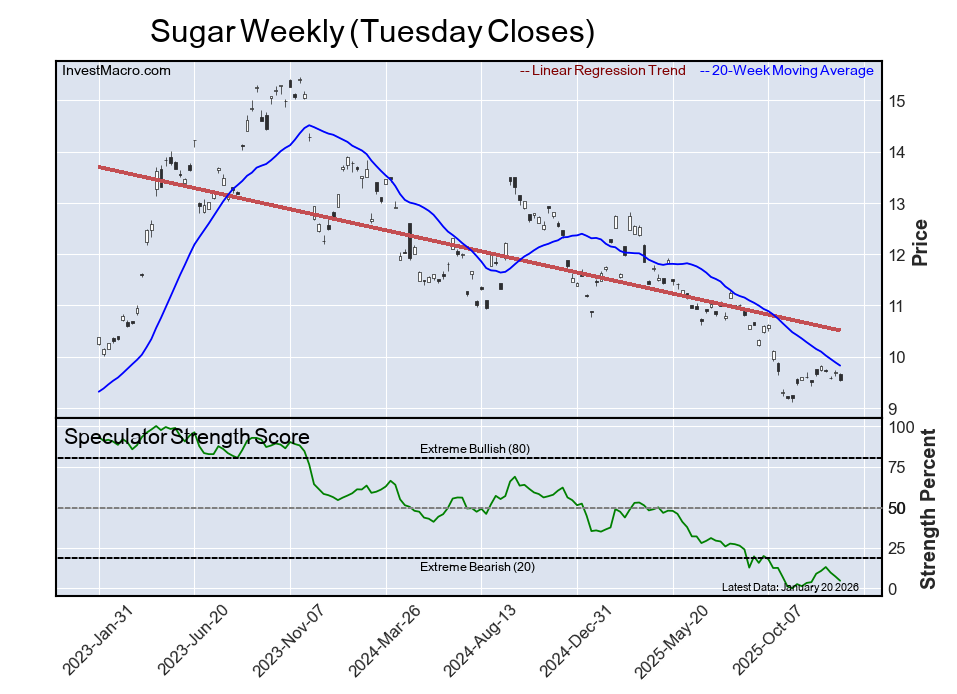
Sugar Speculator Bets hit all-time low
Highlighting the soft commodities changes this week was an all-time record low hit in the Sugar speculator positions. The large speculator bets for Sugar fell for the fifth consecutive week, and have now fallen by over -72,000 contracts in just these past five weeks. This week’s decline by over -42,000 contracts marked the largest shortfall in spec bets since September, a span of 21 weeks.
Sugar bets for speculators were positive as recently as May of last year, but turned negative on June 3rd, and have now been in an overall bearish position for 36 consecutive weeks. The speculator bets have pushed their bearish positions greater than -100,000 net contracts for 22 consecutive weeks. This weak sentiment culminated in an all-time record low standing for speculators at a total position of -210,289 contracts through Tuesday.
The Sugar price in the futures market has been on a deep, strong downtrend and has fallen approximately 34% in the past 52 weeks. The Sugar price had been on a strong uptrend starting from April of 2020 all the way through November of 2023, where prices rose by over 200%. Since that 2022 high, however, prices have gone the other way and have declined by over 50% and are currently hovering near five-year lows.
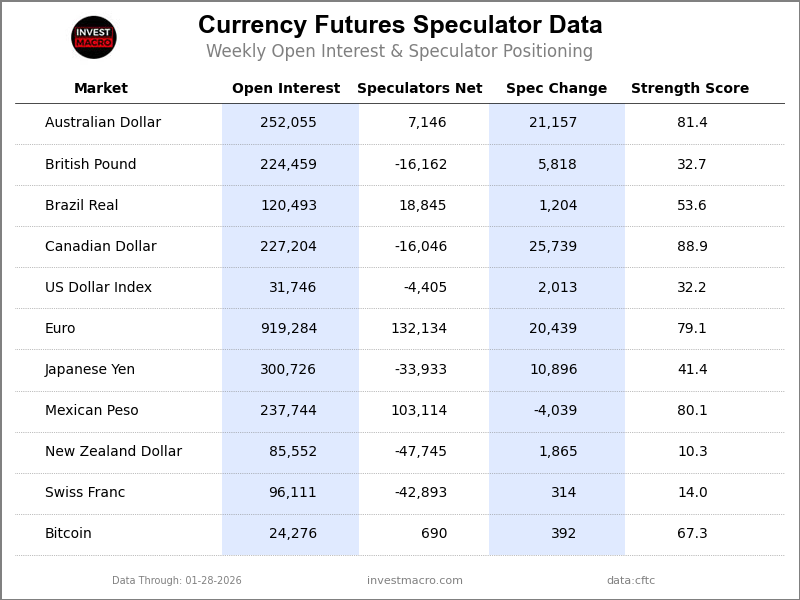
Soft Commodities Data:
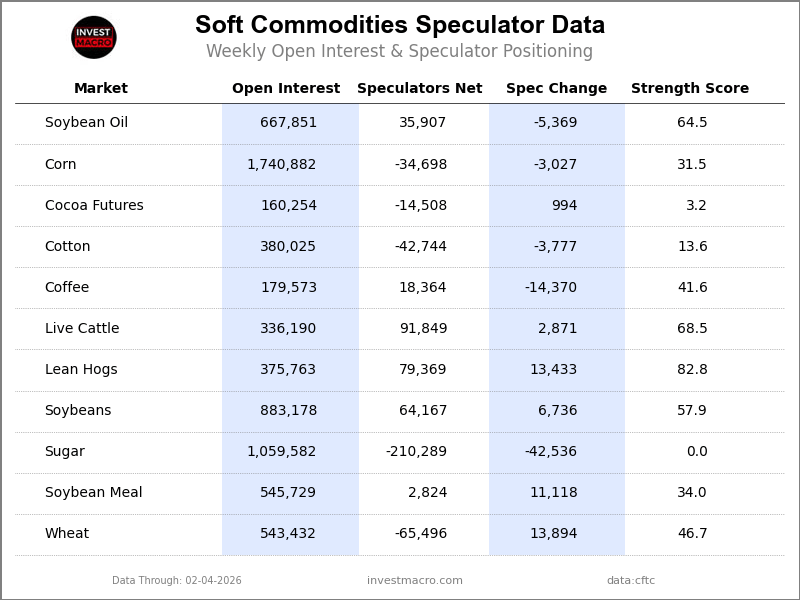
Legend: Weekly Speculators Change | Speculators Current Net Position | Speculators Strength Score compared to last 3-Years (0-100 range)
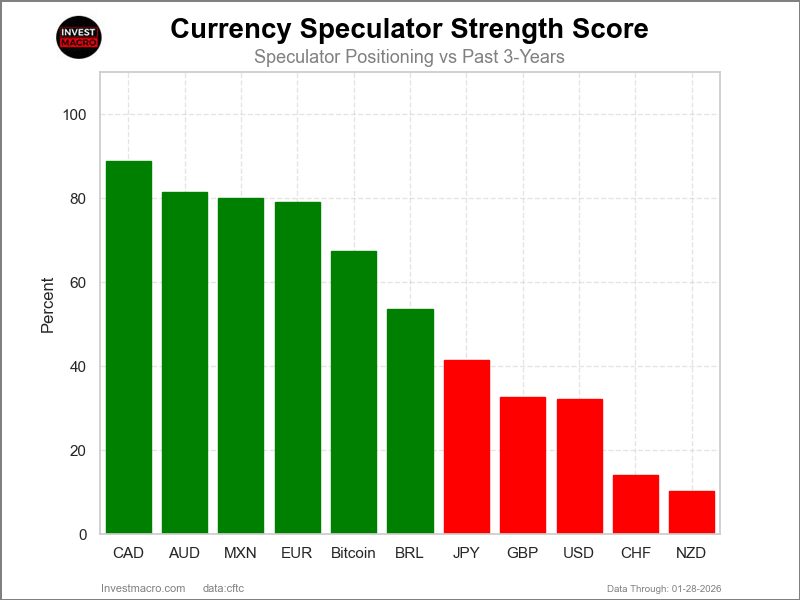
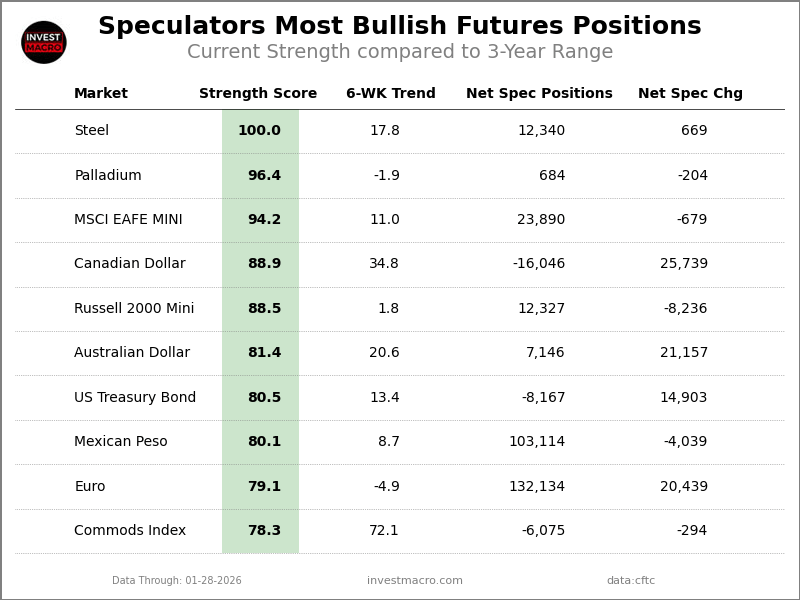
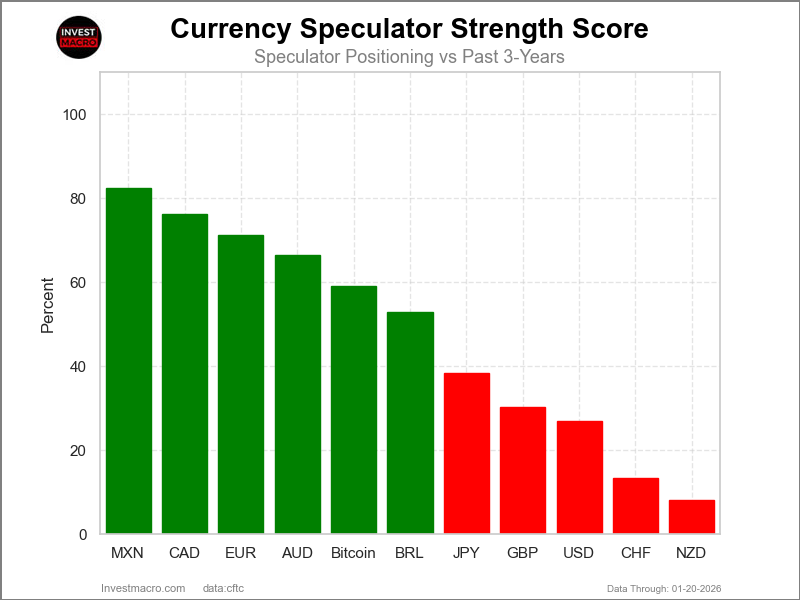
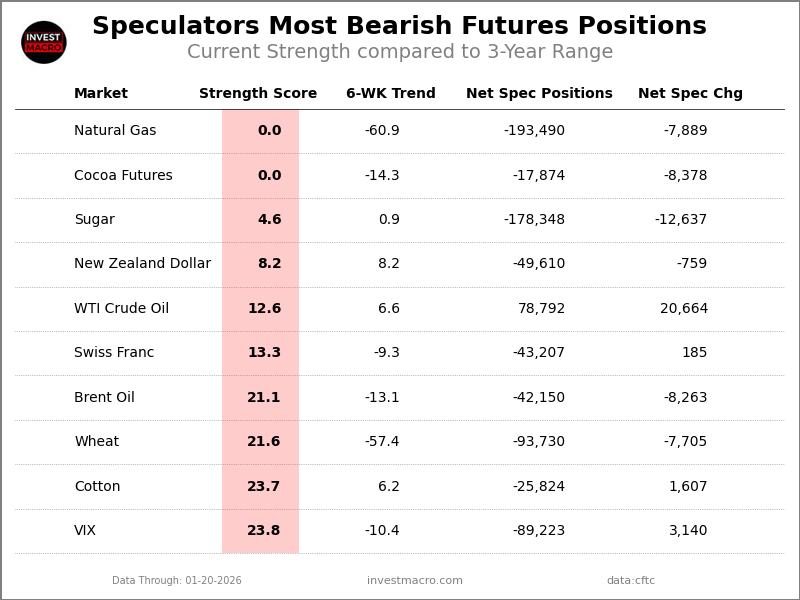
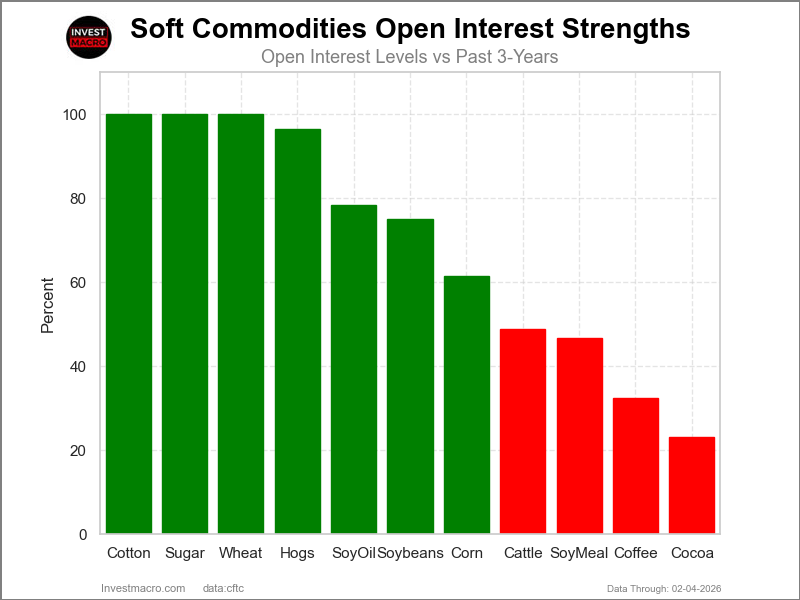
Strength Scores led by Lean Hogs & Live Cattle
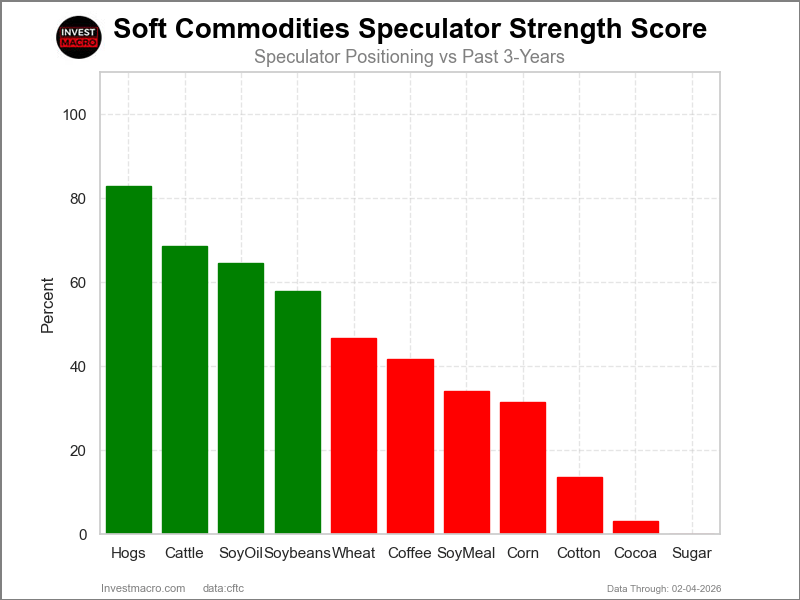
COT Strength Scores (a normalized measure of Speculator positions over a 3-Year range, from 0 to 100 where above 80 is Extreme-Bullish and below 20 is Extreme-Bearish) showed that Lean Hogs (83 percent) and Live Cattle (68 percent) lead the softs markets this week. Soybean Oil (65 percent) and Soybeans (58 percent) come in as the next highest in the weekly strength scores.
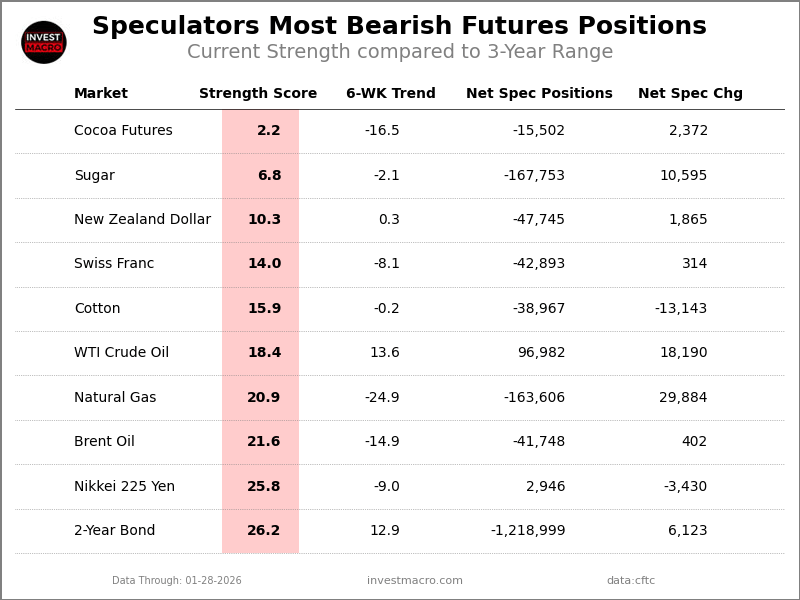
On the downside, Sugar (0 percent), Cocoa (3 percent) and Cotton (14 percent) come in at the lowest strength levels currently and are in Extreme-Bearish territory (below 20 percent).
Strength Statistics:
Corn (31.5 percent) vs Corn previous week (31.9 percent)
Sugar (0.0 percent) vs Sugar previous week (8.7 percent)
Coffee (41.6 percent) vs Coffee previous week (56.0 percent)
Soybeans (57.9 percent) vs Soybeans previous week (56.4 percent)
Soybean Oil (64.5 percent) vs Soybean Oil previous week (67.7 percent)
Soybean Meal (34.0 percent) vs Soybean Meal previous week (29.8 percent)
Live Cattle (68.5 percent) vs Live Cattle previous week (65.6 percent)
Lean Hogs (82.8 percent) vs Lean Hogs previous week (73.2 percent)
Cotton (13.6 percent) vs Cotton previous week (15.9 percent)
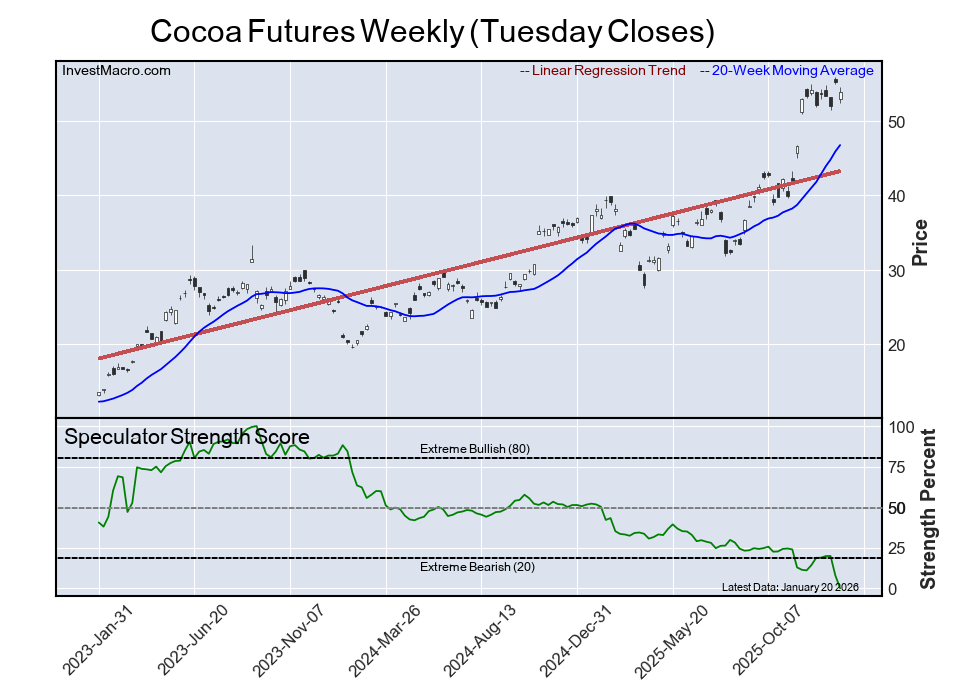
Cocoa (3.2 percent) vs Cocoa previous week (2.2 percent)
Wheat (46.7 percent) vs Wheat previous week (34.4 percent)
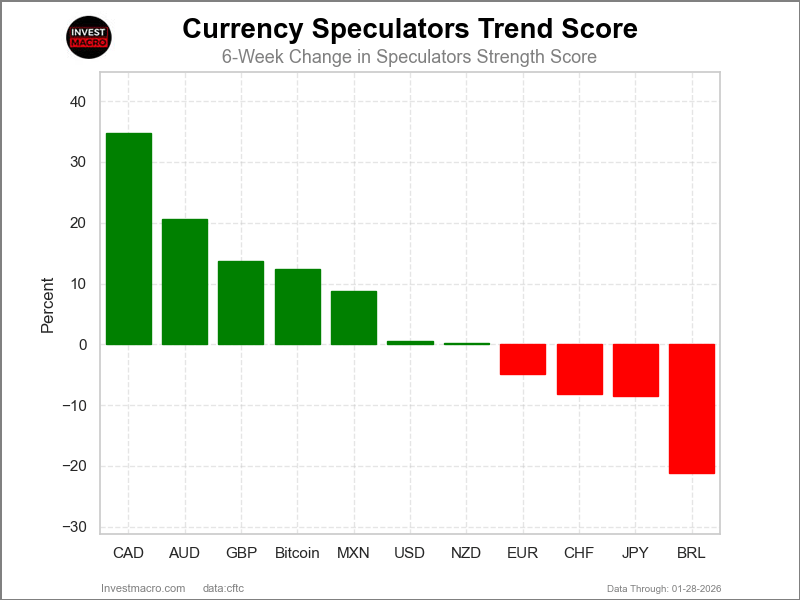
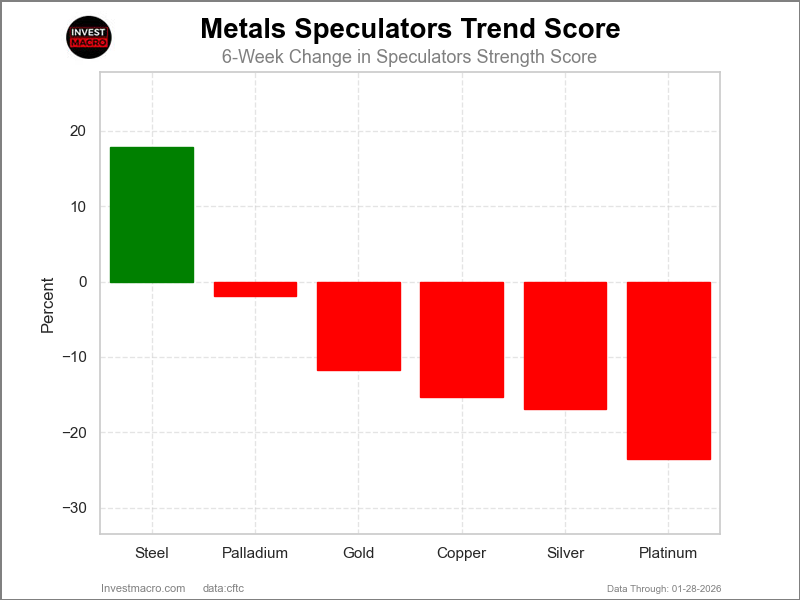
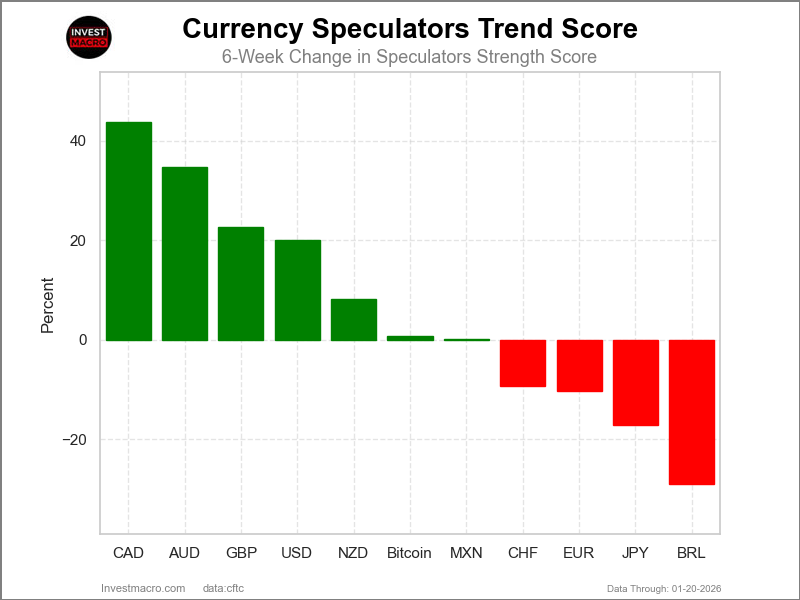
Soybean Oil & Lean Hogs top the 6-Week Strength Trends
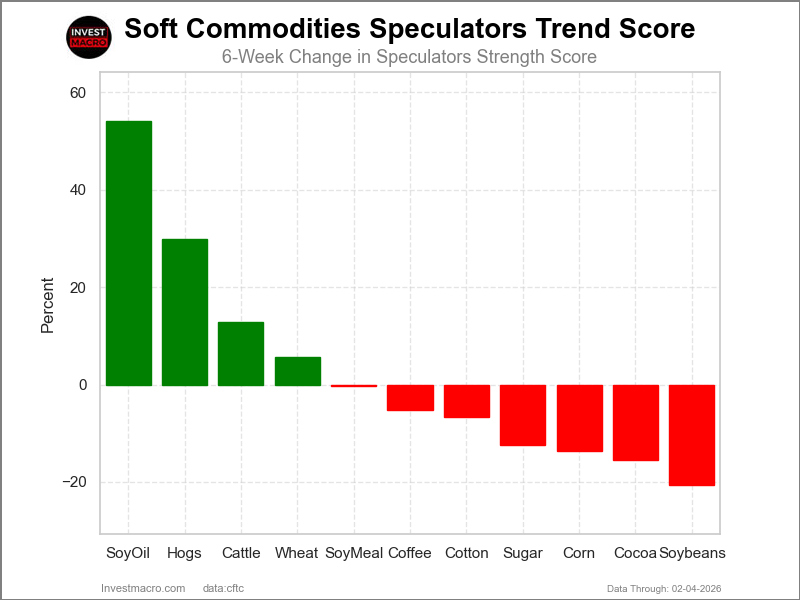
COT Strength Score Trends (or move index, calculates the 6-week changes in strength scores) showed that Soybean Oil (54 percent) and Lean Hogs (30 percent) lead the past six weeks trends for soft commodities. Live Cattle (13 percent) and Wheat (6 percent) are the next highest positive movers in the latest trends data.
Soybeans (-21 percent) leads the downside trend scores currently with Cocoa (-16 percent), Corn (-14 percent) and Sugar (-12 percent) following next with lower trend scores.
Strength Trend Statistics:
Corn (-13.6 percent) vs Corn previous week (-6.3 percent)
Sugar (-12.4 percent) vs Sugar previous week (-2.1 percent)
Coffee (-5.3 percent) vs Coffee previous week (2.8 percent)
Soybeans (-20.7 percent) vs Soybeans previous week (-30.0 percent)
Soybean Oil (54.2 percent) vs Soybean Oil previous week (42.7 percent)
Soybean Meal (-0.3 percent) vs Soybean Meal previous week (-8.5 percent)
Live Cattle (12.9 percent) vs Live Cattle previous week (12.9 percent)
Lean Hogs (29.9 percent) vs Lean Hogs previous week (24.1 percent)
Cotton (-6.6 percent) vs Cotton previous week (-0.2 percent)
Cocoa (-15.6 percent) vs Cocoa previous week (-16.5 percent)
Wheat (5.6 percent) vs Wheat previous week (-25.9 percent)
Individual Soft Commodities Markets:
CORN Futures:
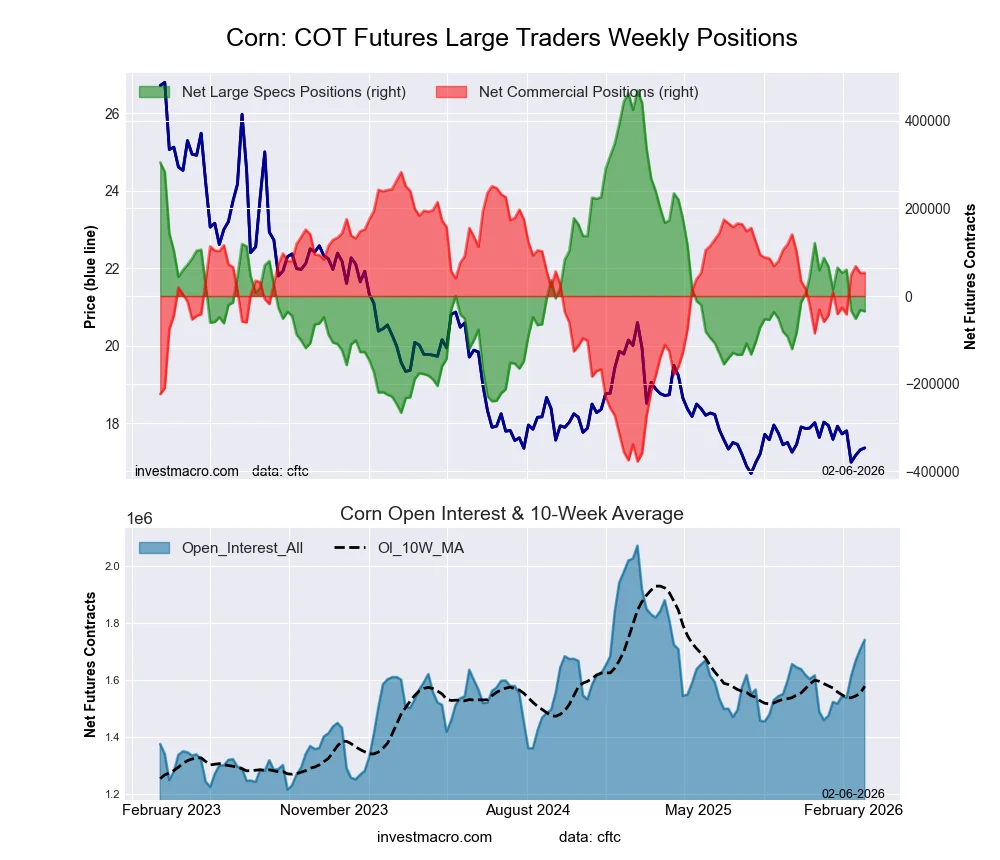 The CORN large speculator standing this week recorded a net position of -34,698 contracts in the data reported through Tuesday. This was a weekly lowering of -3,027 contracts from the previous week which had a total of -31,671 net contracts.
This week’s current strength score (the trader positioning range over the past three years, measured from 0 to 100) shows the speculators are currently Bearish with a score of 31.5 percent. The commercials are Bullish with a score of 65.2 percent and the small traders (not shown in chart) are Bullish-Extreme with a score of 85.4 percent.
Price Trend-Following Model: Strong Downtrend
Our weekly trend-following model classifies the current market price position as: Strong Downtrend.
| CORN Futures Statistics | SPECULATORS | COMMERCIALS | SMALL TRADERS |
| – Percent of Open Interest Longs: | 19.8 | 44.7 | 8.2 |
| – Percent of Open Interest Shorts: | 21.8 | 41.6 | 9.2 |
| – Net Position: | -34,698 | 52,916 | -18,218 |
| – Gross Longs: | 344,781 | 777,607 | 142,658 |
| – Gross Shorts: | 379,479 | 724,691 | 160,876 |
| – Long to Short Ratio: | 0.9 to 1 | 1.1 to 1 | 0.9 to 1 |
| NET POSITION TREND: | |||
| – Strength Index Score (3 Year Range Pct): | 31.5 | 65.2 | 85.4 |
| – Strength Index Reading (3 Year Range): | Bearish | Bullish | Bullish-Extreme |
| NET POSITION MOVEMENT INDEX: | |||
| – 6-Week Change in Strength Index: | -13.6 | 14.2 | 6.6 |
SUGAR Futures:
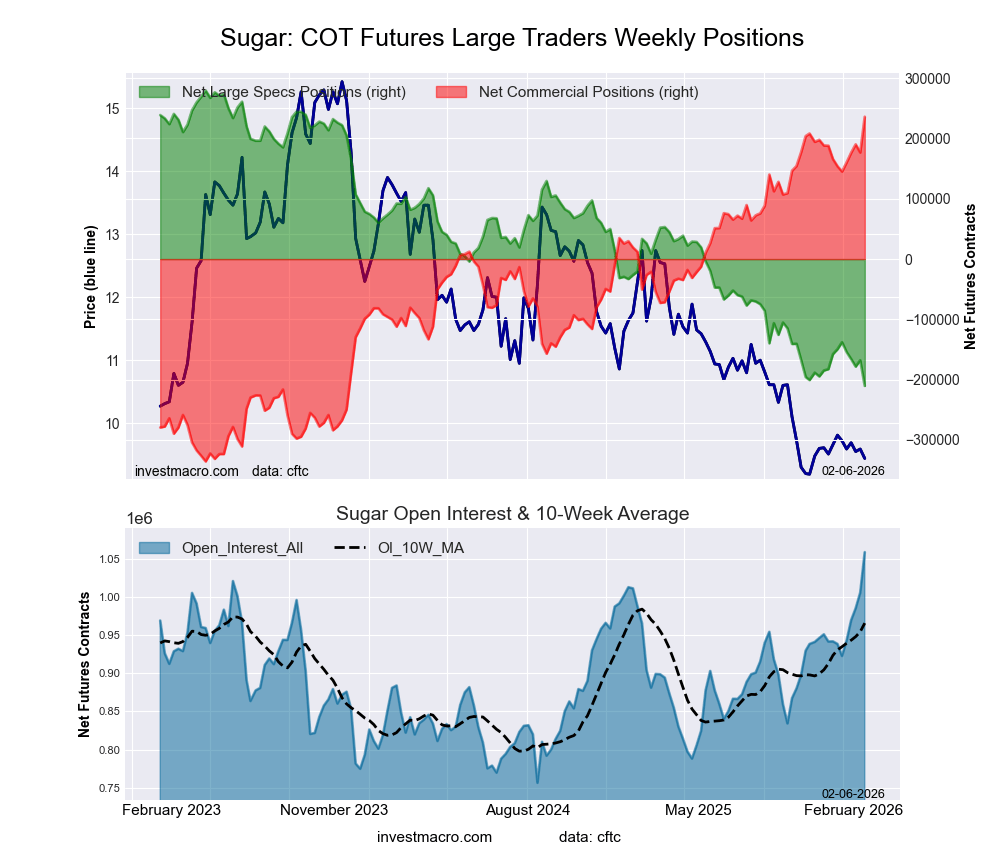 The SUGAR large speculator standing this week recorded a net position of -210,289 contracts in the data reported through Tuesday. This was a weekly lowering of -42,536 contracts from the previous week which had a total of -167,753 net contracts.
This week’s current strength score (the trader positioning range over the past three years, measured from 0 to 100) shows the speculators are currently Bearish-Extreme with a score of 0.0 percent. The commercials are Bullish-Extreme with a score of 100.0 percent and the small traders (not shown in chart) are Bearish-Extreme with a score of 0.0 percent.
Price Trend-Following Model: Strong Downtrend
Our weekly trend-following model classifies the current market price position as: Strong Downtrend.
| SUGAR Futures Statistics | SPECULATORS | COMMERCIALS | SMALL TRADERS |
| – Percent of Open Interest Longs: | 14.6 | 57.2 | 7.4 |
| – Percent of Open Interest Shorts: | 34.4 | 35.0 | 9.9 |
| – Net Position: | -210,289 | 236,034 | -25,745 |
| – Gross Longs: | 154,357 | 606,374 | 78,697 |
| – Gross Shorts: | 364,646 | 370,340 | 104,442 |
| – Long to Short Ratio: | 0.4 to 1 | 1.6 to 1 | 0.8 to 1 |
| NET POSITION TREND: | |||
| – Strength Index Score (3 Year Range Pct): | 0.0 | 100.0 | 0.0 |
| – Strength Index Reading (3 Year Range): | Bearish-Extreme | Bullish-Extreme | Bearish-Extreme |
| NET POSITION MOVEMENT INDEX: | |||
| – 6-Week Change in Strength Index: | -12.4 | 14.4 | -25.6 |
COFFEE Futures:
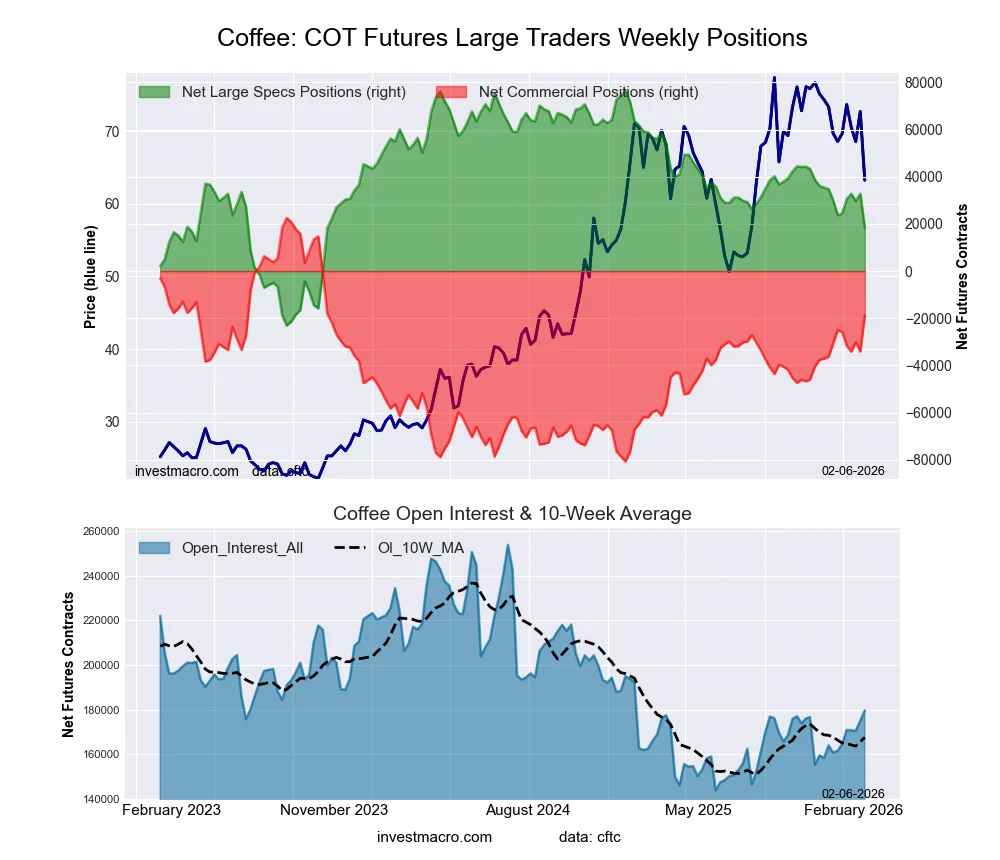 The COFFEE large speculator standing this week recorded a net position of 18,364 contracts in the data reported through Tuesday. This was a weekly lowering of -14,370 contracts from the previous week which had a total of 32,734 net contracts.
This week’s current strength score (the trader positioning range over the past three years, measured from 0 to 100) shows the speculators are currently Bearish with a score of 41.6 percent. The commercials are Bullish with a score of 60.0 percent and the small traders (not shown in chart) are Bearish with a score of 25.7 percent.
Price Trend-Following Model: Strong Downtrend
Our weekly trend-following model classifies the current market price position as: Strong Downtrend.
| COFFEE Futures Statistics | SPECULATORS | COMMERCIALS | SMALL TRADERS |
| – Percent of Open Interest Longs: | 27.5 | 44.2 | 4.9 |
| – Percent of Open Interest Shorts: | 17.3 | 54.7 | 4.6 |
| – Net Position: | 18,364 | -18,837 | 473 |
| – Gross Longs: | 49,342 | 79,405 | 8,768 |
| – Gross Shorts: | 30,978 | 98,242 | 8,295 |
| – Long to Short Ratio: | 1.6 to 1 | 0.8 to 1 | 1.1 to 1 |
| NET POSITION TREND: | |||
| – Strength Index Score (3 Year Range Pct): | 41.6 | 60.0 | 25.7 |
| – Strength Index Reading (3 Year Range): | Bearish | Bullish | Bearish |
| NET POSITION MOVEMENT INDEX: | |||
| – 6-Week Change in Strength Index: | -5.3 | 6.0 | -14.5 |
SOYBEANS Futures:
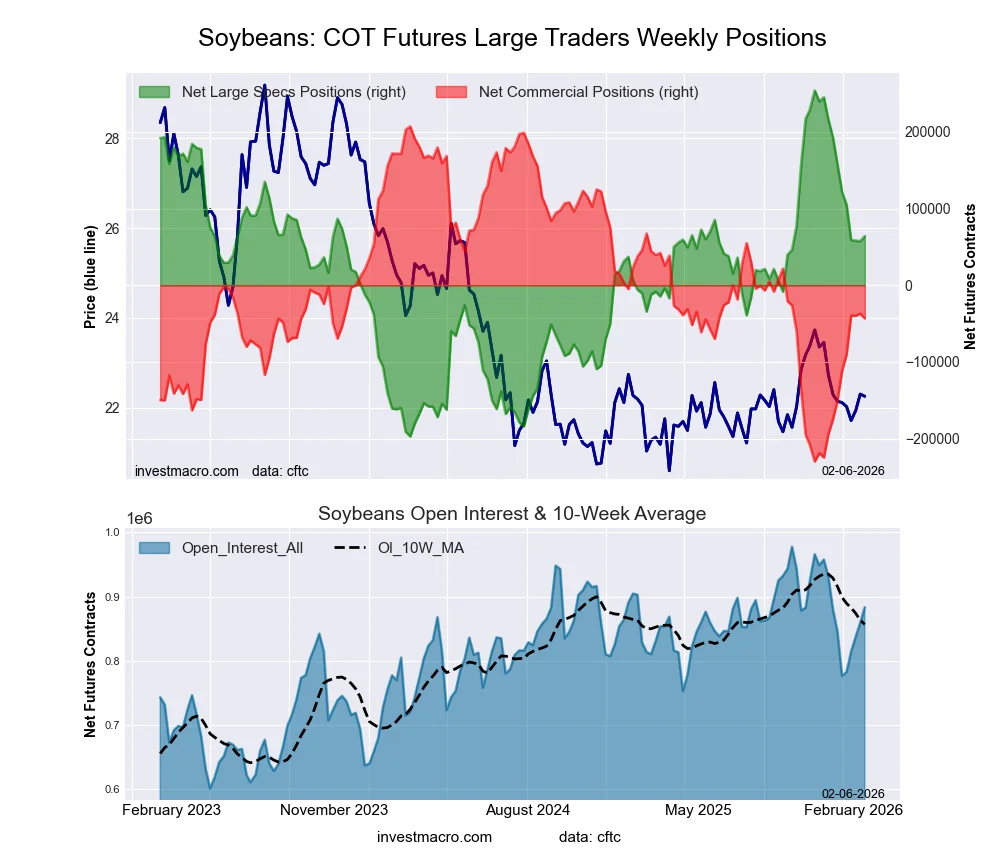 The SOYBEANS large speculator standing this week recorded a net position of 64,167 contracts in the data reported through Tuesday. This was a weekly advance of 6,736 contracts from the previous week which had a total of 57,431 net contracts.
This week’s current strength score (the trader positioning range over the past three years, measured from 0 to 100) shows the speculators are currently Bullish with a score of 57.9 percent. The commercials are Bearish with a score of 42.7 percent and the small traders (not shown in chart) are Bullish with a score of 57.9 percent.
Price Trend-Following Model: Strong Uptrend
Our weekly trend-following model classifies the current market price position as: Strong Uptrend.
| SOYBEANS Futures Statistics | SPECULATORS | COMMERCIALS | SMALL TRADERS |
| – Percent of Open Interest Longs: | 20.2 | 51.4 | 5.8 |
| – Percent of Open Interest Shorts: | 12.9 | 56.3 | 8.2 |
| – Net Position: | 64,167 | -43,272 | -20,895 |
| – Gross Longs: | 177,970 | 454,017 | 51,496 |
| – Gross Shorts: | 113,803 | 497,289 | 72,391 |
| – Long to Short Ratio: | 1.6 to 1 | 0.9 to 1 | 0.7 to 1 |
| NET POSITION TREND: | |||
| – Strength Index Score (3 Year Range Pct): | 57.9 | 42.7 | 57.9 |
| – Strength Index Reading (3 Year Range): | Bullish | Bearish | Bullish |
| NET POSITION MOVEMENT INDEX: | |||
| – 6-Week Change in Strength Index: | -20.7 | 24.5 | -35.0 |
SOYBEAN OIL Futures:
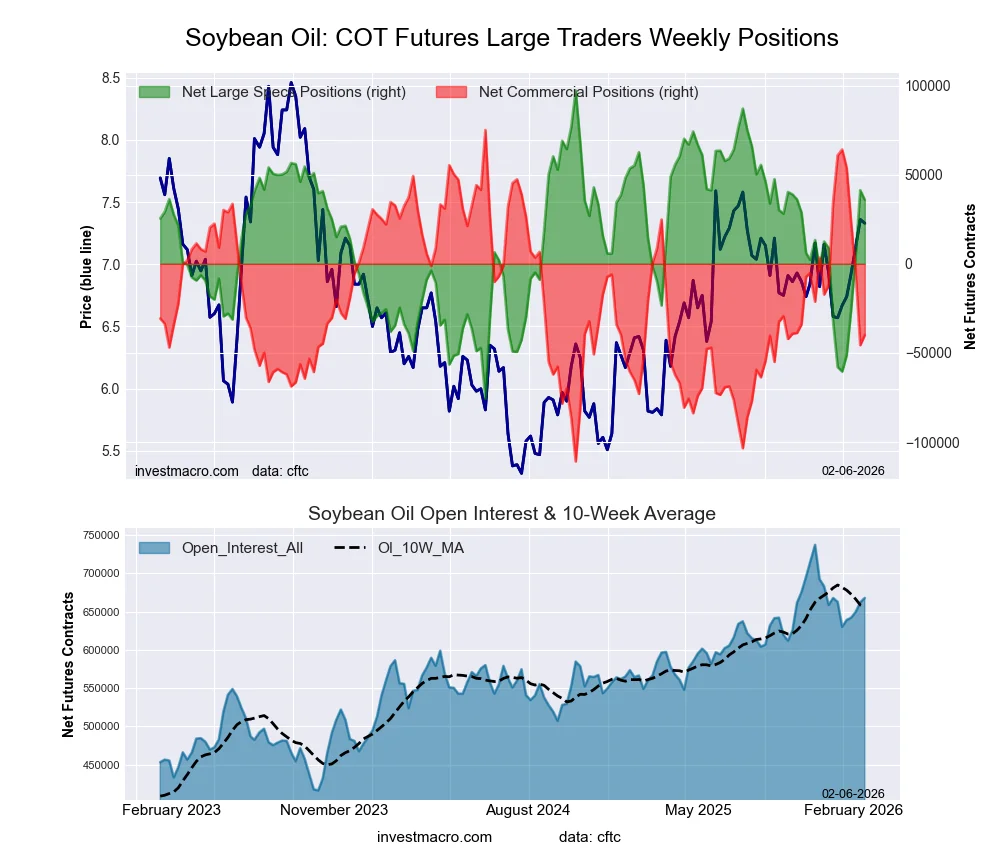 The SOYBEAN OIL large speculator standing this week recorded a net position of 35,907 contracts in the data reported through Tuesday. This was a weekly lowering of -5,369 contracts from the previous week which had a total of 41,276 net contracts.
This week’s current strength score (the trader positioning range over the past three years, measured from 0 to 100) shows the speculators are currently Bullish with a score of 64.5 percent. The commercials are Bearish with a score of 38.1 percent and the small traders (not shown in chart) are Bearish with a score of 38.5 percent.
Price Trend-Following Model: Strong Uptrend
Our weekly trend-following model classifies the current market price position as: Strong Uptrend.
| SOYBEAN OIL Futures Statistics | SPECULATORS | COMMERCIALS | SMALL TRADERS |
| – Percent of Open Interest Longs: | 20.8 | 47.6 | 4.9 |
| – Percent of Open Interest Shorts: | 15.4 | 53.5 | 4.3 |
| – Net Position: | 35,907 | -39,953 | 4,046 |
| – Gross Longs: | 138,652 | 317,654 | 32,766 |
| – Gross Shorts: | 102,745 | 357,607 | 28,720 |
| – Long to Short Ratio: | 1.3 to 1 | 0.9 to 1 | 1.1 to 1 |
| NET POSITION TREND: | |||
| – Strength Index Score (3 Year Range Pct): | 64.5 | 38.1 | 38.5 |
| – Strength Index Reading (3 Year Range): | Bullish | Bearish | Bearish |
| NET POSITION MOVEMENT INDEX: | |||
| – 6-Week Change in Strength Index: | 54.2 | -54.2 | 35.0 |
SOYBEAN MEAL Futures:
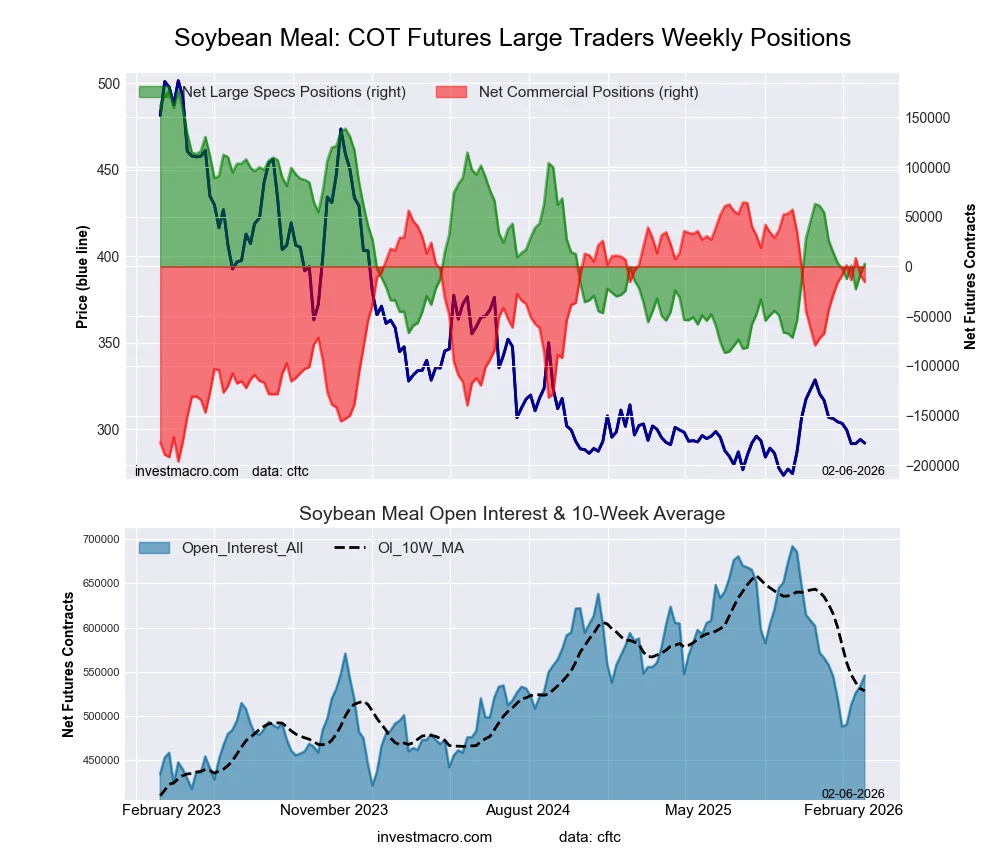 The SOYBEAN MEAL large speculator standing this week recorded a net position of 2,824 contracts in the data reported through Tuesday. This was a weekly boost of 11,118 contracts from the previous week which had a total of -8,294 net contracts.
This week’s current strength score (the trader positioning range over the past three years, measured from 0 to 100) shows the speculators are currently Bearish with a score of 34.0 percent. The commercials are Bullish with a score of 69.3 percent and the small traders (not shown in chart) are Bearish-Extreme with a score of 16.1 percent.
Price Trend-Following Model: Weak Uptrend
Our weekly trend-following model classifies the current market price position as: Weak Uptrend.
| SOYBEAN MEAL Futures Statistics | SPECULATORS | COMMERCIALS | SMALL TRADERS |
| – Percent of Open Interest Longs: | 20.8 | 52.2 | 8.3 |
| – Percent of Open Interest Shorts: | 20.2 | 55.0 | 6.0 |
| – Net Position: | 2,824 | -15,616 | 12,792 |
| – Gross Longs: | 113,333 | 284,653 | 45,555 |
| – Gross Shorts: | 110,509 | 300,269 | 32,763 |
| – Long to Short Ratio: | 1.0 to 1 | 0.9 to 1 | 1.4 to 1 |
| NET POSITION TREND: | |||
| – Strength Index Score (3 Year Range Pct): | 34.0 | 69.3 | 16.1 |
| – Strength Index Reading (3 Year Range): | Bearish | Bullish | Bearish-Extreme |
| NET POSITION MOVEMENT INDEX: | |||
| – 6-Week Change in Strength Index: | -0.3 | 0.1 | 2.1 |
LIVE CATTLE Futures:
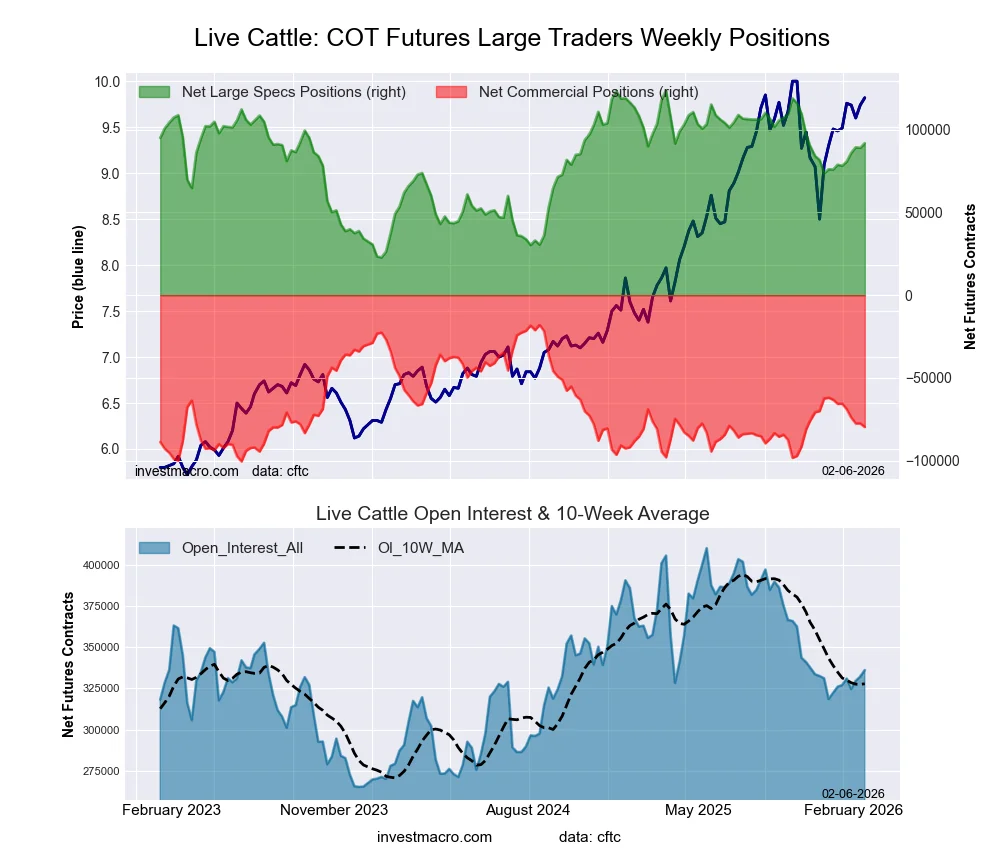 The LIVE CATTLE large speculator standing this week recorded a net position of 91,849 contracts in the data reported through Tuesday. This was a weekly lift of 2,871 contracts from the previous week which had a total of 88,978 net contracts.
This week’s current strength score (the trader positioning range over the past three years, measured from 0 to 100) shows the speculators are currently Bullish with a score of 68.5 percent. The commercials are Bearish with a score of 25.2 percent and the small traders (not shown in chart) are Bullish with a score of 55.5 percent.
Price Trend-Following Model: Strong Uptrend
Our weekly trend-following model classifies the current market price position as: Strong Uptrend.
| LIVE CATTLE Futures Statistics | SPECULATORS | COMMERCIALS | SMALL TRADERS |
| – Percent of Open Interest Longs: | 45.1 | 32.2 | 8.3 |
| – Percent of Open Interest Shorts: | 17.8 | 55.9 | 11.9 |
| – Net Position: | 91,849 | -79,657 | -12,192 |
| – Gross Longs: | 151,701 | 108,319 | 27,757 |
| – Gross Shorts: | 59,852 | 187,976 | 39,949 |
| – Long to Short Ratio: | 2.5 to 1 | 0.6 to 1 | 0.7 to 1 |
| NET POSITION TREND: | |||
| – Strength Index Score (3 Year Range Pct): | 68.5 | 25.2 | 55.5 |
| – Strength Index Reading (3 Year Range): | Bullish | Bearish | Bullish |
| NET POSITION MOVEMENT INDEX: | |||
| – 6-Week Change in Strength Index: | 12.9 | -17.0 | 3.3 |
LEAN HOGS Futures:
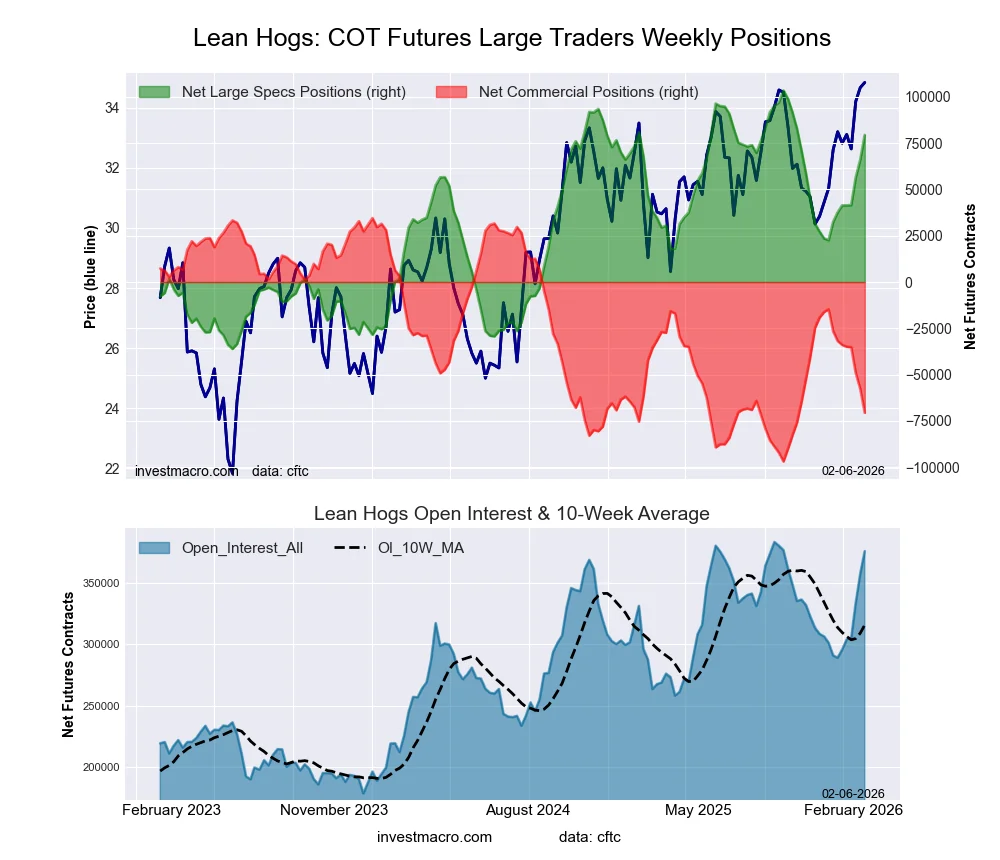 The LEAN HOGS large speculator standing this week recorded a net position of 79,369 contracts in the data reported through Tuesday. This was a weekly advance of 13,433 contracts from the previous week which had a total of 65,936 net contracts.
This week’s current strength score (the trader positioning range over the past three years, measured from 0 to 100) shows the speculators are currently Bullish-Extreme with a score of 82.8 percent. The commercials are Bearish with a score of 20.0 percent and the small traders (not shown in chart) are Bearish with a score of 24.5 percent.
Price Trend-Following Model: Strong Uptrend
Our weekly trend-following model classifies the current market price position as: Strong Uptrend.
| LEAN HOGS Futures Statistics | SPECULATORS | COMMERCIALS | SMALL TRADERS |
| – Percent of Open Interest Longs: | 43.1 | 30.2 | 6.2 |
| – Percent of Open Interest Shorts: | 21.9 | 49.0 | 8.6 |
| – Net Position: | 79,369 | -70,574 | -8,795 |
| – Gross Longs: | 161,832 | 113,508 | 23,472 |
| – Gross Shorts: | 82,463 | 184,082 | 32,267 |
| – Long to Short Ratio: | 2.0 to 1 | 0.6 to 1 | 0.7 to 1 |
| NET POSITION TREND: | |||
| – Strength Index Score (3 Year Range Pct): | 82.8 | 20.0 | 24.5 |
| – Strength Index Reading (3 Year Range): | Bullish-Extreme | Bearish | Bearish |
| NET POSITION MOVEMENT INDEX: | |||
| – 6-Week Change in Strength Index: | 29.9 | -29.5 | -18.2 |
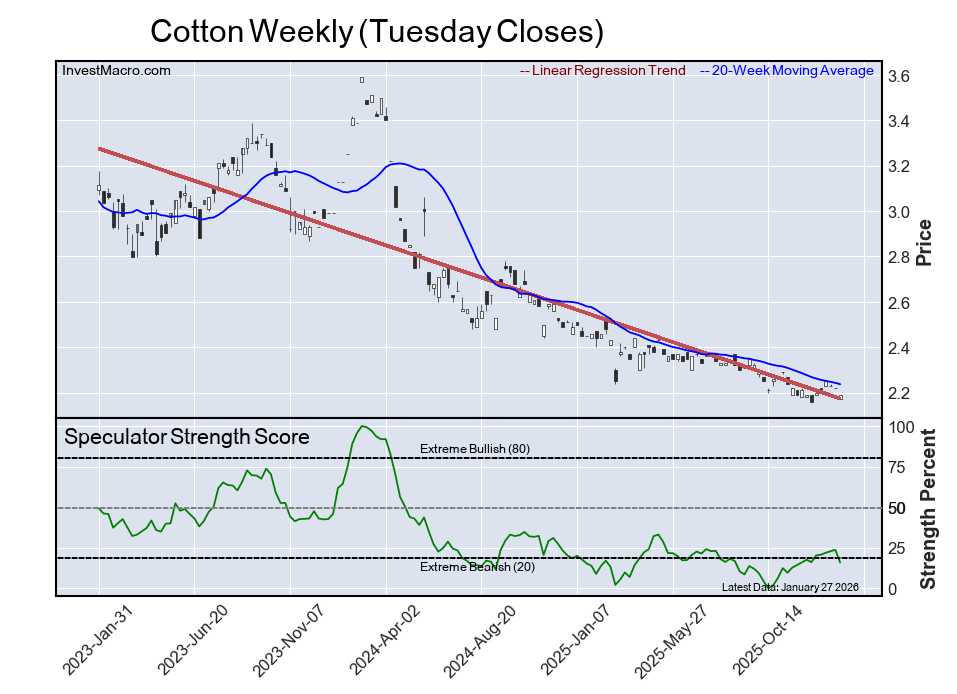
COTTON Futures:
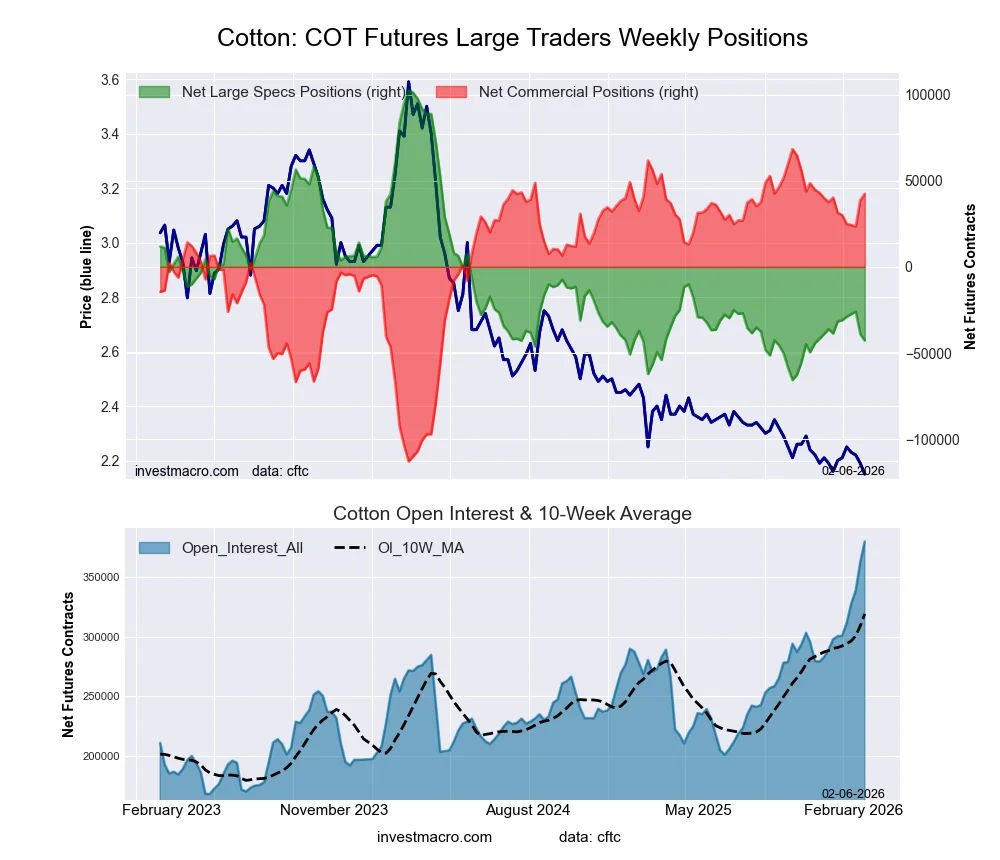 The COTTON large speculator standing this week recorded a net position of -42,744 contracts in the data reported through Tuesday. This was a weekly decline of -3,777 contracts from the previous week which had a total of -38,967 net contracts.
This week’s current strength score (the trader positioning range over the past three years, measured from 0 to 100) shows the speculators are currently Bearish-Extreme with a score of 13.6 percent. The commercials are Bullish-Extreme with a score of 85.7 percent and the small traders (not shown in chart) are Bearish with a score of 25.0 percent.
Price Trend-Following Model: Strong Downtrend
Our weekly trend-following model classifies the current market price position as: Strong Downtrend.
| COTTON Futures Statistics | SPECULATORS | COMMERCIALS | SMALL TRADERS |
| – Percent of Open Interest Longs: | 26.8 | 49.1 | 3.8 |
| – Percent of Open Interest Shorts: | 38.0 | 38.0 | 3.7 |
| – Net Position: | -42,744 | 42,398 | 346 |
| – Gross Longs: | 101,788 | 186,654 | 14,382 |
| – Gross Shorts: | 144,532 | 144,256 | 14,036 |
| – Long to Short Ratio: | 0.7 to 1 | 1.3 to 1 | 1.0 to 1 |
| NET POSITION TREND: | |||
| – Strength Index Score (3 Year Range Pct): | 13.6 | 85.7 | 25.0 |
| – Strength Index Reading (3 Year Range): | Bearish-Extreme | Bullish-Extreme | Bearish |
| NET POSITION MOVEMENT INDEX: | |||
| – 6-Week Change in Strength Index: | -6.6 | 6.1 | 0.5 |
COCOA Futures:
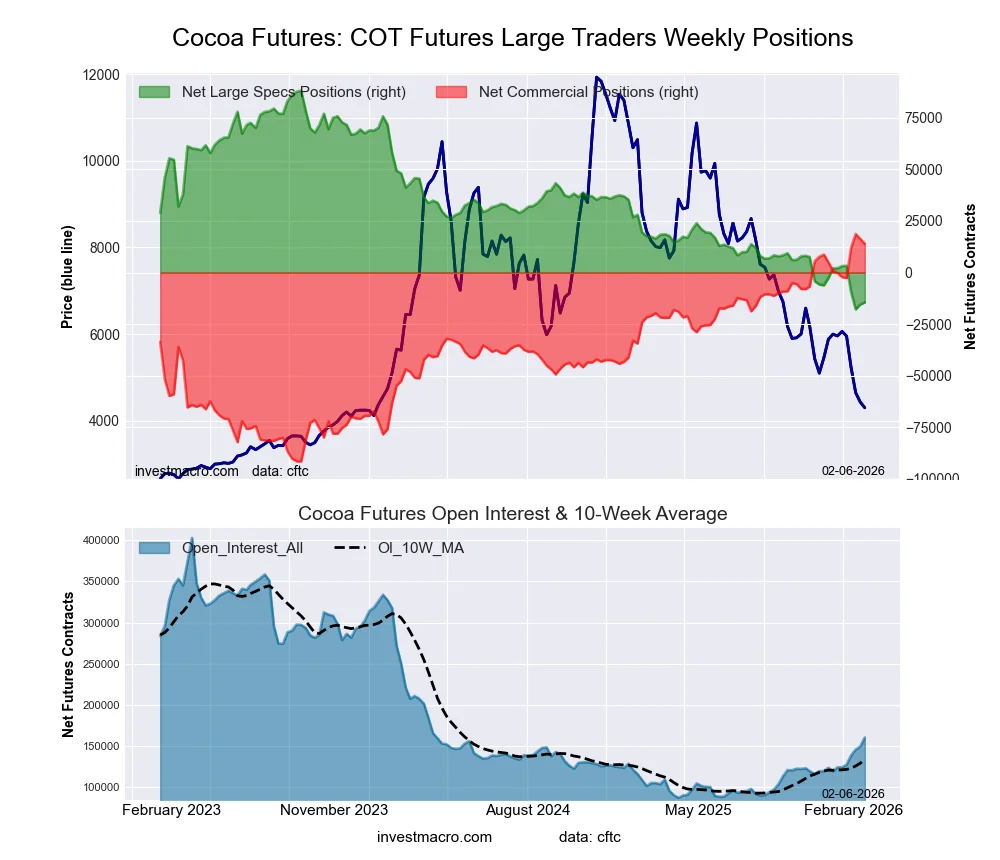 The COCOA large speculator standing this week recorded a net position of -14,508 contracts in the data reported through Tuesday. This was a weekly boost of 994 contracts from the previous week which had a total of -15,502 net contracts.
This week’s current strength score (the trader positioning range over the past three years, measured from 0 to 100) shows the speculators are currently Bearish-Extreme with a score of 3.2 percent. The commercials are Bullish-Extreme with a score of 95.7 percent and the small traders (not shown in chart) are Bearish with a score of 32.4 percent.
Price Trend-Following Model: Strong Downtrend
Our weekly trend-following model classifies the current market price position as: Strong Downtrend.
| COCOA Futures Statistics | SPECULATORS | COMMERCIALS | SMALL TRADERS |
| – Percent of Open Interest Longs: | 19.4 | 47.7 | 6.3 |
| – Percent of Open Interest Shorts: | 28.4 | 39.0 | 6.0 |
| – Net Position: | -14,508 | 13,961 | 547 |
| – Gross Longs: | 31,042 | 76,466 | 10,089 |
| – Gross Shorts: | 45,550 | 62,505 | 9,542 |
| – Long to Short Ratio: | 0.7 to 1 | 1.2 to 1 | 1.1 to 1 |
| NET POSITION TREND: | |||
| – Strength Index Score (3 Year Range Pct): | 3.2 | 95.7 | 32.4 |
| – Strength Index Reading (3 Year Range): | Bearish-Extreme | Bullish-Extreme | Bearish |
| NET POSITION MOVEMENT INDEX: | |||
| – 6-Week Change in Strength Index: | -15.6 | 12.8 | 23.6 |
WHEAT Futures:
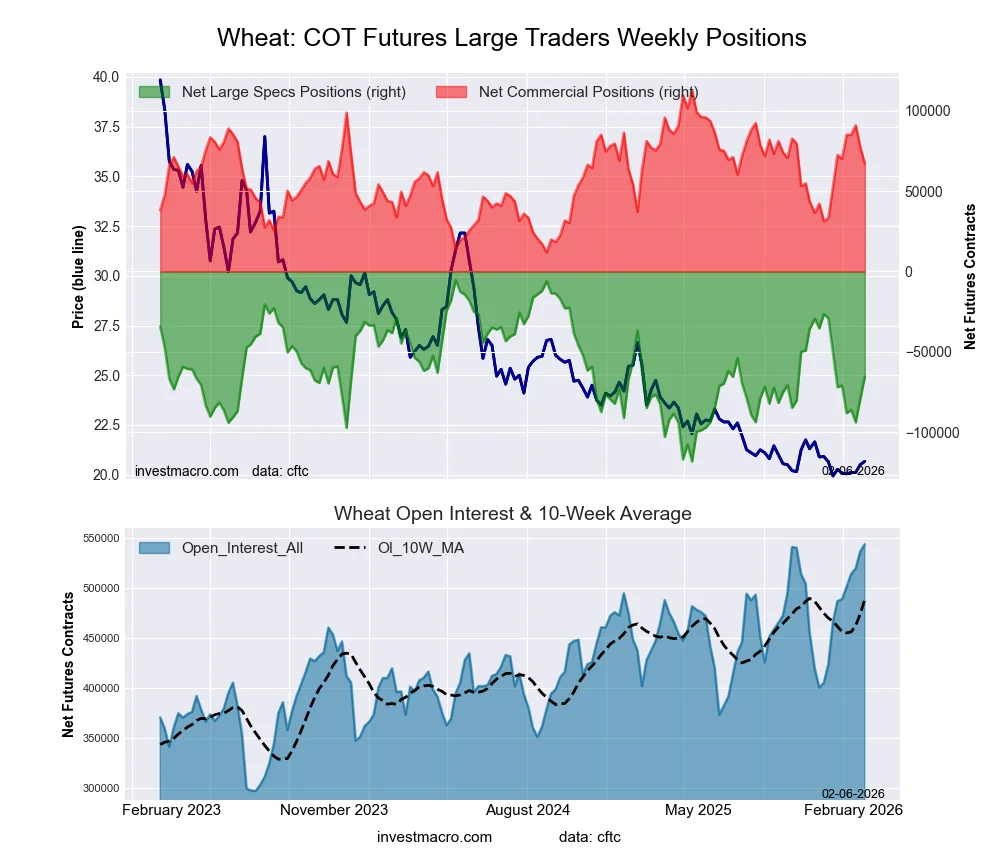 The WHEAT large speculator standing this week recorded a net position of -65,496 contracts in the data reported through Tuesday. This was a weekly advance of 13,894 contracts from the previous week which had a total of -79,390 net contracts.
This week’s current strength score (the trader positioning range over the past three years, measured from 0 to 100) shows the speculators are currently Bearish with a score of 46.7 percent. The commercials are Bullish with a score of 54.8 percent and the small traders (not shown in chart) are Bearish with a score of 44.9 percent.
Price Trend-Following Model: Weak Downtrend
Our weekly trend-following model classifies the current market price position as: Weak Downtrend.
| WHEAT Futures Statistics | SPECULATORS | COMMERCIALS | SMALL TRADERS |
| – Percent of Open Interest Longs: | 22.3 | 36.5 | 5.9 |
| – Percent of Open Interest Shorts: | 34.4 | 24.2 | 6.1 |
| – Net Position: | -65,496 | 67,064 | -1,568 |
| – Gross Longs: | 121,319 | 198,550 | 31,828 |
| – Gross Shorts: | 186,815 | 131,486 | 33,396 |
| – Long to Short Ratio: | 0.6 to 1 | 1.5 to 1 | 1.0 to 1 |
| NET POSITION TREND: | |||
| – Strength Index Score (3 Year Range Pct): | 46.7 | 54.8 | 44.9 |
| – Strength Index Reading (3 Year Range): | Bearish | Bullish | Bearish |
| NET POSITION MOVEMENT INDEX: | |||
| – 6-Week Change in Strength Index: | 5.6 | -5.3 | -5.9 |
Article By InvestMacro – Receive our weekly COT Newsletter
*COT Report: The COT data, released weekly to the public each Friday, is updated through the most recent Tuesday (data is 3 days old) and shows a quick view of how large speculators or non-commercials (for-profit traders) were positioned in the futures markets.
The CFTC categorizes trader positions according to commercial hedgers (traders who use futures contracts for hedging as part of the business), non-commercials (large traders who speculate to realize trading profits) and nonreportable traders (usually small traders/speculators) as well as their open interest (contracts open in the market at time of reporting). See CFTC criteria here.