
By InvestMacro
Here are the latest charts and statistics for the Commitment of Traders (COT) data published by the Commodities Futures Trading Commission (CFTC).
The latest COT data is updated through Tuesday January 13th and shows a quick view of how large traders (for-profit speculators and commercial entities) were positioned in the futures markets.
Weekly Speculator Changes led by Gold

The COT metals markets speculator bets were overall higher this week as four out of the six metals markets we cover had higher positioning while the other two markets had lower speculator contracts.
Leading the gains for the metals was Gold which had a strong gain by 23,606 contracts with Silver (2,789 contracts), Steel (1,545 contracts) and Palladium (646 contracts) also seeing positive weeks.
The markets with declines in speculator bets for the week were Copper (-4,417 contracts) and with Platinum (-516 contracts) also registering lower bets on the week.
Free Reports:
 Sign Up for Our Stock Market Newsletter – Get updated on News, Charts & Rankings of Public Companies when you join our Stocks Newsletter
 Get our Weekly Commitment of Traders Reports - See where the biggest traders (Hedge Funds and Commercial Hedgers) are positioned in the futures markets on a weekly basis.
Price Performance led by Silver and Steel
The metals markets saw Silver jump this week by approximately 12% over the past five days. Steel was also up strong by 5.77% over the past five days, while Gold rose by 1.65% and Platinum increased by 1.44%.
On the downside, Copper was lower by -0.64%, and Palladium saw the largest downside this week by -1.78%.
All the metals markets have been higher over the past 30 days and are also higher over the past 90 days. Silver has risen by over 100% in the past 90 days, while Platinum has gained by over 65% in the last 90 days.
Metals Data:

Legend: Weekly Speculators Change | Speculators Current Net Position | Speculators Strength Score compared to last 3-Years (0-100 range)
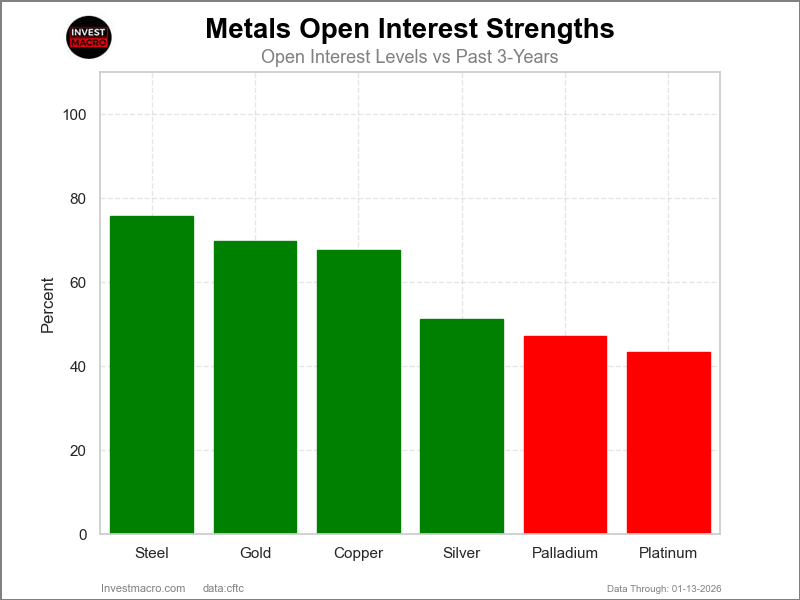
Strength Scores led by Palladium & Steel

COT Strength Scores (a normalized measure of Speculator positions over a 3-Year range, from 0 to 100 where above 80 is Extreme-Bullish and below 20 is Extreme-Bearish) showed that Palladium (100 percent) and Steel (100 percent) lead the metals markets this week. Copper (83 percent) comes in as the next highest in the weekly strength scores.
On the downside, Silver (53 percent) and Platinum (55 percent) come in at the lowest strength levels currently but remain above the 50 percent midpoint of the past 3-years.
Strength Statistics:
Gold (73.7 percent) vs Gold previous week (64.0 percent)
Silver (53.2 percent) vs Silver previous week (49.4 percent)
Copper (83.0 percent) vs Copper previous week (87.1 percent)
Platinum (55.0 percent) vs Platinum previous week (56.3 percent)
Palladium (100.0 percent) vs Palladium previous week (95.7 percent)
Steel (100.0 percent) vs Steel previous week (91.3 percent)
Steel & Gold top the 6-Week Strength Trends

COT Strength Score Trends (or move index, calculates the 6-week changes in strength scores) showed that Steel (28 percent) and Gold (14 percent) lead the past six weeks trends for metals. Palladium (9 percent) and Platinum (4 percent) are the next highest positive movers in the latest trends data.
Silver (-9 percent) leads the downside trend scores currently.
Move Statistics:
Gold (13.8 percent) vs Gold previous week (9.4 percent)
Silver (-8.6 percent) vs Silver previous week (-3.9 percent)
Copper (0.0 percent) vs Copper previous week (13.2 percent)
Platinum (4.0 percent) vs Platinum previous week (5.3 percent)
Palladium (9.4 percent) vs Palladium previous week (7.1 percent)
Steel (28.1 percent) vs Steel previous week (19.9 percent)
Individual Markets:
Gold Comex Futures:
 The Gold Comex Futures large speculator standing this week reached a net position of 251,238 contracts in the data reported through Tuesday. This was a weekly rise of 23,606 contracts from the previous week which had a total of 227,632 net contracts.
This week’s current strength score (the trader positioning range over the past three years, measured from 0 to 100) shows the speculators are currently Bullish with a score of 73.7 percent. The commercials are Bearish-Extreme with a score of 17.1 percent and the small traders (not shown in chart) are Bullish-Extreme with a score of 100.0 percent.
Price Trend-Following Model: Strong Uptrend
Our weekly trend-following model classifies the current market price position as: Strong Uptrend.
| Gold Futures Statistics | SPECULATORS | COMMERCIALS | SMALL TRADERS |
| – Percent of Open Interest Longs: | 56.2 | 15.8 | 12.6 |
| – Percent of Open Interest Shorts: | 8.5 | 72.1 | 3.9 |
| – Net Position: | 251,238 | -297,106 | 45,868 |
| – Gross Longs: | 296,183 | 83,382 | 66,220 |
| – Gross Shorts: | 44,945 | 380,488 | 20,352 |
| – Long to Short Ratio: | 6.6 to 1 | 0.2 to 1 | 3.3 to 1 |
| NET POSITION TREND: | |||
| – Strength Index Score (3 Year Range Pct): | 73.7 | 17.1 | 100.0 |
| – Strength Index Reading (3 Year Range): | Bullish | Bearish-Extreme | Bullish-Extreme |
| NET POSITION MOVEMENT INDEX: | |||
| – 6-Week Change in Strength Index: | 13.8 | -16.8 | 23.6 |
Silver Comex Futures:
 The Silver Comex Futures large speculator standing this week reached a net position of 32,060 contracts in the data reported through Tuesday. This was a weekly increase of 2,789 contracts from the previous week which had a total of 29,271 net contracts.
This week’s current strength score (the trader positioning range over the past three years, measured from 0 to 100) shows the speculators are currently Bullish with a score of 53.2 percent. The commercials are Bearish with a score of 38.2 percent and the small traders (not shown in chart) are Bullish-Extreme with a score of 80.9 percent.
Price Trend-Following Model: Strong Uptrend
Our weekly trend-following model classifies the current market price position as: Strong Uptrend.
| Silver Futures Statistics | SPECULATORS | COMMERCIALS | SMALL TRADERS |
| – Percent of Open Interest Longs: | 31.2 | 28.1 | 23.4 |
| – Percent of Open Interest Shorts: | 10.1 | 64.6 | 8.1 |
| – Net Position: | 32,060 | -55,292 | 23,232 |
| – Gross Longs: | 47,337 | 42,595 | 35,516 |
| – Gross Shorts: | 15,277 | 97,887 | 12,284 |
| – Long to Short Ratio: | 3.1 to 1 | 0.4 to 1 | 2.9 to 1 |
| NET POSITION TREND: | |||
| – Strength Index Score (3 Year Range Pct): | 53.2 | 38.2 | 80.9 |
| – Strength Index Reading (3 Year Range): | Bullish | Bearish | Bullish-Extreme |
| NET POSITION MOVEMENT INDEX: | |||
| – 6-Week Change in Strength Index: | -8.6 | 1.7 | 28.1 |
Copper Grade #1 Futures:
 The Copper Grade #1 Futures large speculator standing this week reached a net position of 53,441 contracts in the data reported through Tuesday. This was a weekly decrease of -4,417 contracts from the previous week which had a total of 57,858 net contracts.
This week’s current strength score (the trader positioning range over the past three years, measured from 0 to 100) shows the speculators are currently Bullish-Extreme with a score of 83.0 percent. The commercials are Bearish-Extreme with a score of 11.0 percent and the small traders (not shown in chart) are Bullish-Extreme with a score of 100.0 percent.
Price Trend-Following Model: Strong Uptrend
Our weekly trend-following model classifies the current market price position as: Strong Uptrend.
| Copper Futures Statistics | SPECULATORS | COMMERCIALS | SMALL TRADERS |
| – Percent of Open Interest Longs: | 36.1 | 30.5 | 9.1 |
| – Percent of Open Interest Shorts: | 16.3 | 56.1 | 3.3 |
| – Net Position: | 53,441 | -68,962 | 15,521 |
| – Gross Longs: | 97,415 | 82,378 | 24,507 |
| – Gross Shorts: | 43,974 | 151,340 | 8,986 |
| – Long to Short Ratio: | 2.2 to 1 | 0.5 to 1 | 2.7 to 1 |
| NET POSITION TREND: | |||
| – Strength Index Score (3 Year Range Pct): | 83.0 | 11.0 | 100.0 |
| – Strength Index Reading (3 Year Range): | Bullish-Extreme | Bearish-Extreme | Bullish-Extreme |
| NET POSITION MOVEMENT INDEX: | |||
| – 6-Week Change in Strength Index: | 0.0 | -2.1 | 13.2 |
Platinum Futures:
 The Platinum Futures large speculator standing this week reached a net position of 17,594 contracts in the data reported through Tuesday. This was a weekly decline of -516 contracts from the previous week which had a total of 18,110 net contracts.
This week’s current strength score (the trader positioning range over the past three years, measured from 0 to 100) shows the speculators are currently Bullish with a score of 55.0 percent. The commercials are Bearish with a score of 45.1 percent and the small traders (not shown in chart) are Bullish with a score of 70.1 percent.
Price Trend-Following Model: Strong Uptrend
Our weekly trend-following model classifies the current market price position as: Strong Uptrend.
| Platinum Futures Statistics | SPECULATORS | COMMERCIALS | SMALL TRADERS |
| – Percent of Open Interest Longs: | 52.0 | 24.3 | 13.1 |
| – Percent of Open Interest Shorts: | 29.5 | 54.7 | 5.2 |
| – Net Position: | 17,594 | -23,806 | 6,212 |
| – Gross Longs: | 40,741 | 19,042 | 10,264 |
| – Gross Shorts: | 23,147 | 42,848 | 4,052 |
| – Long to Short Ratio: | 1.8 to 1 | 0.4 to 1 | 2.5 to 1 |
| NET POSITION TREND: | |||
| – Strength Index Score (3 Year Range Pct): | 55.0 | 45.1 | 70.1 |
| – Strength Index Reading (3 Year Range): | Bullish | Bearish | Bullish |
| NET POSITION MOVEMENT INDEX: | |||
| – 6-Week Change in Strength Index: | 4.0 | -1.3 | -12.6 |
Palladium Futures:
 The Palladium Futures large speculator standing this week reached a net position of 1,225 contracts in the data reported through Tuesday. This was a weekly lift of 646 contracts from the previous week which had a total of 579 net contracts.
This week’s current strength score (the trader positioning range over the past three years, measured from 0 to 100) shows the speculators are currently Bullish-Extreme with a score of 100.0 percent. The commercials are Bearish-Extreme with a score of 0.0 percent and the small traders (not shown in chart) are Bullish with a score of 77.5 percent.
Price Trend-Following Model: Strong Uptrend
Our weekly trend-following model classifies the current market price position as: Strong Uptrend.
| Palladium Futures Statistics | SPECULATORS | COMMERCIALS | SMALL TRADERS |
| – Percent of Open Interest Longs: | 51.1 | 28.4 | 16.5 |
| – Percent of Open Interest Shorts: | 44.8 | 43.2 | 7.9 |
| – Net Position: | 1,225 | -2,890 | 1,665 |
| – Gross Longs: | 9,949 | 5,536 | 3,205 |
| – Gross Shorts: | 8,724 | 8,426 | 1,540 |
| – Long to Short Ratio: | 1.1 to 1 | 0.7 to 1 | 2.1 to 1 |
| NET POSITION TREND: | |||
| – Strength Index Score (3 Year Range Pct): | 100.0 | 0.0 | 77.5 |
| – Strength Index Reading (3 Year Range): | Bullish-Extreme | Bearish-Extreme | Bullish |
| NET POSITION MOVEMENT INDEX: | |||
| – 6-Week Change in Strength Index: | 9.4 | -8.6 | -0.8 |
Steel Futures Futures:
 The Steel Futures large speculator standing this week reached a net position of 11,022 contracts in the data reported through Tuesday. This was a weekly increase of 1,545 contracts from the previous week which had a total of 9,477 net contracts.
This week’s current strength score (the trader positioning range over the past three years, measured from 0 to 100) shows the speculators are currently Bullish-Extreme with a score of 100.0 percent. The commercials are Bearish-Extreme with a score of 0.0 percent and the small traders (not shown in chart) are Bullish-Extreme with a score of 82.4 percent.
Price Trend-Following Model: Strong Uptrend
Our weekly trend-following model classifies the current market price position as: Strong Uptrend.
| Steel Futures Statistics | SPECULATORS | COMMERCIALS | SMALL TRADERS |
| – Percent of Open Interest Longs: | 37.8 | 57.9 | 1.6 |
| – Percent of Open Interest Shorts: | 6.8 | 90.0 | 0.6 |
| – Net Position: | 11,022 | -11,390 | 368 |
| – Gross Longs: | 13,437 | 20,592 | 564 |
| – Gross Shorts: | 2,415 | 31,982 | 196 |
| – Long to Short Ratio: | 5.6 to 1 | 0.6 to 1 | 2.9 to 1 |
| NET POSITION TREND: | |||
| – Strength Index Score (3 Year Range Pct): | 100.0 | 0.0 | 82.4 |
| – Strength Index Reading (3 Year Range): | Bullish-Extreme | Bearish-Extreme | Bullish-Extreme |
| NET POSITION MOVEMENT INDEX: | |||
| – 6-Week Change in Strength Index: | 28.1 | -28.4 | 24.4 |
Article By InvestMacro – Receive our weekly COT Newsletter
*COT Report: The COT data, released weekly to the public each Friday, is updated through the most recent Tuesday (data is 3 days old) and shows a quick view of how large speculators or non-commercials (for-profit traders) were positioned in the futures markets.
The CFTC categorizes trader positions according to commercial hedgers (traders who use futures contracts for hedging as part of the business), non-commercials (large traders who speculate to realize trading profits) and nonreportable traders (usually small traders/speculators) as well as their open interest (contracts open in the market at time of reporting). See CFTC criteria here.

- The Tech‑heavy NASDAQ Index jumped by more than 3.3%. The offshore yuan is trading at its highest level since 2023 Jul 31, 2026
- USD/JPY After Volatility: Multiple Events in One Day Jul 31, 2026
- The US indices sell off amid renewed US-Iran clashes. Oil jumps by 7% Jul 30, 2026
- USD/JPY Temporary in Equilibrium: Multiple Factors in Focus Jul 30, 2026
- GBP/USD at Month’s Lows: The Outlook Remains Weak Jul 29, 2026
- Crude oil falls below $80 per barrel. Australia sees inflation slowdown Jul 29, 2026
- The US Tech sector hit by sell‑off. Oil prices decline on renewed negotiations Jul 28, 2026
- Gold Declines, Focus on Fed and Falling Oil Prices Jul 28, 2026
- This week will be one of the most crowded for central‑bank meetings Jul 27, 2026
- EUR/USD Ahead of a Key Week: Holding Near Lows Jul 27, 2026