By InvestMacro
Here are the latest charts and statistics for the Commitment of Traders (COT) data published by the Commodities Futures Trading Commission (CFTC).
The latest COT data is updated through Tuesday July 14th and shows a quick view of how large market participants (for-profit speculators and commercial traders) were positioned in the futures markets. All currency positions are in direct relation to the US dollar where, for example, a bet for the euro is a bet that the euro will rise versus the dollar while a bet against the euro will be a bet that the euro will decline versus the dollar.
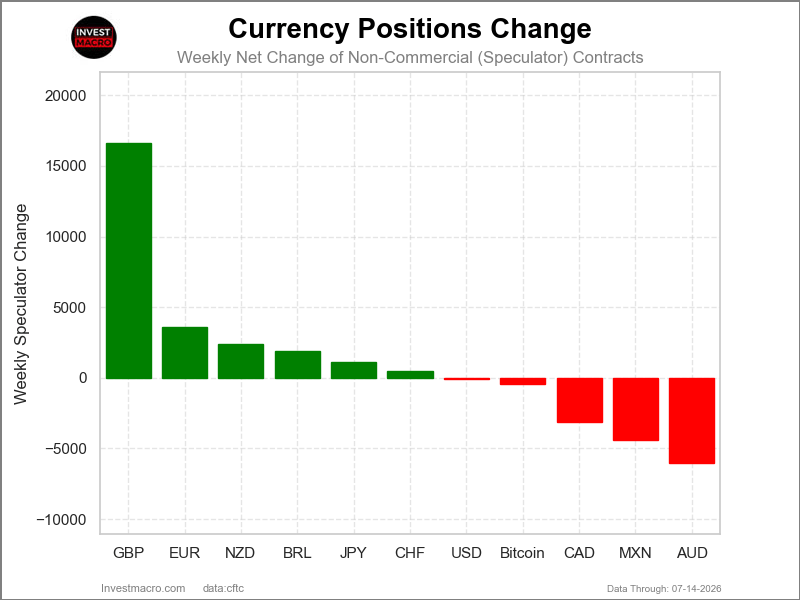
The COT currency market speculator bets were overall higher this week as six out of the eleven currency markets we cover had higher positioning while the other five markets had lower speculator contracts.
Leading the gains for the currency markets was the British Pound (16,650 contracts) with the EuroFX (3,622 contracts), New Zealand Dollar (2,423 contracts), Brazilian Real (1,909 contracts), Japanese Yen (1,115 contracts) and the Swiss Franc (458 contracts) also showing positive weeks.
Free Reports:
The currencies seeing declines in speculator bets on the week were the Australian Dollar (-6,059 contracts) and the Mexican Peso (-4,402 contracts), the Canadian Dollar (-3,153 contracts), Bitcoin (-409 contracts) and the US Dollar Index (-96 contracts) also registering lower bets on the week.
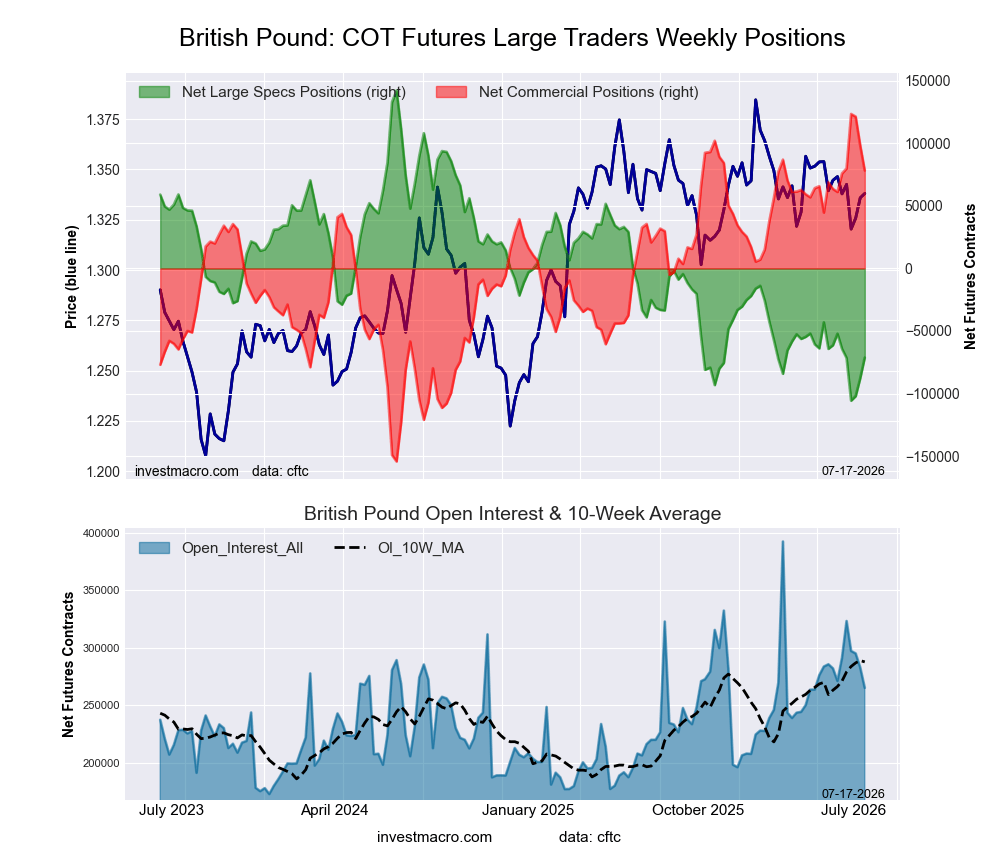
Highlighting the major Currency markets speculator positions this week was the British Pound Sterling, which saw a third straight week of improvement in the speculator bets by over 16,000 contracts this week, following last week’s improvement by over 14,000 contracts. In the past three weeks alone, the British Pound Sterling speculator positions have improved by over 34,000 net positions after falling to historical weakness to over -105,000 net contracts on June 23rd (and close to an all-time record bearish position by just a few thousand contracts). Overall, the British Pound Sterling position has been in bearish territory now for 51 consecutive weeks, dating back to July 29th of 2025. In the Currency markets, the GBP rose for a third straight week and is trading right in the middle of its sideways trading range with a close this week at 1.3454. We have now seen this trading range dating back for over a year with a top side of 1.3750 and support underneath at 1.3150.
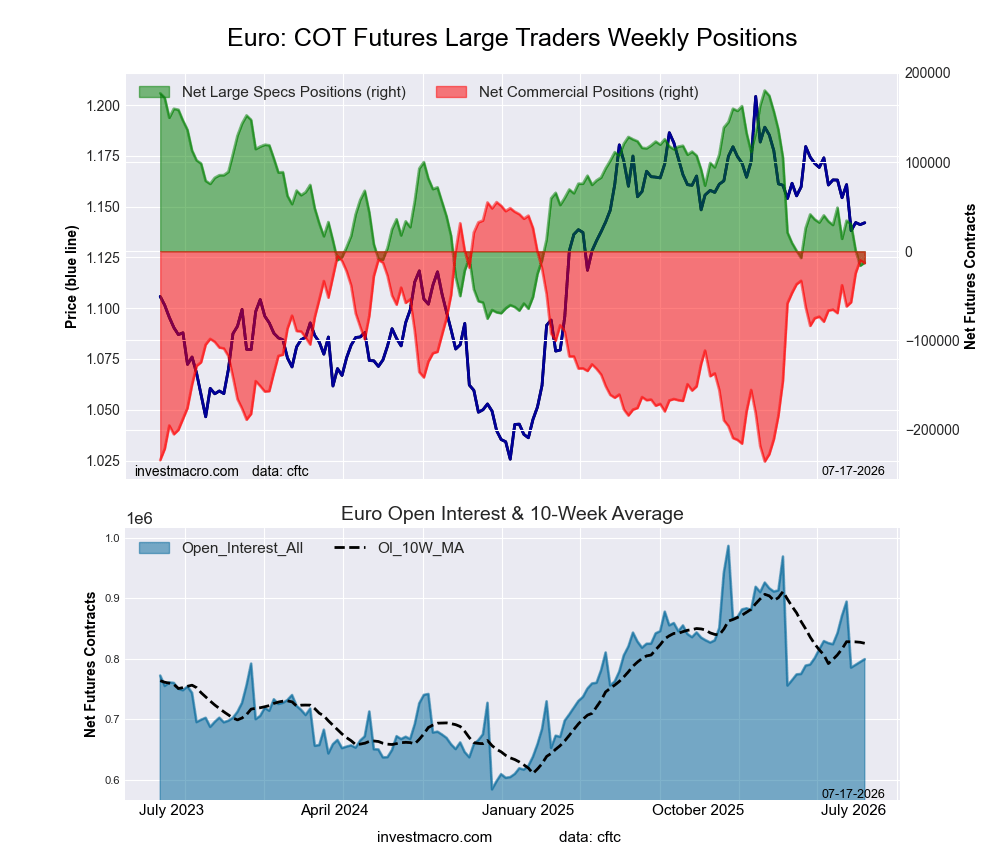
The Euro speculator bets this week saw a small increase by over 3,500 contracts following three consecutive weeks of declines that have pushed the Euro speculator bets into bearish territory for a second consecutive week. The current bearish level for Euro speculators is at -12,605 net positions this week and marks just the third time out of the past 71 weeks that the Euro positions have seen bearish net positions. In the Currency markets this week, the Euro had a modest increase but is now trading below the sideways trading channel that had prevailed for over a year. Currently, the Euro is trading at 1.1460 with an overhead resistance at the significant 1.1500 level with immediate support below at 1.1400.
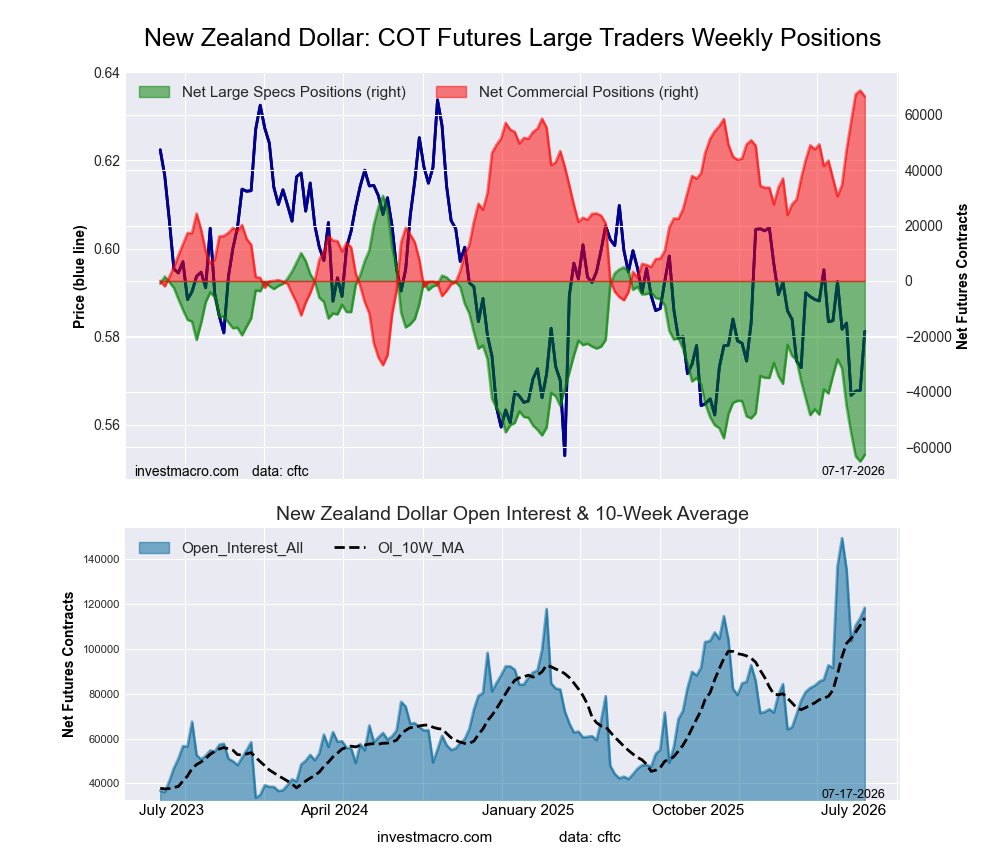
Next up, the New Zealand Dollar speculator bets rebounded slightly off the all-time record low that was hit last week at a total of -65,189 net contracts. The NZD speculator bets rose by approximately 2,500 contracts this week, after five consecutive weeks of declining speculator bets. Overall, the New Zealand Dollar speculator positions have now been in bearish territory for exactly 52 weeks, dating back to July of 2025. In the Foreign Exchange markets, the New Zealand Dollar rose for a third consecutive week and closed out the week around the 0.5850 exchange rate. In the big picture, the New Zealand Dollar has been on a downtrend since 2021 when prices reached all the way up to 0.7464 in February of 2021. Since then, the NZD has been steadily trending lower and continues to sit below its 200-week moving average at the moment.
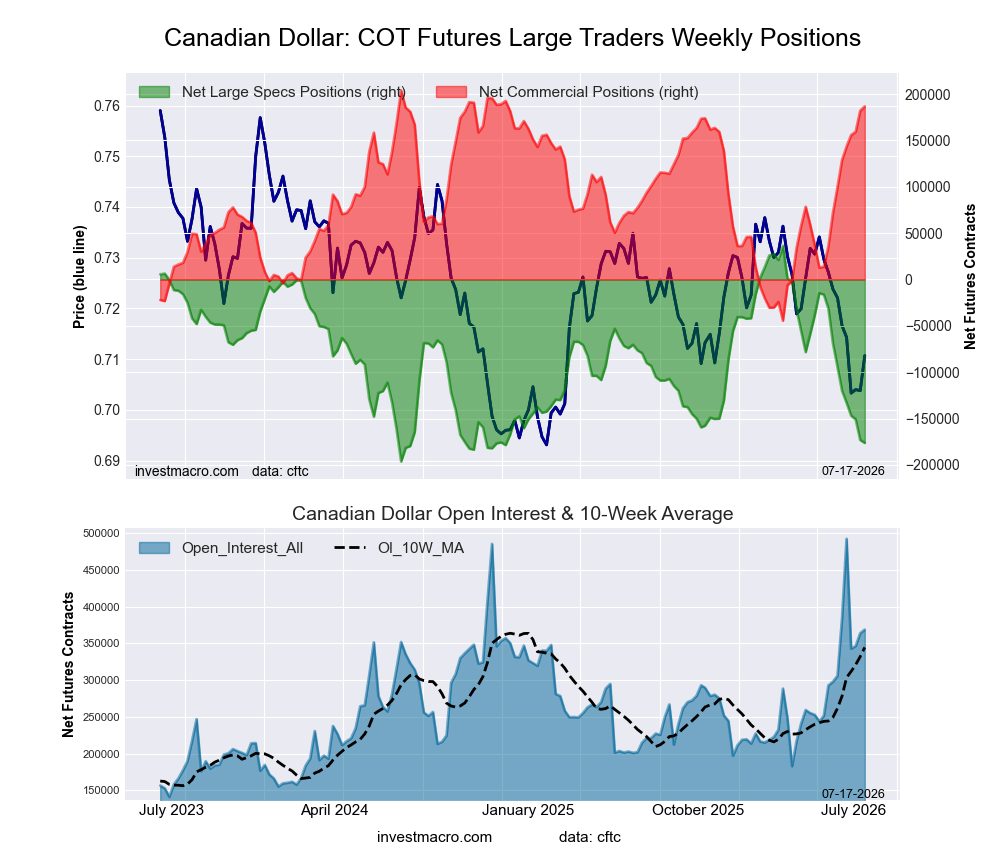
The Canadian Dollar speculator bets continued to deteriorate this week and have now fallen for 10 consecutive weeks. Over these past 10 weeks, the Canadian Dollar speculative positions have shed a total of -161,620 net contracts. This brings the overall net standing to -176,279, which is the most bearish level since 2024 and only -20,000 contracts off the all-time bearish record. In the Foreign Exchange markets, the CAD this week rose for a third consecutive week and ascended above the 0.7150 level for the first time in about five weeks. In the big picture, and similarly to the NZD, the CAD has been in a downtrend since reaching multi-year highs in 2021 at around 0.8325, and since that period has been on the downtrend with the CAD trading below the 200-week moving average.
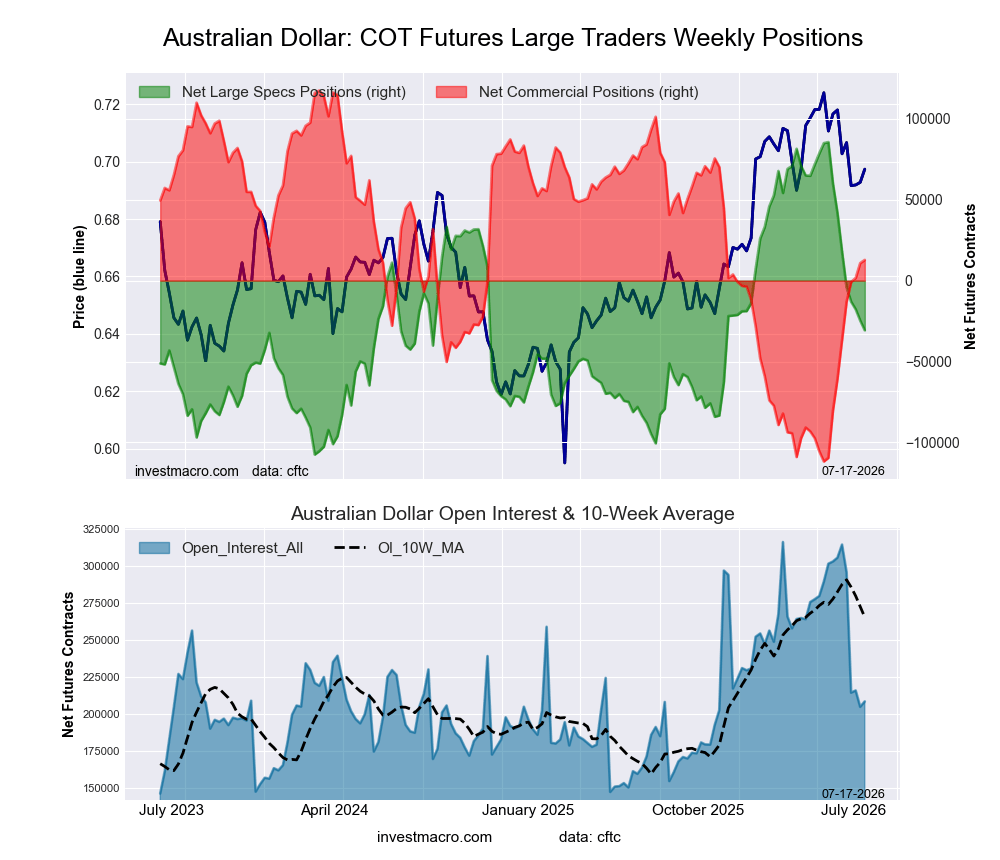
The Australian Dollar net speculator positions have been on the downtrend this week with an eight-week straight decline in positions that have taken the overall net speculator levels from a total of 85,644 contracts on May 19th to this week’s -30,710 net contracts position. This weakness has seen a total of -116,354 net contracts taken off of the bullish position over just these last eight weeks and this week’s Australian Dollar speculator level is the most bearish in the past 31 weeks, dating back to December of 2025. In the Foreign Exchange markets, the Australian Dollar saw a boost for a third consecutive week and closed out just below the 0.7000 level at 0.6975. Despite the weakness in speculator bets, the AUD spot currency price has been in an uptrend since early 2025 and continues to trade over its 200-week moving average.
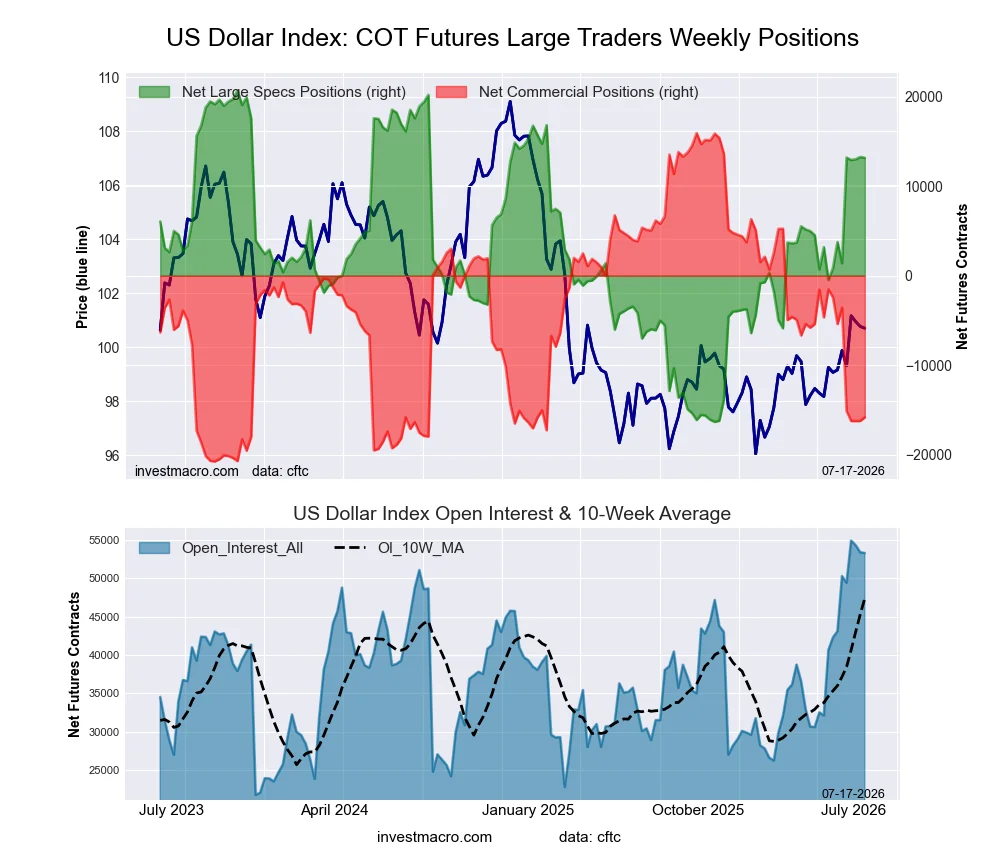
Finally, the US Dollar Index saw a tiny dip of just -96 contracts this week as the overall net speculator position hovers just right around the +13,000 contract level for a fifth consecutive week. The current net speculator positions are sitting around the highest level since early 2025. In the Foreign Exchange market, the US Dollar Index saw a minor decrease this week but remains above the sideways trending channel that had prevailed for over a year until about three weeks ago. Currently, the DXY trades at 100.58 and has support below from 100.00-100.25. The next major levels above are 101.50 as well as 102.50.
In the major Currency market price performances this week, the New Zealand Dollar was higher by 1.47% on the week. The Canadian Dollar came in at a close second with a 1.08% rise, while the Australian Dollar saw a gain of 0.73%. The British Pound Sterling was up by 0.56% on the week and was followed by Bitcoin, which edged slightly higher by 0.41%.
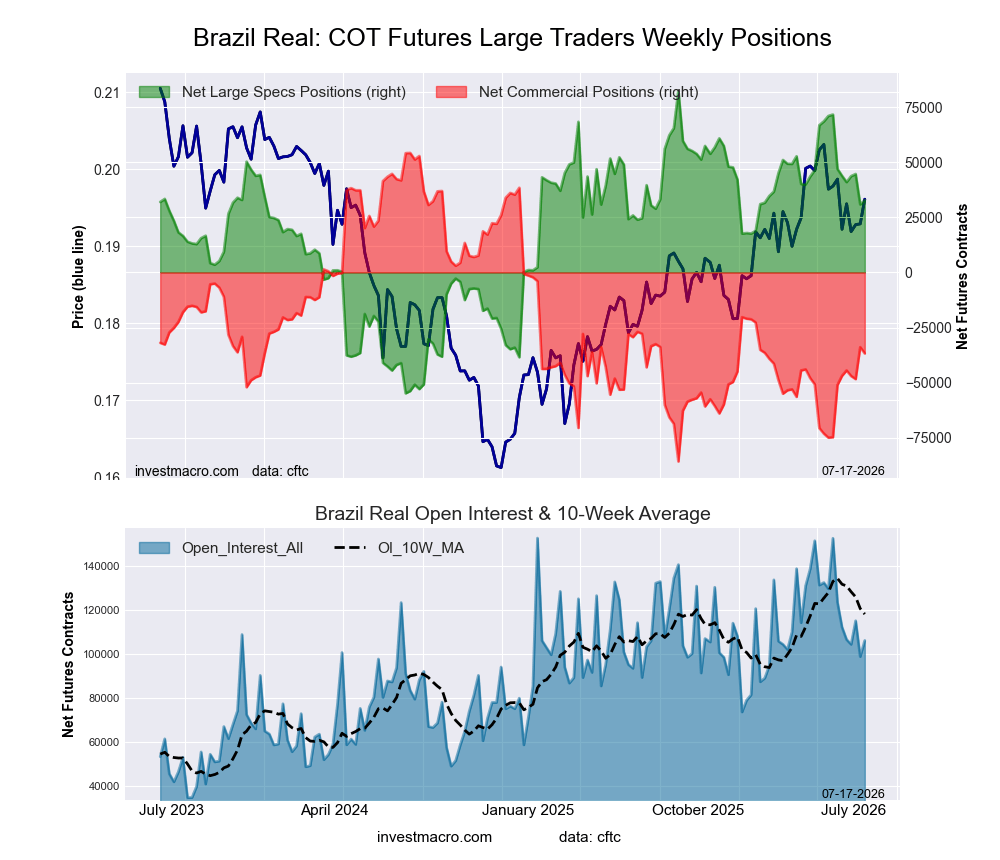
The Euro squeaked out a gain by 0.35%, while the Swiss Franc was up by 0.31%. The Brazilian Real rounded out the gainers with a small 0.17% increase on the week.
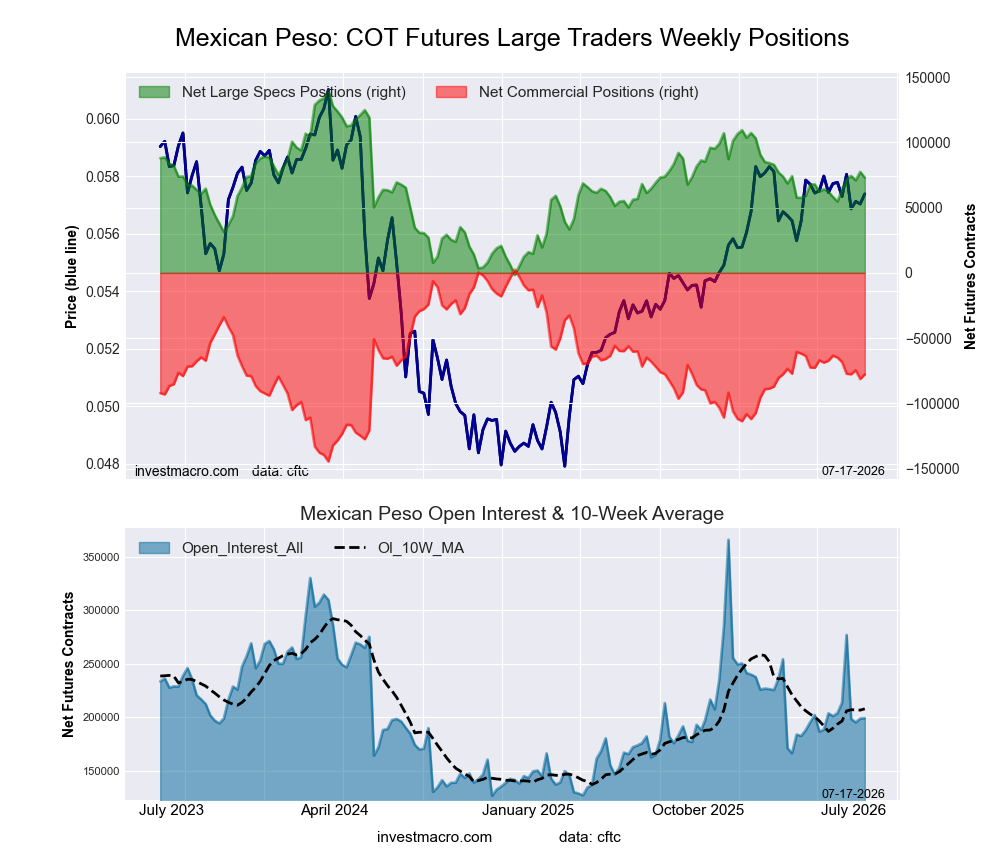
On the downside, the Mexican Peso was virtually unchanged as it slid by just -0.09% on the week, followed by the Japanese Yen, which dipped by -0.18%.
The biggest decliner on the week with a modest slide was the US Dollar Index, which dipped by a modest -0.33%.
Legend: Open Interest | Speculators Current Net Position | Weekly Specs Change | Specs Strength Score compared to last 3-Years (0-100 range)
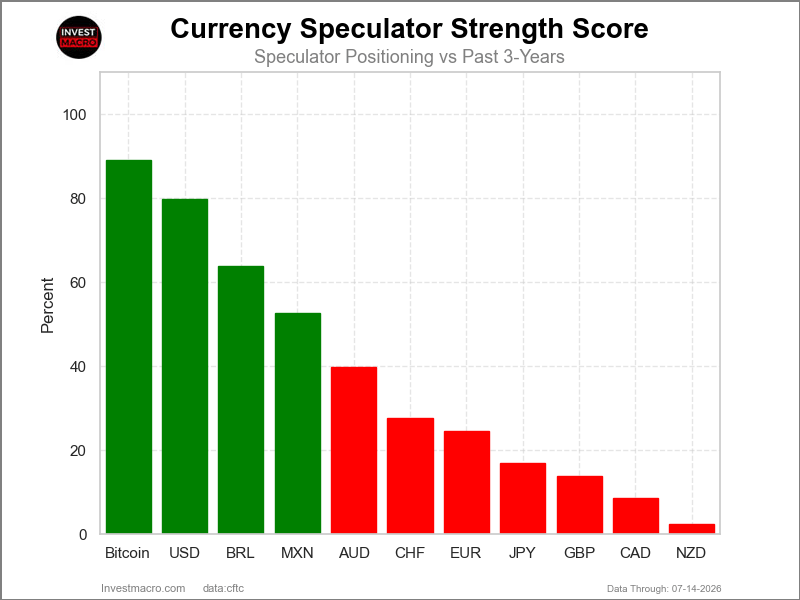
COT Strength Scores (a normalized measure of Speculator positions over a 3-Year range, from 0 to 100 where above 80 is Extreme-Bullish and below 20 is Extreme-Bearish) showed that Bitcoin (89 percent) and the US Dollar Index (80 percent) lead the currency markets this week. The Brazilian Real (64 percent) and the Mexican Peso (53 percent) come in as the next highest in the weekly strength scores.
On the downside, the New Zealand Dollar (3 percent), the Canadian Dollar (9 percent), the British Pound (14 percent) and the Japanese Yen (17 percent) come in at the lowest strength levels currently and are all in Extreme-Bearish territory (below 20 percent).
3-Year Strength Statistics:
US Dollar Index (79.7 percent) vs US Dollar Index previous week (79.9 percent)
EuroFX (24.6 percent) vs EuroFX previous week (23.2 percent)
British Pound Sterling (13.9 percent) vs British Pound Sterling previous week (7.2 percent)
Japanese Yen (16.9 percent) vs Japanese Yen previous week (16.6 percent)
Swiss Franc (27.7 percent) vs Swiss Franc previous week (26.7 percent)
Canadian Dollar (8.6 percent) vs Canadian Dollar previous week (10.0 percent)
Australian Dollar (39.8 percent) vs Australian Dollar previous week (42.9 percent)
New Zealand Dollar (2.5 percent) vs New Zealand Dollar previous week (0.0 percent)
Mexican Peso (52.7 percent) vs Mexican Peso previous week (55.9 percent)
Brazilian Real (63.8 percent) vs Brazilian Real previous week (62.4 percent)
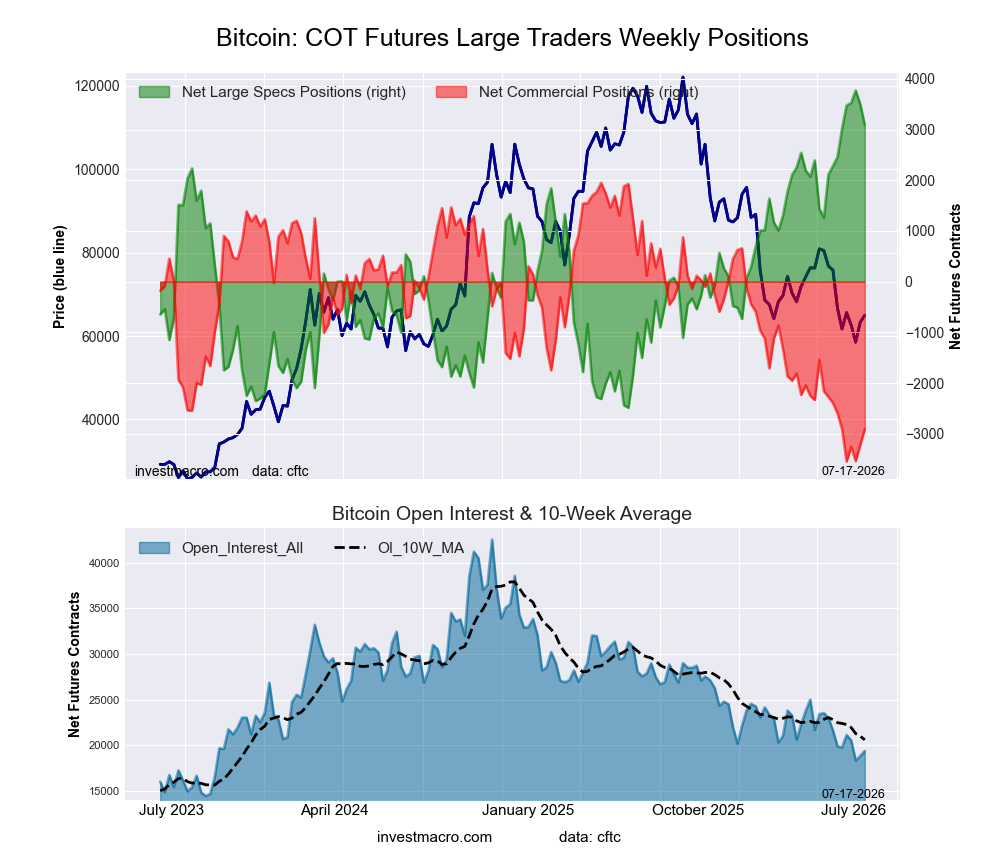
Bitcoin (89.1 percent) vs Bitcoin previous week (95.7 percent)
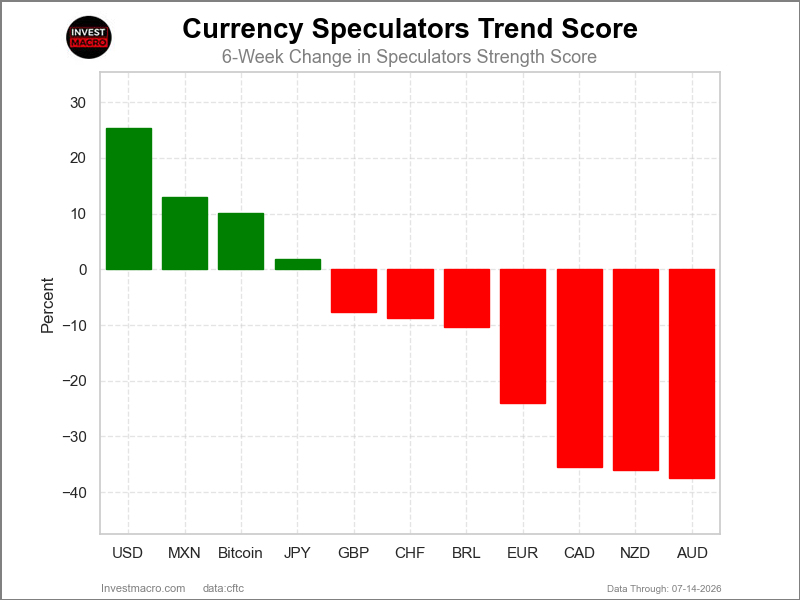
COT Strength Score Trends (or move index, calculates the 6-week changes in strength scores) showed that the US Dollar Index (25 percent) and the Mexican Peso (13 percent) lead the past six weeks trends for the currencies. Bitcoin (10 percent) and the Japanese Yen (2 percent) are the next highest positive movers in the 3-Year trends data.
The Australian Dollar (-38 percent) leads the downside trend scores currently with the New Zealand Dollar (-36 percent), Canadian Dollar (-35 percent) and the EuroFX (-24 percent) following next with lower trend scores.
3-Year Strength Trends:
US Dollar Index (25.4 percent) vs US Dollar Index previous week (33.5 percent)
EuroFX (-24.0 percent) vs EuroFX previous week (-17.8 percent)
British Pound Sterling (-7.7 percent) vs British Pound Sterling previous week (-10.7 percent)
Japanese Yen (1.9 percent) vs Japanese Yen previous week (-2.5 percent)
Swiss Franc (-8.7 percent) vs Swiss Franc previous week (-4.9 percent)
Canadian Dollar (-35.4 percent) vs Canadian Dollar previous week (-44.9 percent)
Australian Dollar (-37.5 percent) vs Australian Dollar previous week (-43.9 percent)
New Zealand Dollar (-36.0 percent) vs New Zealand Dollar previous week (-32.3 percent)
Mexican Peso (13.0 percent) vs Mexican Peso previous week (13.6 percent)
Brazilian Real (-10.3 percent) vs Brazilian Real previous week (-29.7 percent)
Bitcoin (10.1 percent) vs Bitcoin previous week (19.5 percent)
Our weekly trend-following model classifies the current market price position as: Uptrend.
| US DOLLAR INDEX Statistics | SPECULATORS | COMMERCIALS | SMALL TRADERS |
| – Percent of Open Interest Longs: | 59.4 | 29.9 | 8.0 |
| – Percent of Open Interest Shorts: | 34.7 | 59.6 | 3.0 |
| – Net Position: | 13,173 | -15,834 | 2,661 |
| – Gross Longs: | 31,641 | 15,926 | 4,256 |
| – Gross Shorts: | 18,468 | 31,760 | 1,595 |
| – Long to Short Ratio: | 1.7 to 1 | 0.5 to 1 | 2.7 to 1 |
| NET POSITION TREND: | |||
| – Strength Index Score (3 Year Range Pct): | 79.7 | 13.5 | 88.2 |
| – Strength Index Reading (3 Year Range): | Bullish | Bearish-Extreme | Bullish-Extreme |
| NET POSITION MOVEMENT INDEX: | |||
| – 6-Week Change in Strength Index: | 25.4 | -28.4 | 18.3 |
Our weekly trend-following model classifies the current market price position as: Strong Downtrend.
| EURO Currency Statistics | SPECULATORS | COMMERCIALS | SMALL TRADERS |
| – Percent of Open Interest Longs: | 28.8 | 57.2 | 10.4 |
| – Percent of Open Interest Shorts: | 30.4 | 58.9 | 7.1 |
| – Net Position: | -12,605 | -13,390 | 25,995 |
| – Gross Longs: | 230,307 | 457,594 | 82,849 |
| – Gross Shorts: | 242,912 | 470,984 | 56,854 |
| – Long to Short Ratio: | 0.9 to 1 | 1.0 to 1 | 1.5 to 1 |
| NET POSITION TREND: | |||
| – Strength Index Score (3 Year Range Pct): | 24.6 | 76.5 | 29.4 |
| – Strength Index Reading (3 Year Range): | Bearish | Bullish | Bearish |
| NET POSITION MOVEMENT INDEX: | |||
| – 6-Week Change in Strength Index: | -24.0 | 19.3 | 11.5 |
Our weekly trend-following model classifies the current market price position as: Uptrend.
| BRITISH POUND Statistics | SPECULATORS | COMMERCIALS | SMALL TRADERS |
| – Percent of Open Interest Longs: | 19.3 | 68.6 | 10.1 |
| – Percent of Open Interest Shorts: | 46.1 | 39.0 | 12.7 |
| – Net Position: | -71,253 | 78,244 | -6,991 |
| – Gross Longs: | 51,085 | 181,763 | 26,711 |
| – Gross Shorts: | 122,338 | 103,519 | 33,702 |
| – Long to Short Ratio: | 0.4 to 1 | 1.8 to 1 | 0.8 to 1 |
| NET POSITION TREND: | |||
| – Strength Index Score (3 Year Range Pct): | 13.9 | 83.7 | 35.1 |
| – Strength Index Reading (3 Year Range): | Bearish-Extreme | Bullish-Extreme | Bearish |
| NET POSITION MOVEMENT INDEX: | |||
| – 6-Week Change in Strength Index: | -7.7 | 6.2 | 4.9 |
Our weekly trend-following model classifies the current market price position as: Strong Downtrend.
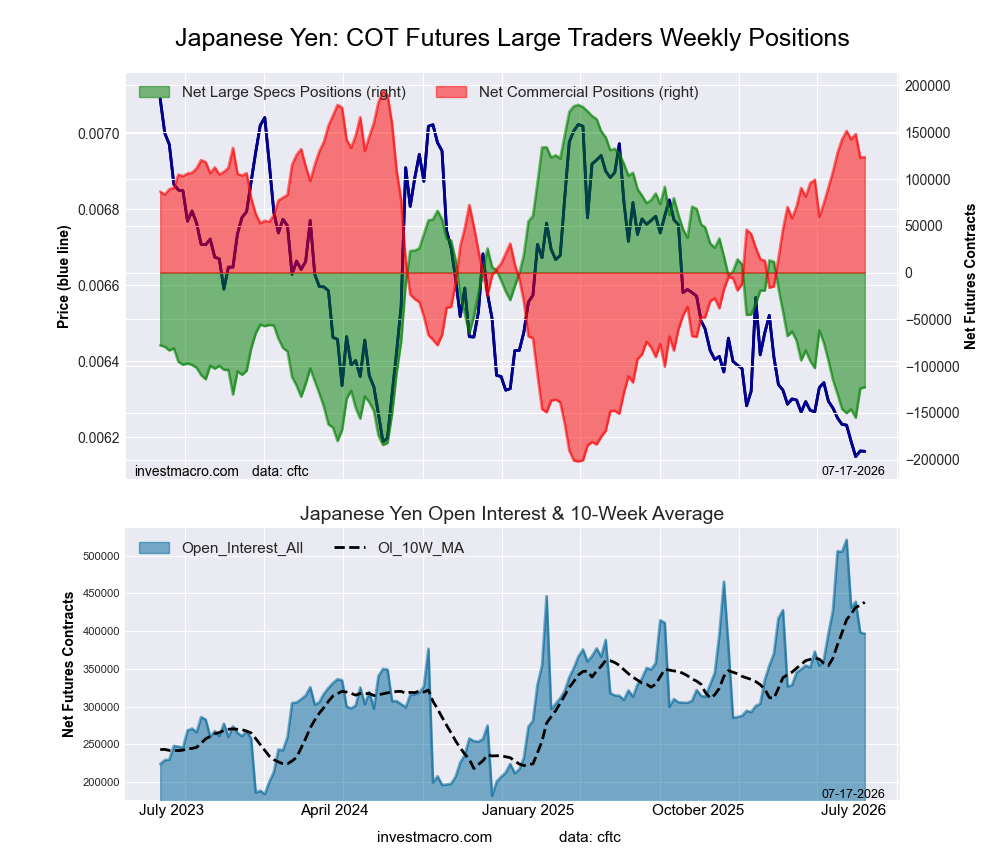
| JAPANESE YEN Statistics | SPECULATORS | COMMERCIALS | SMALL TRADERS |
| – Percent of Open Interest Longs: | 29.2 | 55.3 | 11.2 |
| – Percent of Open Interest Shorts: | 60.2 | 24.1 | 11.4 |
| – Net Position: | -122,663 | 123,418 | -755 |
| – Gross Longs: | 115,965 | 219,170 | 44,367 |
| – Gross Shorts: | 238,628 | 95,752 | 45,122 |
| – Long to Short Ratio: | 0.5 to 1 | 2.3 to 1 | 1.0 to 1 |
| NET POSITION TREND: | |||
| – Strength Index Score (3 Year Range Pct): | 16.9 | 82.1 | 30.8 |
| – Strength Index Reading (3 Year Range): | Bearish-Extreme | Bullish-Extreme | Bearish |
| NET POSITION MOVEMENT INDEX: | |||
| – 6-Week Change in Strength Index: | 1.9 | -1.1 | -7.0 |
Our weekly trend-following model classifies the current market price position as: Strong Downtrend.
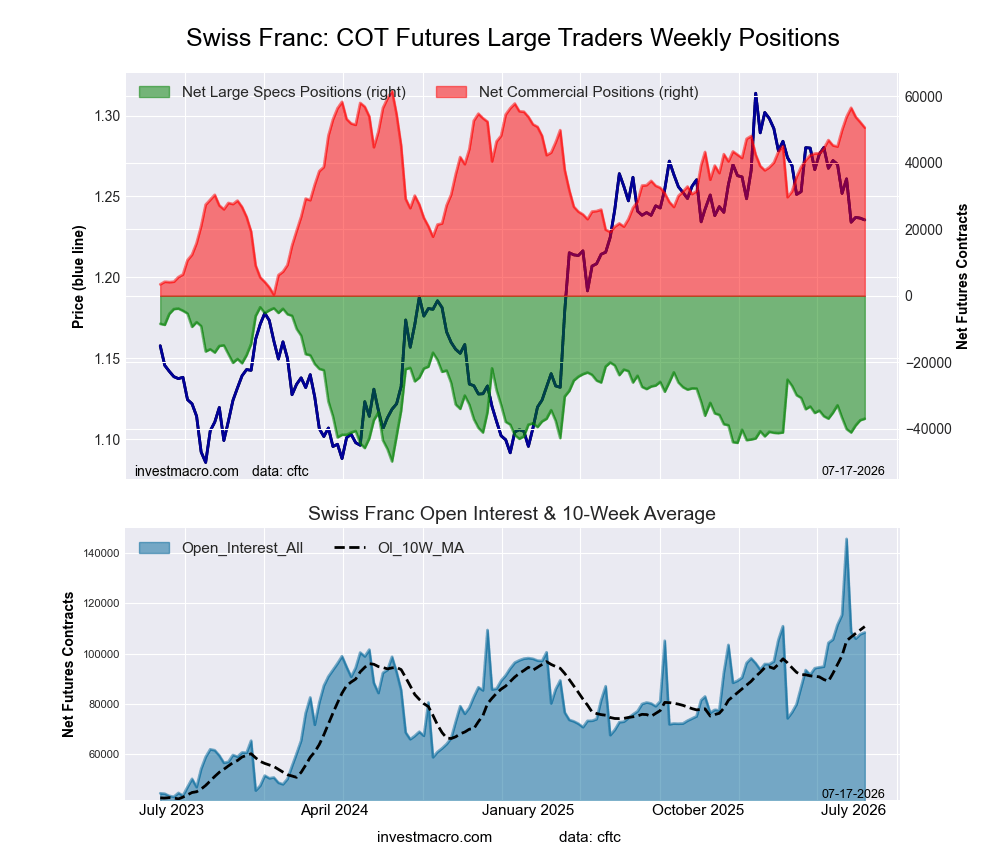
| SWISS FRANC Statistics | SPECULATORS | COMMERCIALS | SMALL TRADERS |
| – Percent of Open Interest Longs: | 9.1 | 79.5 | 9.5 |
| – Percent of Open Interest Shorts: | 43.2 | 32.9 | 22.0 |
| – Net Position: | -36,956 | 50,511 | -13,555 |
| – Gross Longs: | 9,909 | 86,231 | 10,257 |
| – Gross Shorts: | 46,865 | 35,720 | 23,812 |
| – Long to Short Ratio: | 0.2 to 1 | 2.4 to 1 | 0.4 to 1 |
| NET POSITION TREND: | |||
| – Strength Index Score (3 Year Range Pct): | 27.7 | 81.8 | 21.3 |
| – Strength Index Reading (3 Year Range): | Bearish | Bullish-Extreme | Bearish |
| NET POSITION MOVEMENT INDEX: | |||
| – 6-Week Change in Strength Index: | -8.7 | 9.3 | -6.9 |
Our weekly trend-following model classifies the current market price position as: Downtrend.
| CANADIAN DOLLAR Statistics | SPECULATORS | COMMERCIALS | SMALL TRADERS |
| – Percent of Open Interest Longs: | 8.1 | 81.0 | 8.3 |
| – Percent of Open Interest Shorts: | 55.9 | 30.4 | 11.1 |
| – Net Position: | -176,279 | 186,718 | -10,439 |
| – Gross Longs: | 29,712 | 298,826 | 30,432 |
| – Gross Shorts: | 205,991 | 112,108 | 40,871 |
| – Long to Short Ratio: | 0.1 to 1 | 2.7 to 1 | 0.7 to 1 |
| NET POSITION TREND: | |||
| – Strength Index Score (3 Year Range Pct): | 8.6 | 93.1 | 17.5 |
| – Strength Index Reading (3 Year Range): | Bearish-Extreme | Bullish-Extreme | Bearish-Extreme |
| NET POSITION MOVEMENT INDEX: | |||
| – 6-Week Change in Strength Index: | -35.4 | 35.1 | -14.9 |
Our weekly trend-following model classifies the current market price position as: Strong Downtrend.
| AUSTRALIAN DOLLAR Statistics | SPECULATORS | COMMERCIALS | SMALL TRADERS |
| – Percent of Open Interest Longs: | 32.8 | 47.6 | 16.9 |
| – Percent of Open Interest Shorts: | 47.5 | 41.4 | 8.3 |
| – Net Position: | -30,710 | 12,813 | 17,897 |
| – Gross Longs: | 68,377 | 99,130 | 35,137 |
| – Gross Shorts: | 99,087 | 86,317 | 17,240 |
| – Long to Short Ratio: | 0.7 to 1 | 1.1 to 1 | 2.0 to 1 |
| NET POSITION TREND: | |||
| – Strength Index Score (3 Year Range Pct): | 39.8 | 54.3 | 77.7 |
| – Strength Index Reading (3 Year Range): | Bearish | Bullish | Bullish |
| NET POSITION MOVEMENT INDEX: | |||
| – 6-Week Change in Strength Index: | -37.5 | 32.1 | -2.3 |
Our weekly trend-following model classifies the current market price position as: Weak Downtrend.
| NEW ZEALAND DOLLAR Statistics | SPECULATORS | COMMERCIALS | SMALL TRADERS |
| – Percent of Open Interest Longs: | 7.6 | 88.5 | 2.2 |
| – Percent of Open Interest Shorts: | 60.7 | 32.1 | 5.5 |
| – Net Position: | -62,766 | 66,637 | -3,871 |
| – Gross Longs: | 8,936 | 104,557 | 2,583 |
| – Gross Shorts: | 71,702 | 37,920 | 6,454 |
| – Long to Short Ratio: | 0.1 to 1 | 2.8 to 1 | 0.4 to 1 |
| NET POSITION TREND: | |||
| – Strength Index Score (3 Year Range Pct): | 2.5 | 97.8 | 3.7 |
| – Strength Index Reading (3 Year Range): | Bearish-Extreme | Bullish-Extreme | Bearish-Extreme |
| NET POSITION MOVEMENT INDEX: | |||
| – 6-Week Change in Strength Index: | -36.0 | 36.3 | -19.3 |
Our weekly trend-following model classifies the current market price position as: Uptrend.
| MEXICAN PESO Statistics | SPECULATORS | COMMERCIALS | SMALL TRADERS |
| – Percent of Open Interest Longs: | 53.7 | 41.6 | 3.9 |
| – Percent of Open Interest Shorts: | 17.1 | 80.6 | 1.5 |
| – Net Position: | 72,955 | -77,740 | 4,785 |
| – Gross Longs: | 107,127 | 82,973 | 7,814 |
| – Gross Shorts: | 34,172 | 160,713 | 3,029 |
| – Long to Short Ratio: | 3.1 to 1 | 0.5 to 1 | 2.6 to 1 |
| NET POSITION TREND: | |||
| – Strength Index Score (3 Year Range Pct): | 52.7 | 45.4 | 62.2 |
| – Strength Index Reading (3 Year Range): | Bullish | Bearish | Bullish |
| NET POSITION MOVEMENT INDEX: | |||
| – 6-Week Change in Strength Index: | 13.0 | -8.8 | -37.8 |
Our weekly trend-following model classifies the current market price position as: Uptrend.
| BRAZIL REAL Statistics | SPECULATORS | COMMERCIALS | SMALL TRADERS |
| – Percent of Open Interest Longs: | 73.5 | 20.8 | 4.7 |
| – Percent of Open Interest Shorts: | 42.6 | 55.5 | 1.0 |
| – Net Position: | 32,757 | -36,772 | 4,015 |
| – Gross Longs: | 77,985 | 22,055 | 5,031 |
| – Gross Shorts: | 45,228 | 58,827 | 1,016 |
| – Long to Short Ratio: | 1.7 to 1 | 0.4 to 1 | 5.0 to 1 |
| NET POSITION TREND: | |||
| – Strength Index Score (3 Year Range Pct): | 63.8 | 35.0 | 43.3 |
| – Strength Index Reading (3 Year Range): | Bullish | Bearish | Bearish |
| NET POSITION MOVEMENT INDEX: | |||
| – 6-Week Change in Strength Index: | -10.3 | 10.2 | -0.5 |
Our weekly trend-following model classifies the current market price position as: Strong Downtrend.
| BITCOIN Statistics | SPECULATORS | COMMERCIALS | SMALL TRADERS |
| – Percent of Open Interest Longs: | 82.0 | 0.4 | 4.5 |
| – Percent of Open Interest Shorts: | 66.1 | 15.4 | 5.5 |
| – Net Position: | 3,091 | -2,905 | -186 |
| – Gross Longs: | 15,899 | 71 | 871 |
| – Gross Shorts: | 12,808 | 2,976 | 1,057 |
| – Long to Short Ratio: | 1.2 to 1 | 0.0 to 1 | 0.8 to 1 |
| NET POSITION TREND: | |||
| – Strength Index Score (3 Year Range Pct): | 89.1 | 11.6 | 27.7 |
| – Strength Index Reading (3 Year Range): | Bullish-Extreme | Bearish-Extreme | Bearish |
| NET POSITION MOVEMENT INDEX: | |||
| – 6-Week Change in Strength Index: | 10.1 | -5.6 | -16.7 |
Article By InvestMacro – Receive our weekly COT Reports by Email
*COT Report: The COT data, released weekly to the public each Friday, is updated through the most recent Tuesday (data is 3 days old) and shows a quick view of how large speculators or non-commercials (for-profit traders) were positioned in the futures markets.
The CFTC categorizes trader positions according to commercial hedgers (traders who use futures contracts for hedging as part of the business), non-commercials (large traders who speculate to realize trading profits) and nonreportable traders (usually small traders/speculators) as well as their open interest (contracts open in the market at time of reporting).See CFTC criteria here.
All information and opinions on this website and contained in this article are for general informational purposes only and do not constitute investment advice.
By InvestMacro Here are the latest charts and statistics for the Commitment of Traders (COT)…
By InvestMacro The latest update for the weekly Commitment of Traders (COT) report was released…
By InvestMacro Here are the latest charts and statistics for the Commitment of Traders (COT)…
By InvestMacro Here are the latest charts and statistics for the Commitment of Traders (COT)…
By InvestMacro Here are the latest charts and statistics for the Commitment of Traders (COT)…
By InvestMacro Here are the latest charts and statistics for the Commitment of Traders (COT)…
This website uses cookies.