By InvestMacro
Here are the latest charts and statistics for the Commitment of Traders (COT) data published by the Commodities Futures Trading Commission (CFTC).
The latest COT data is updated through Tuesday August 4th and shows a quick view of how large traders (for-profit speculators and commercial entities) were positioned in the futures markets.
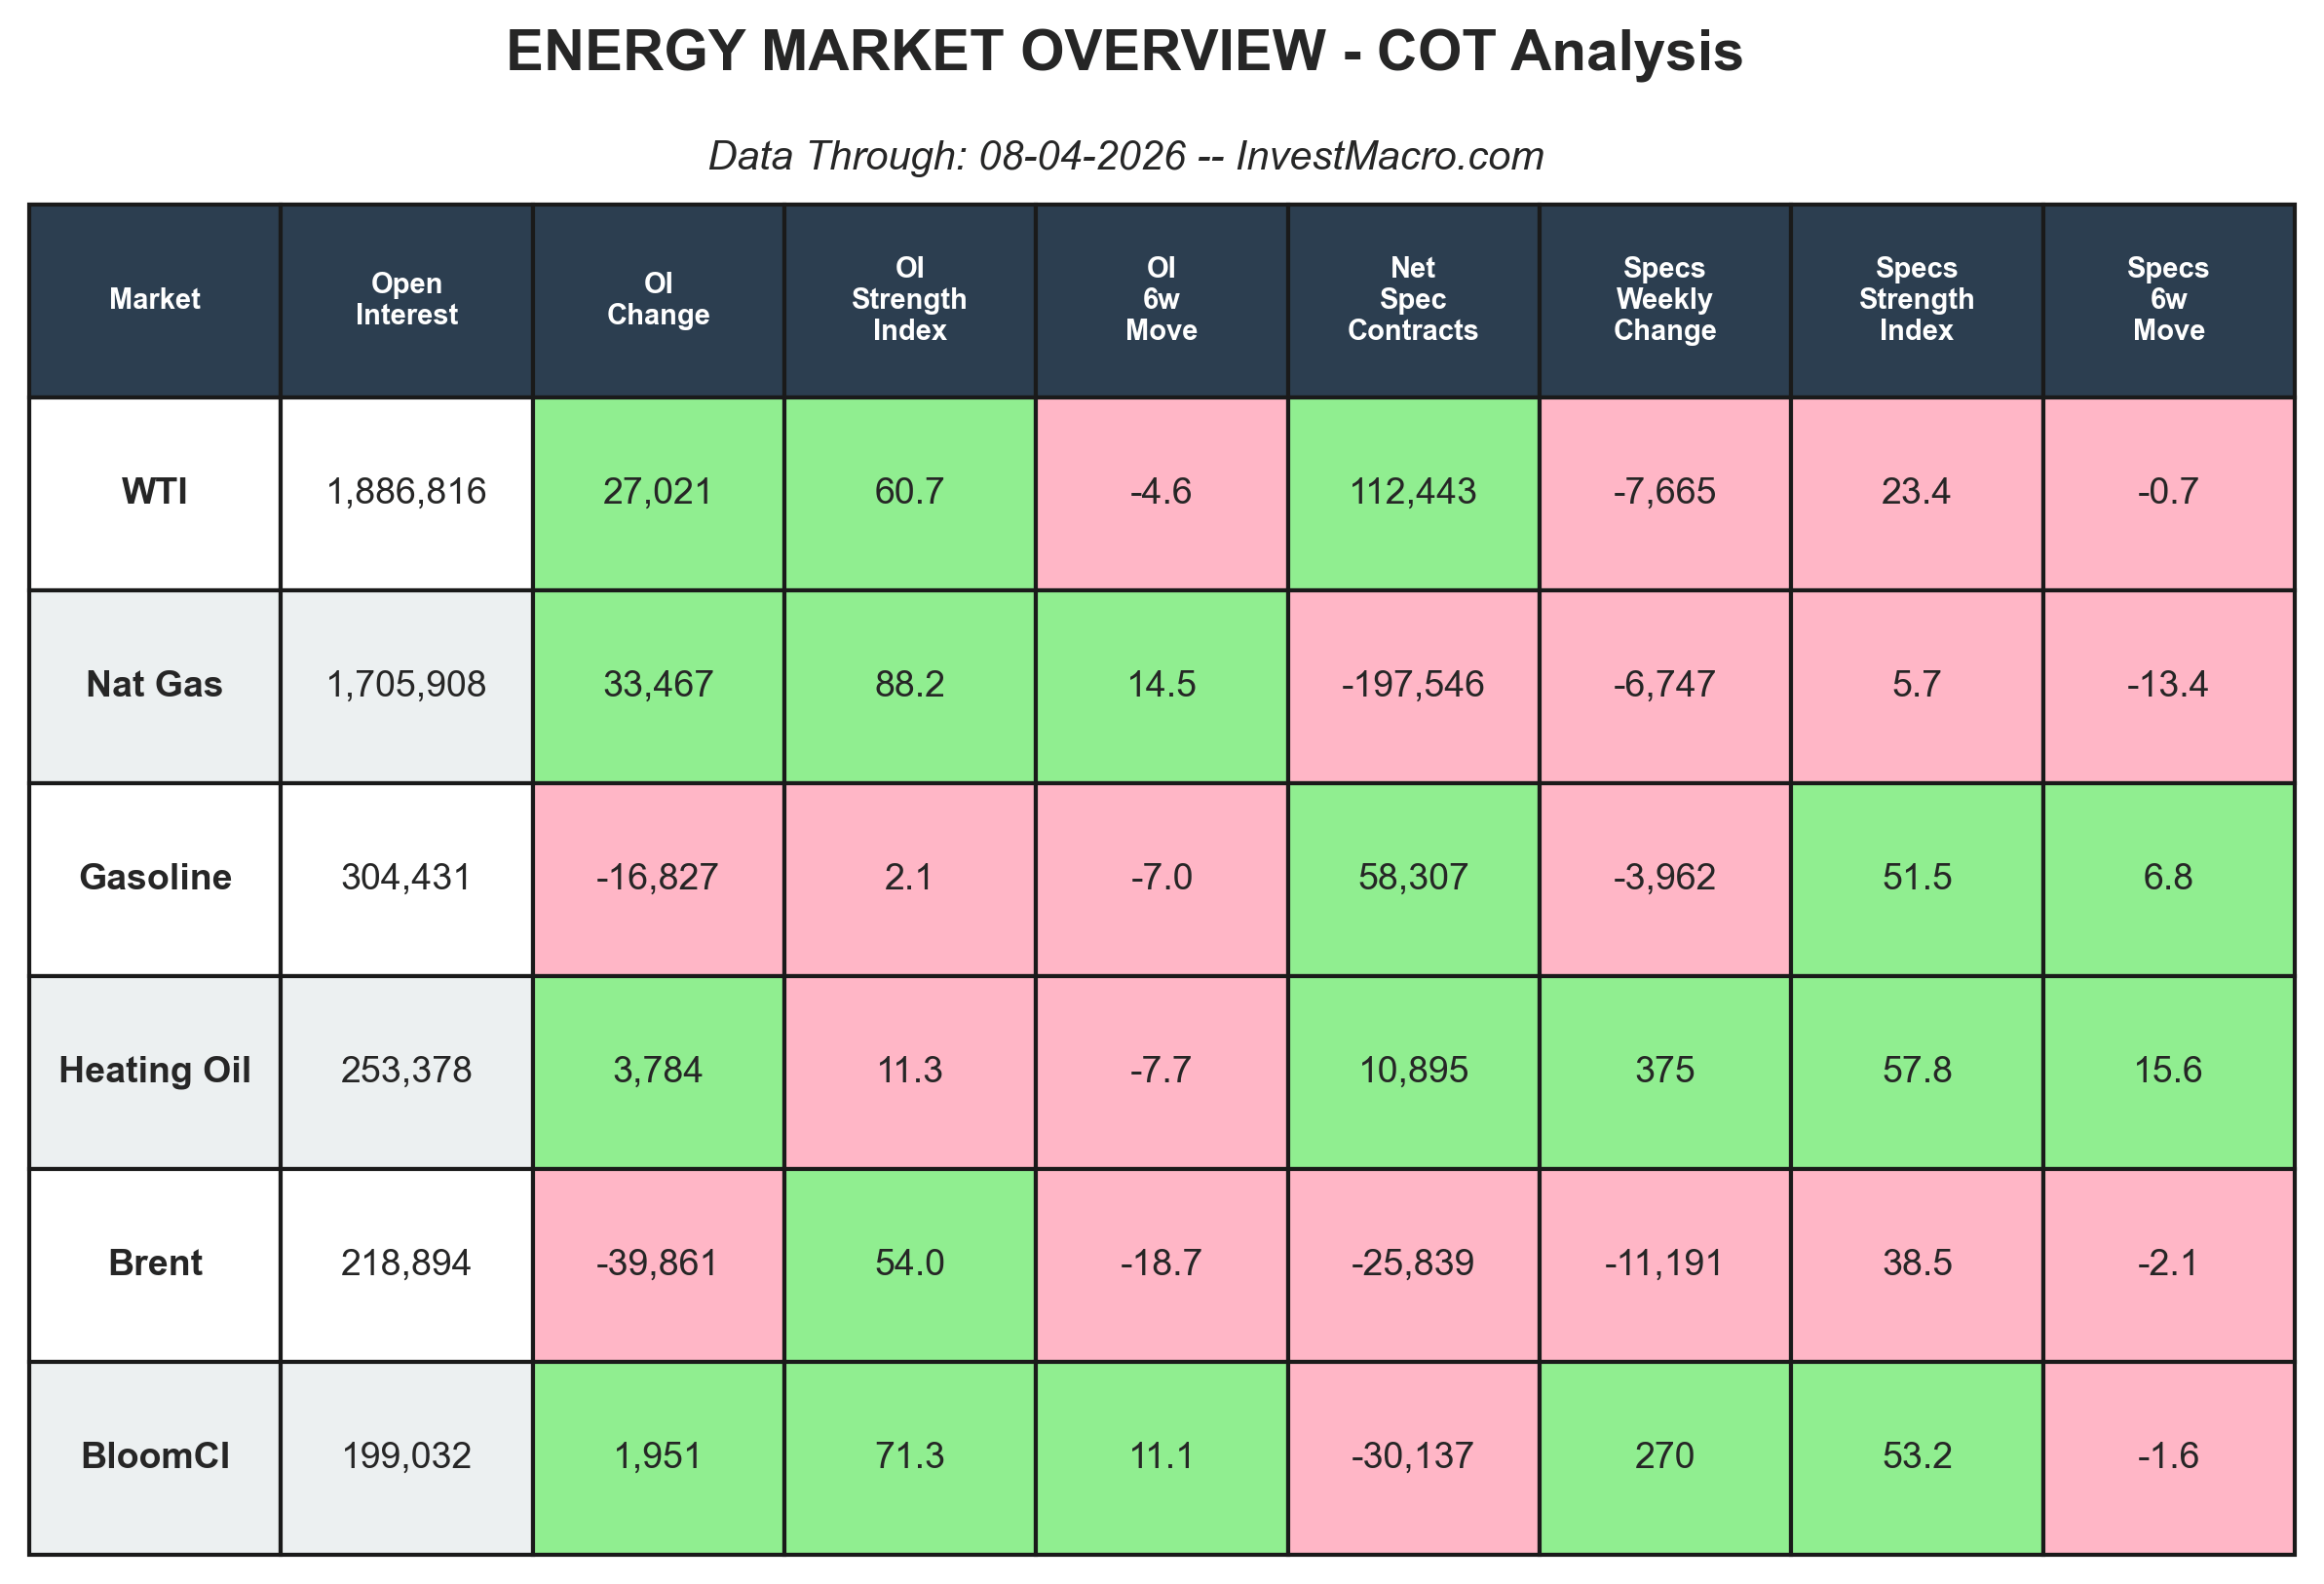
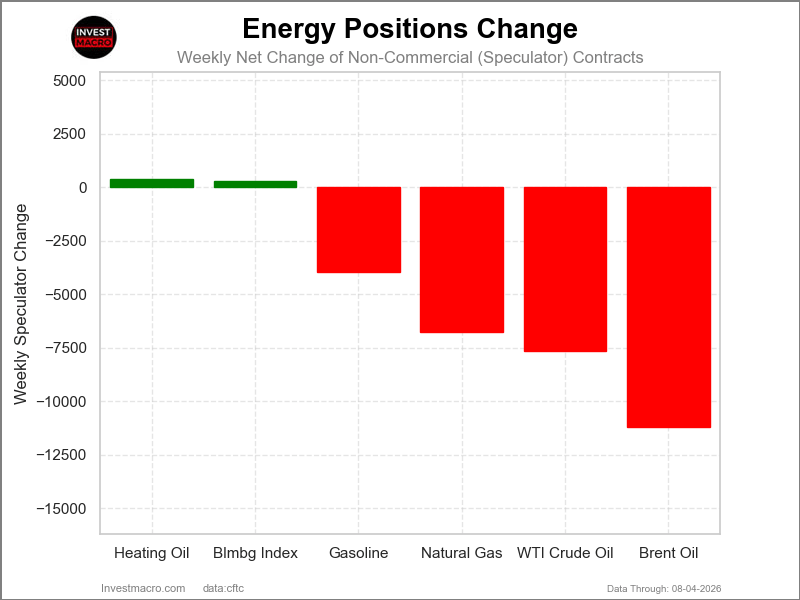
The COT energy market speculator bets were overall lower this week as two out of the six energy markets we cover had higher positioning while the other four markets had lower speculator contracts.
Free Reports:
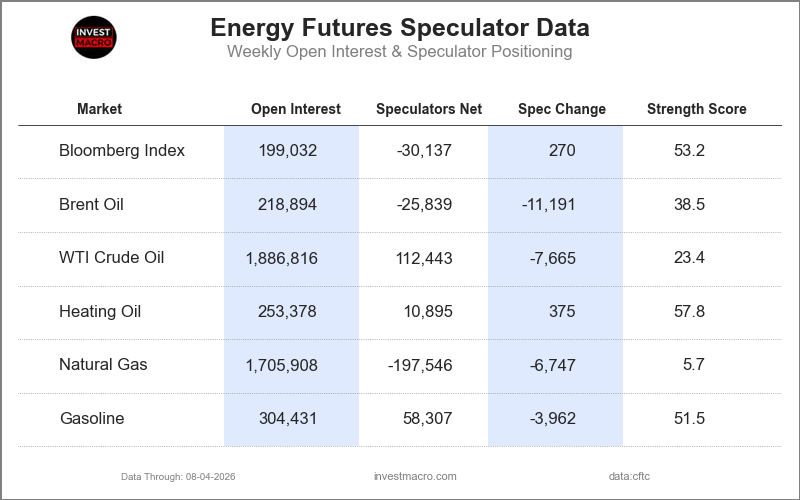
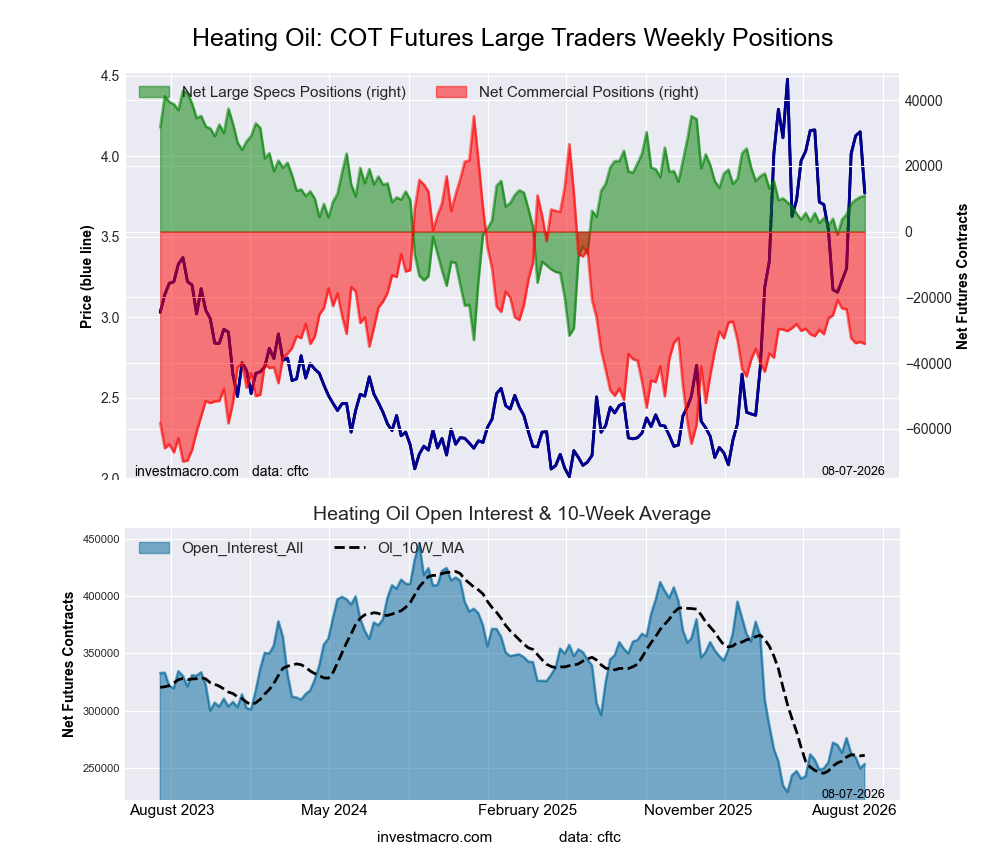
Leading the gains for the energy markets was Heating Oil (375 contracts) with the Bloomberg Index (270 contracts) also seeing a small positive week.
The markets with declines in speculator bets for the week were Brent Oil (-11,191 contracts), WTI Crude (-7,665 contracts), Natural Gas (-6,747 contracts) and with Gasoline (-3,962 contracts) also having lower bets on the week.
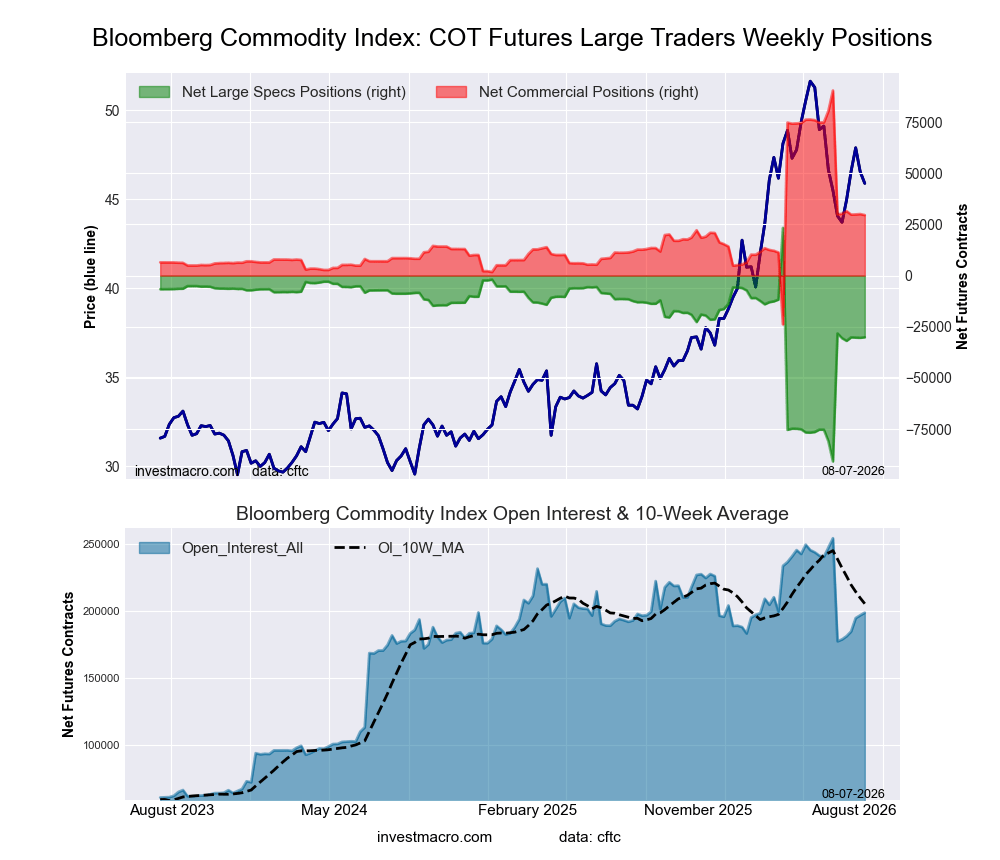
The price performances for the Energy markets this week showed lower across-the-board returns. The Bloomberg Commodity Index had the smallest decrease this week with a -0.76% decline. Natural Gas was down by -3.09%, followed by Brent Oil, which dipped by -4.98% on the week.
Heating Oil decreased by -7.43% and was followed by WTI Crude Oil, which was lower by -9.93%.
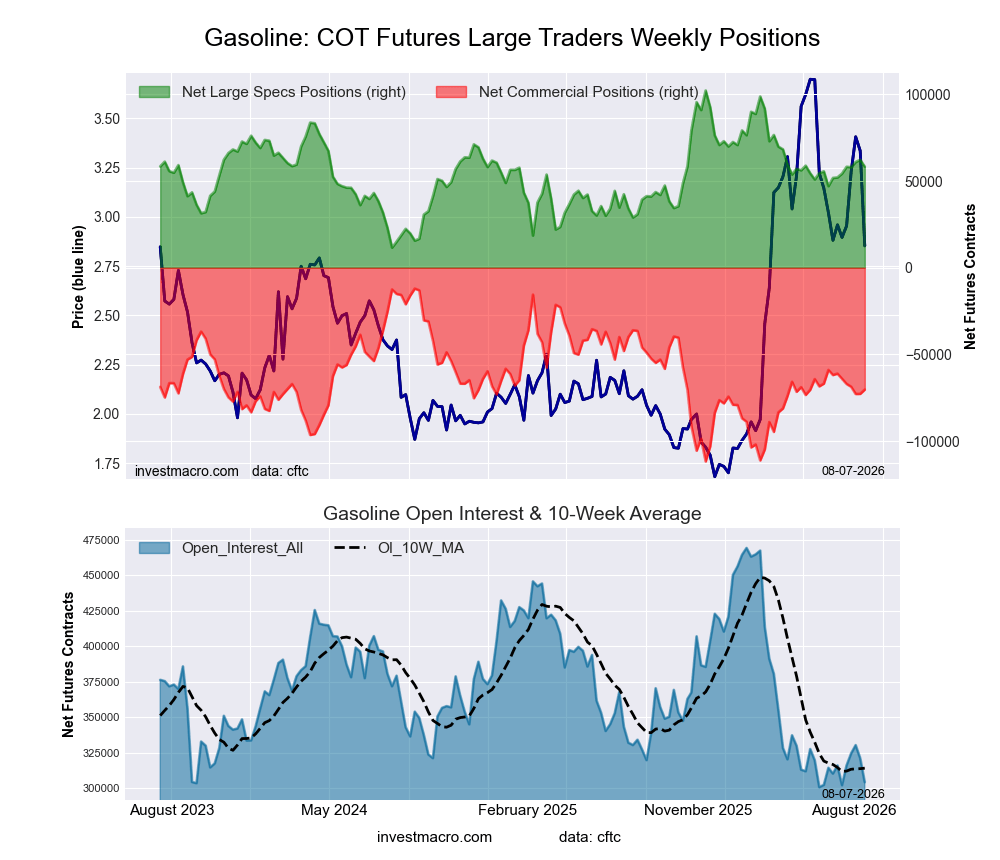
Leading the declines this week was Gasoline, which fell by -14.40% over the past five days.
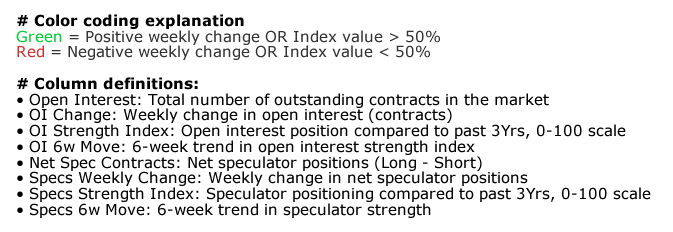
Legend: Weekly Speculators Change | Speculators Current Net Position | Speculators Strength Score compared to last 3-Years (0-100 range)
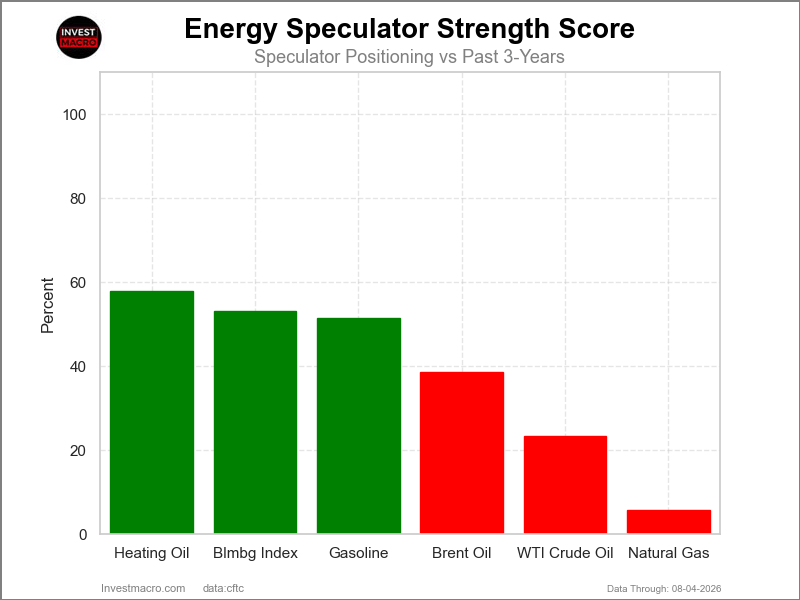
COT Strength Scores (a normalized measure of Speculator positions over a 3-Year range, from 0 to 100 where above 80 is Extreme-Bullish and below 20 is Extreme-Bearish) showed that Heating Oil (57.8 percent) and Bloomberg Index (53.2 percent) lead the energy markets this week.
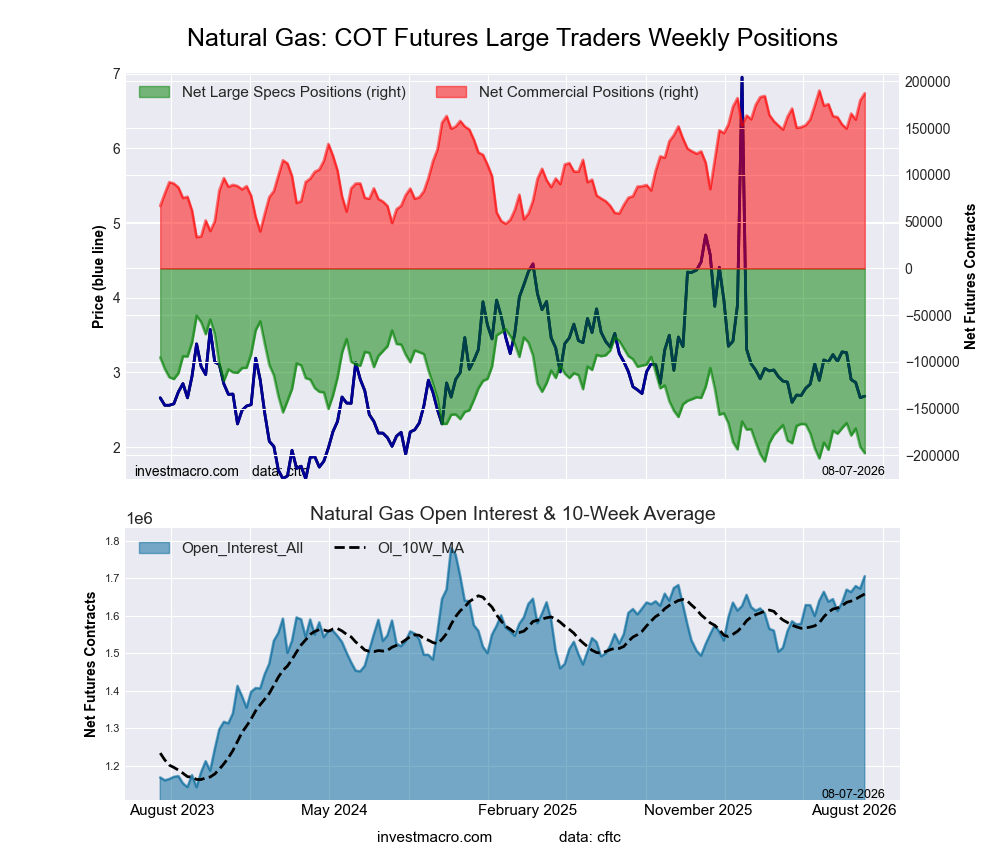
On the downside, Natural Gas (5.7 percent) comes in at the lowest strength level currently and is in Extreme-Bearish territory (below 20 percent). The next lowest strength score was WTI Crude (23.4 percent).
Strength Statistics:
WTI Crude Oil (23.4 percent) vs WTI Crude Oil previous week (25.9 percent)
Brent Crude Oil (38.5 percent) vs Brent Crude Oil previous week (56.1 percent)
Natural Gas (5.7 percent) vs Natural Gas previous week (10.0 percent)
Gasoline (51.5 percent) vs Gasoline previous week (55.9 percent)
Heating Oil (57.8 percent) vs Heating Oil previous week (57.3 percent)
Bloomberg Commodity Index (53.2 percent) vs Bloomberg Commodity Index previous week (52.9 percent)
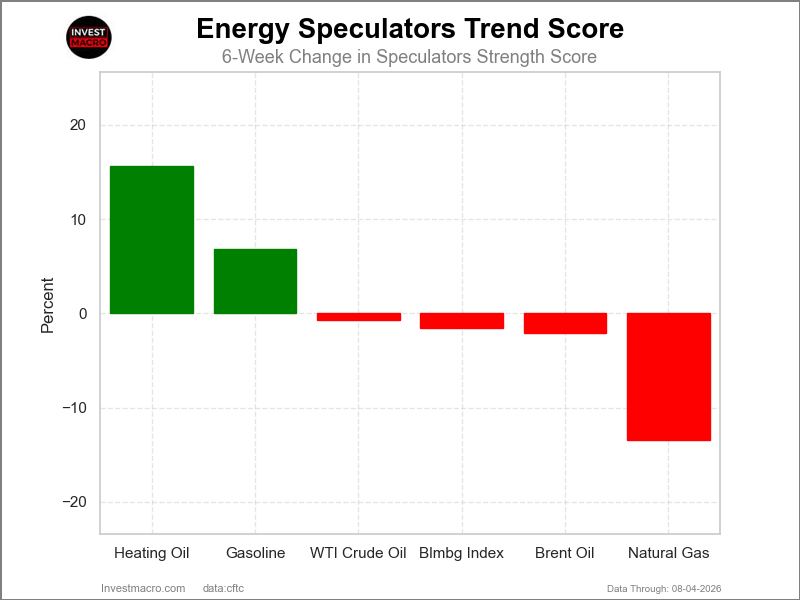
COT Strength Score Trends (or move index, calculates the 6-week changes in strength scores) showed that Heating Oil (15.6 percent) and Gasoline (6.8 percent) lead the past six weeks trends for the energy markets.
Natural Gas (-13.4 percent) leads the downside trend scores currently with Brent Oil (-2.1 percent) as the next market with lower trend scores.
Move Statistics:
WTI Crude Oil (-0.7 percent) vs WTI Crude Oil previous week (-1.4 percent)
Brent Crude Oil (-2.1 percent) vs Brent Crude Oil previous week (-3.7 percent)
Natural Gas (-13.4 percent) vs Natural Gas previous week (-11.1 percent)
Gasoline (6.8 percent) vs Gasoline previous week (11.6 percent)
Heating Oil (15.6 percent) vs Heating Oil previous week (8.7 percent)
Bloomberg Commodity Index (-1.6 percent) vs Bloomberg Commodity Index previous week (52.9 percent)
Our weekly trend-following model classifies the current market price position as: Downtrend.
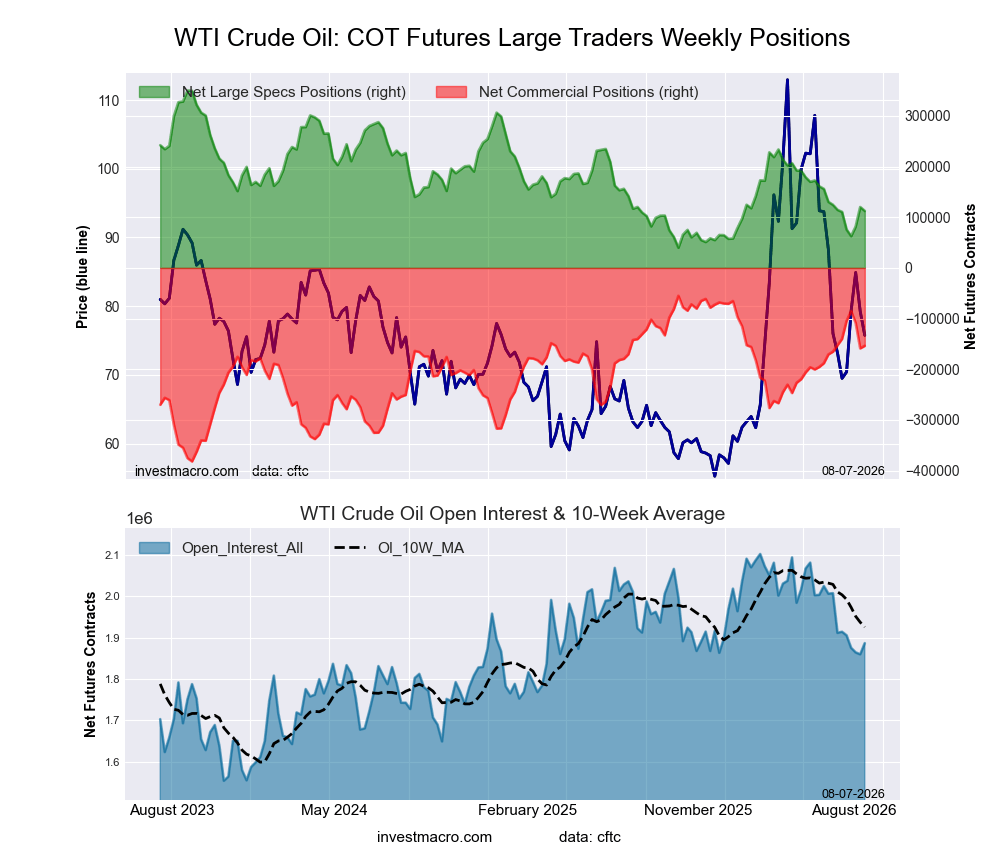
| WTI Crude Oil Futures Statistics | SPECULATORS | COMMERCIALS | SMALL TRADERS |
| – Percent of Open Interest Longs: | 16.4 | 47.0 | 4.3 |
| – Percent of Open Interest Shorts: | 10.4 | 55.2 | 2.1 |
| – Net Position: | 112,443 | -153,775 | 41,332 |
| – Gross Longs: | 308,841 | 887,525 | 80,311 |
| – Gross Shorts: | 196,398 | 1,041,300 | 38,979 |
| – Long to Short Ratio: | 1.6 to 1 | 0.9 to 1 | 2.1 to 1 |
| NET POSITION TREND: | |||
| – Strength Index Score (3 Year Range Pct): | 23.4 | 69.8 | 82.5 |
| – Strength Index Reading (3 Year Range): | Bearish | Bullish | Bullish-Extreme |
| NET POSITION MOVEMENT INDEX: | |||
| – 6-Week Change in Strength Index: | -0.7 | -0.4 | 6.6 |
Our weekly trend-following model classifies the current market price position as: Downtrend.
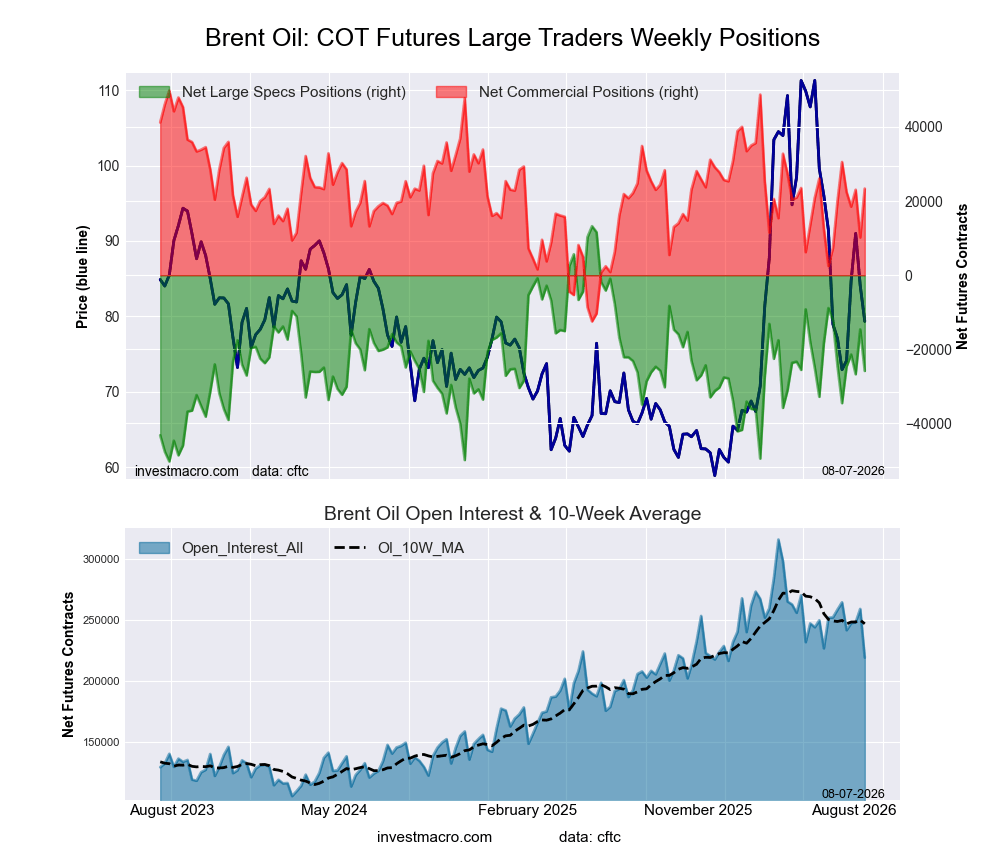
| Brent Crude Oil Futures Statistics | SPECULATORS | COMMERCIALS | SMALL TRADERS |
| – Percent of Open Interest Longs: | 18.5 | 35.0 | 4.4 |
| – Percent of Open Interest Shorts: | 30.3 | 24.3 | 3.2 |
| – Net Position: | -25,839 | 23,363 | 2,476 |
| – Gross Longs: | 40,459 | 76,638 | 9,534 |
| – Gross Shorts: | 66,298 | 53,275 | 7,058 |
| – Long to Short Ratio: | 0.6 to 1 | 1.4 to 1 | 1.4 to 1 |
| NET POSITION TREND: | |||
| – Strength Index Score (3 Year Range Pct): | 38.5 | 57.5 | 56.2 |
| – Strength Index Reading (3 Year Range): | Bearish | Bullish | Bullish |
| NET POSITION MOVEMENT INDEX: | |||
| – 6-Week Change in Strength Index: | -2.1 | 5.5 | -21.3 |
Our weekly trend-following model classifies the current market price position as: Weak Downtrend.
| Natural Gas Futures Statistics | SPECULATORS | COMMERCIALS | SMALL TRADERS |
| – Percent of Open Interest Longs: | 16.9 | 32.9 | 3.2 |
| – Percent of Open Interest Shorts: | 28.5 | 21.9 | 2.6 |
| – Net Position: | -197,546 | 187,214 | 10,332 |
| – Gross Longs: | 287,918 | 560,488 | 54,374 |
| – Gross Shorts: | 485,464 | 373,274 | 44,042 |
| – Long to Short Ratio: | 0.6 to 1 | 1.5 to 1 | 1.2 to 1 |
| NET POSITION TREND: | |||
| – Strength Index Score (3 Year Range Pct): | 5.7 | 98.1 | 29.2 |
| – Strength Index Reading (3 Year Range): | Bearish-Extreme | Bullish-Extreme | Bearish |
| NET POSITION MOVEMENT INDEX: | |||
| – 6-Week Change in Strength Index: | -13.4 | 16.2 | -11.6 |
Our weekly trend-following model classifies the current market price position as: Strong Downtrend.
| Nasdaq Mini Futures Statistics | SPECULATORS | COMMERCIALS | SMALL TRADERS |
| – Percent of Open Interest Longs: | 31.0 | 37.2 | 8.3 |
| – Percent of Open Interest Shorts: | 11.8 | 60.3 | 4.4 |
| – Net Position: | 58,307 | -70,299 | 11,992 |
| – Gross Longs: | 94,331 | 113,289 | 25,242 |
| – Gross Shorts: | 36,024 | 183,588 | 13,250 |
| – Long to Short Ratio: | 2.6 to 1 | 0.6 to 1 | 1.9 to 1 |
| NET POSITION TREND: | |||
| – Strength Index Score (3 Year Range Pct): | 51.5 | 41.6 | 72.2 |
| – Strength Index Reading (3 Year Range): | Bullish | Bearish | Bullish |
| NET POSITION MOVEMENT INDEX: | |||
| – 6-Week Change in Strength Index: | 6.8 | -9.2 | 13.7 |
Our weekly trend-following model classifies the current market price position as: Weak Downtrend.
| Heating Oil Futures Statistics | SPECULATORS | COMMERCIALS | SMALL TRADERS |
| – Percent of Open Interest Longs: | 17.9 | 41.1 | 19.9 |
| – Percent of Open Interest Shorts: | 13.6 | 54.5 | 10.7 |
| – Net Position: | 10,895 | -34,152 | 23,257 |
| – Gross Longs: | 45,343 | 104,057 | 50,391 |
| – Gross Shorts: | 34,448 | 138,209 | 27,134 |
| – Long to Short Ratio: | 1.3 to 1 | 0.8 to 1 | 1.9 to 1 |
| NET POSITION TREND: | |||
| – Strength Index Score (3 Year Range Pct): | 57.8 | 34.0 | 81.7 |
| – Strength Index Reading (3 Year Range): | Bullish | Bearish | Bullish-Extreme |
| NET POSITION MOVEMENT INDEX: | |||
| – 6-Week Change in Strength Index: | 15.6 | -12.7 | 4.2 |
Our weekly trend-following model classifies the current market price position as: Downtrend.
| Bloomberg Index Futures Statistics | SPECULATORS | COMMERCIALS | SMALL TRADERS |
| – Percent of Open Interest Longs: | 53.3 | 45.2 | 0.3 |
| – Percent of Open Interest Shorts: | 68.4 | 30.4 | 0.0 |
| – Net Position: | -30,137 | 29,554 | 583 |
| – Gross Longs: | 106,022 | 90,041 | 614 |
| – Gross Shorts: | 136,159 | 60,487 | 31 |
| – Long to Short Ratio: | 0.8 to 1 | 1.5 to 1 | 19.8 to 1 |
| NET POSITION TREND: | |||
| – Strength Index Score (3 Year Range Pct): | 53.2 | 46.7 | 85.1 |
| – Strength Index Reading (3 Year Range): | Bullish | Bearish | Bullish-Extreme |
| NET POSITION MOVEMENT INDEX: | |||
| – 6-Week Change in Strength Index: | -1.6 | -0.3 | 85.1 |
Article By InvestMacro – Receive our weekly COT Newsletter
*COT Report: The COT data, released weekly to the public each Friday, is updated through the most recent Tuesday (data is 3 days old) and shows a quick view of how large speculators or non-commercials (for-profit traders) were positioned in the futures markets.
The CFTC categorizes trader positions according to commercial hedgers (traders who use futures contracts for hedging as part of the business), non-commercials (large traders who speculate to realize trading profits) and nonreportable traders (usually small traders/speculators) as well as their open interest (contracts open in the market at time of reporting). See CFTC criteria here.
By InvestMacro The latest update for the weekly Commitment of Traders (COT) report was released…
By InvestMacro Here are the latest charts and statistics for the Commitment of Traders (COT)…
By InvestMacro Here are the latest charts and statistics for the Commitment of Traders (COT)…
By InvestMacro Here are the latest charts and statistics for the Commitment of Traders (COT)…
By JustMarkets On Thursday, US stock indices ended the session lower, as a sharp spike…
By Analytical Department RoboForex USD/JPY stood at 158.39 on Friday, with the Japanese yen giving…
This website uses cookies.