By InvestMacro
The latest update for the weekly Commitment of Traders (COT) report was released by the Commodity Futures Trading Commission (CFTC) on Friday for data ending on Tuesday July 14th.
This weekly Extreme Positions report highlights the Most Bullish and Most Bearish Positions for the speculator category and is a current snapshot of how speculators were positioned as of Tuesday. Extreme positioning in these markets can foreshadow strong moves in the underlying market.
To signify an extreme position, we use the Strength Index (also known as the COT Index) of each instrument, a common method of measuring COT data. The Strength Index is simply a comparison of current trader positions against the range of positions over the previous 3 years. We use over 80 percent as extremely bullish and under 20 percent as extremely bearish (Compare Strength Index scores across all markets in the data table or cot leaders table).
The 6-WK Trend score is the change in the Strength Index over the past 6 weeks and signals how strong and which way the Strength Index is going.
Free Reports:
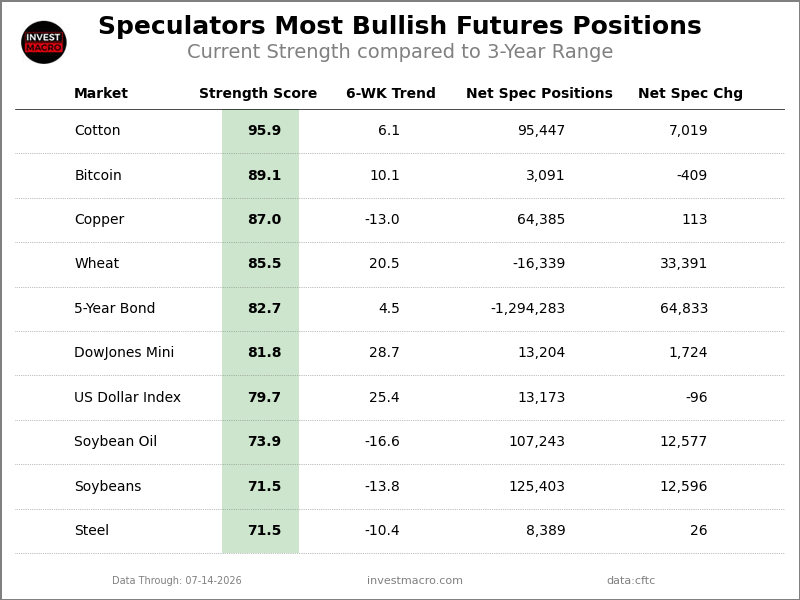
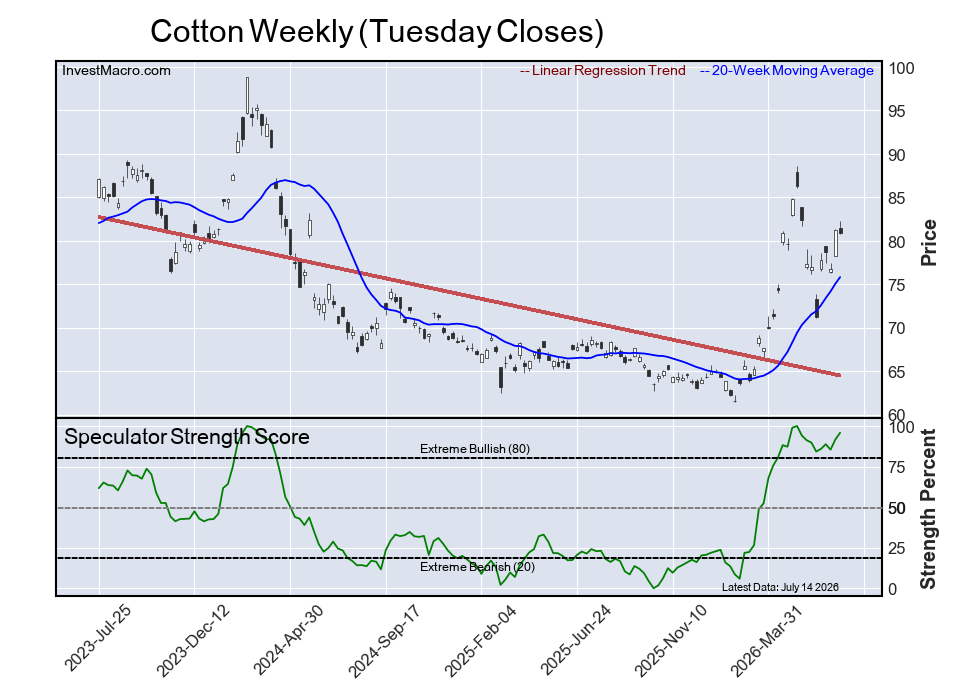
The Cotton speculator position comes in as the most bullish extreme standing this week as the Cotton speculator level is currently at a 96 percent score of its 3-year range.
The six-week trend for the percent strength score totaled a boost of 6 percentage points this week while the overall net speculator position was a total of 95,447 net contracts this week with a rise of 7,019 contract in the weekly speculator bets.
Speculators or Non-Commercials Notes:
Speculators, classified as non-commercial traders by the CFTC, are made up of large commodity funds, hedge funds and other significant for-profit participants. The Specs are generally regarded as trend-followers in their behavior towards price action – net speculator bets and prices tend to go in the same directions. These traders often look to buy when prices are rising and sell when prices are falling. To illustrate this point, many times speculator contracts can be found at their most extremes (bullish or bearish) when prices are also close to their highest or lowest levels.
These extreme levels can be dangerous for the large speculators as the trade is most crowded, there is less trading ammunition still sitting on the sidelines to push the trend further and prices have moved a significant distance. When the trend becomes exhausted, some speculators take profits while others look to also exit positions when prices fail to continue in the same direction. This process usually plays out over many months to years and can ultimately create a reverse effect where prices start to fall and speculators start a process of selling when prices are falling.
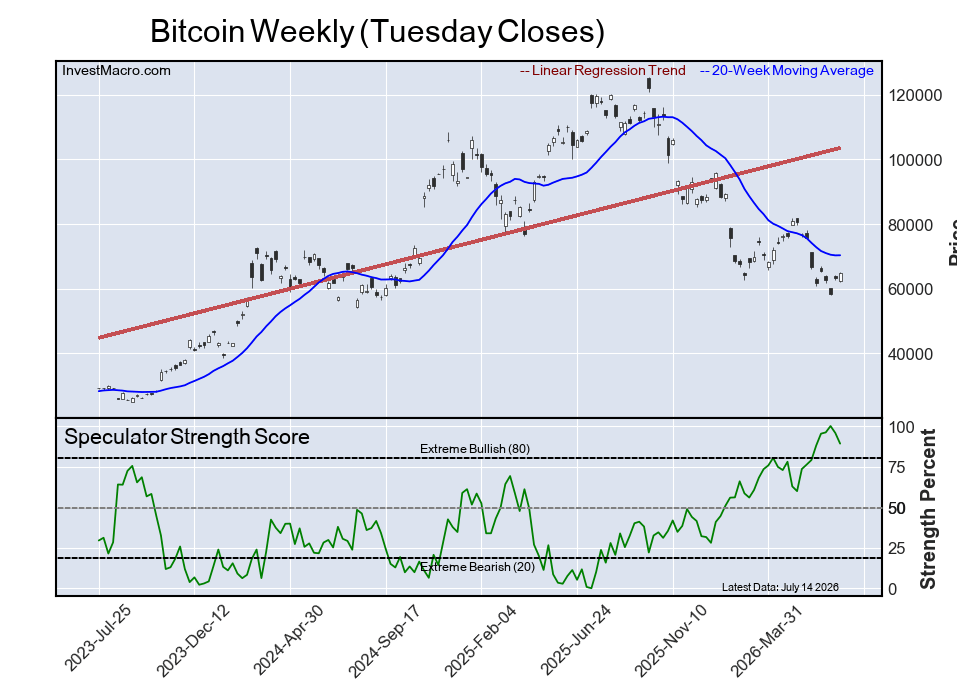
The Bitcoin speculator position comes next in the extreme standings this week. The Bitcoin speculator level is now at a 89 percent score of its 3-year range.
The six-week trend for the percent strength score was an advance by 10 percentage points this week and the speculator position registered 3,091 net contracts this week with a reduction of -409 contracts in speculator bets.
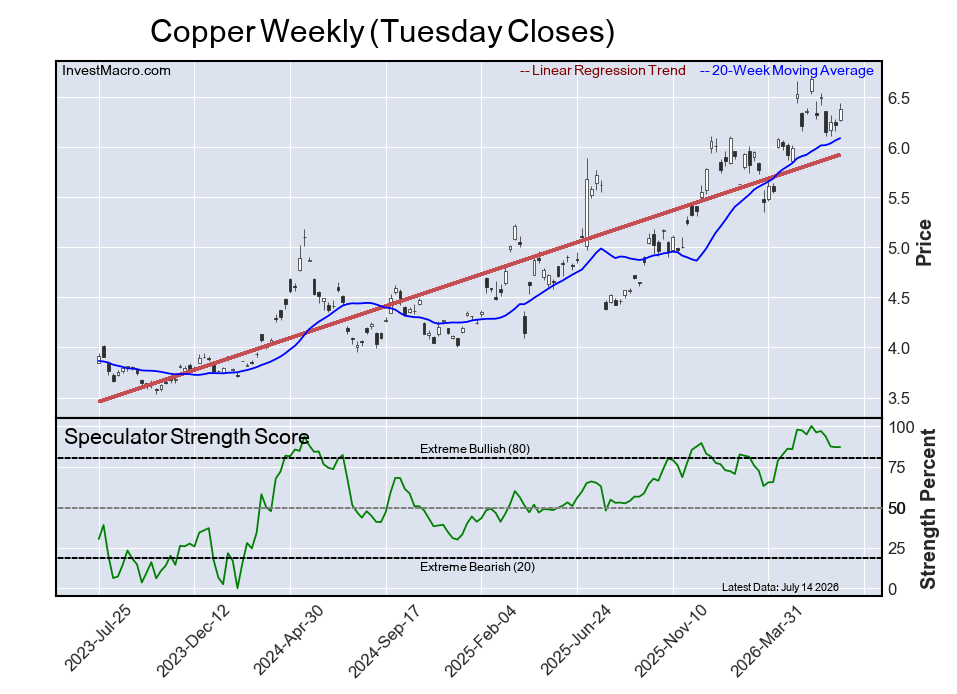
The Copper speculator position comes in third this week in the extreme standings with the Copper speculator level residing at an 87 percent score of its 3-year range.
The six-week trend for the speculator strength score came in at a reduction of -13 percentage points this week. The overall speculator position was 64,385 net contracts this week with an addition of 113 contracts in the weekly speculator bets.
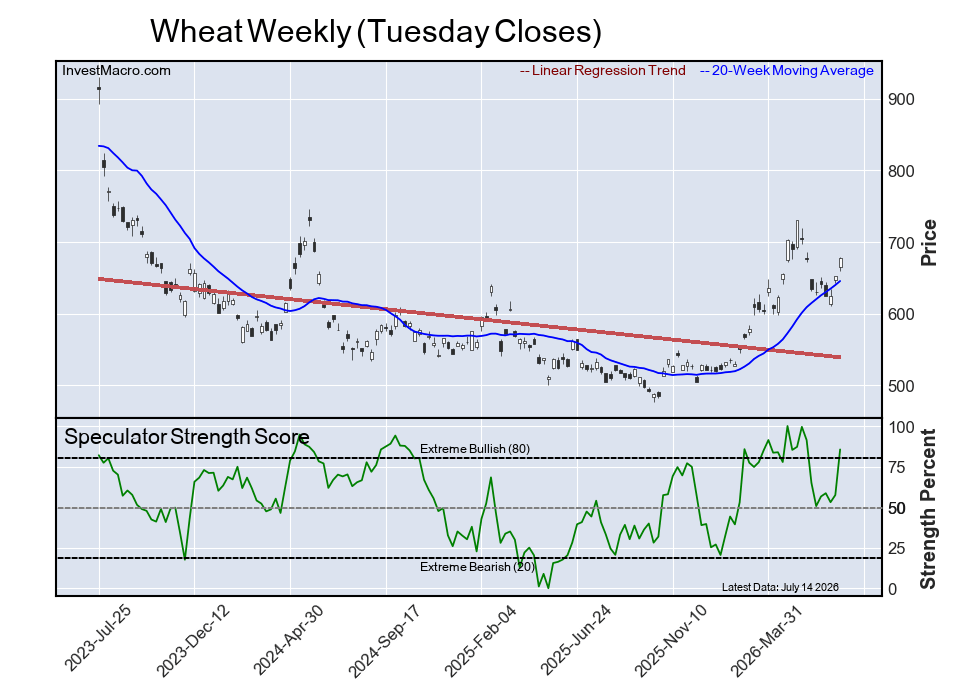
The Wheat speculator position comes up number four in the extreme standings this week as the Wheat speculator level is at an 86 percent score of its 3-year range.
The six-week trend for the speculator strength score totaled an advance by 21 percentage points this week while the overall speculator position was -16,339 net contracts this week with a rise of 33,391 contracts in the speculator bets.
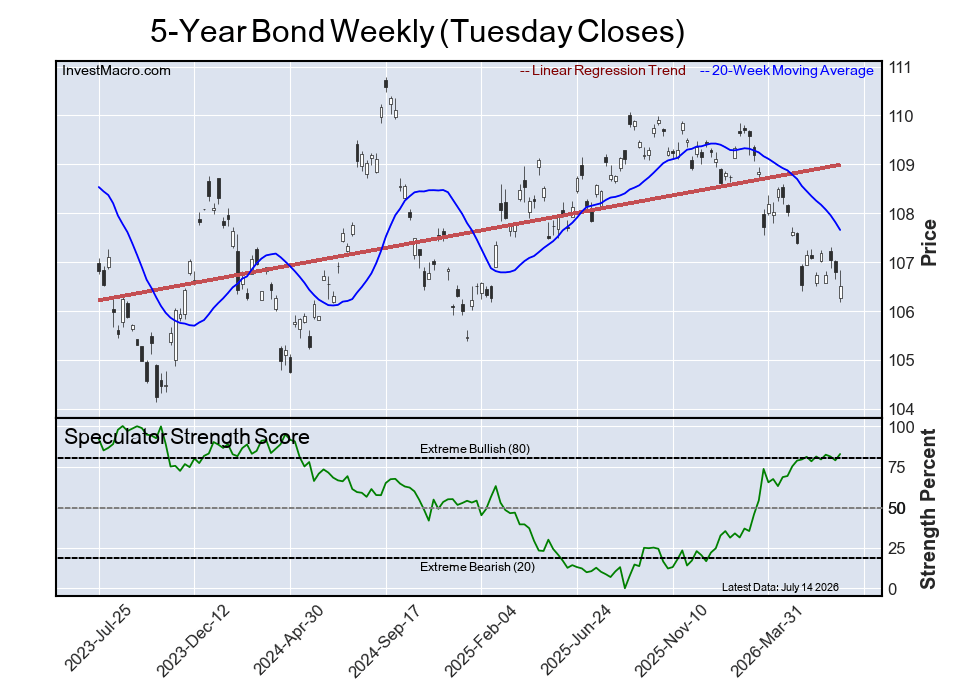
The 5-Year Bond speculator position rounds out the top five in this week’s bullish extreme standings as the 5-Year speculator level sits at an 83 percent score of its 3-year range.
The six-week trend for the speculator strength score was a lift of 4 percentage points this week while the speculator position was -1,294,283 net contracts this week with a boost of 64,833 contracts in the weekly speculator bets.
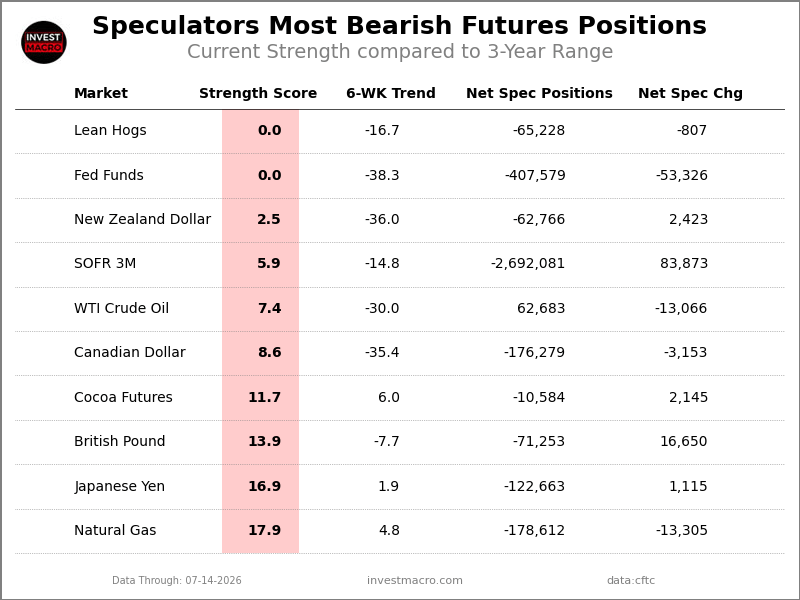
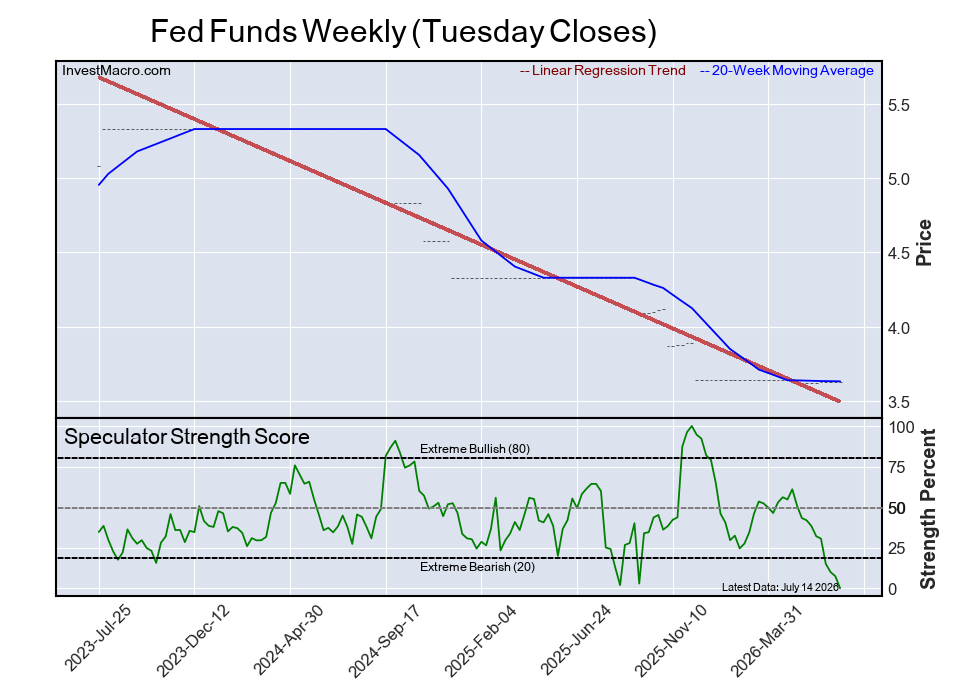
The Fed Funds speculator position comes in tied as the most bearish extreme standing this week with a FedFunds speculator level of 0 percent score of its 3-year range.
The six-week trend for the speculator strength score was a fall by -38 percentage points this week while the overall speculator position was -407,579 net contracts this week with a retreat of -53,326 contracts in the speculator bets.
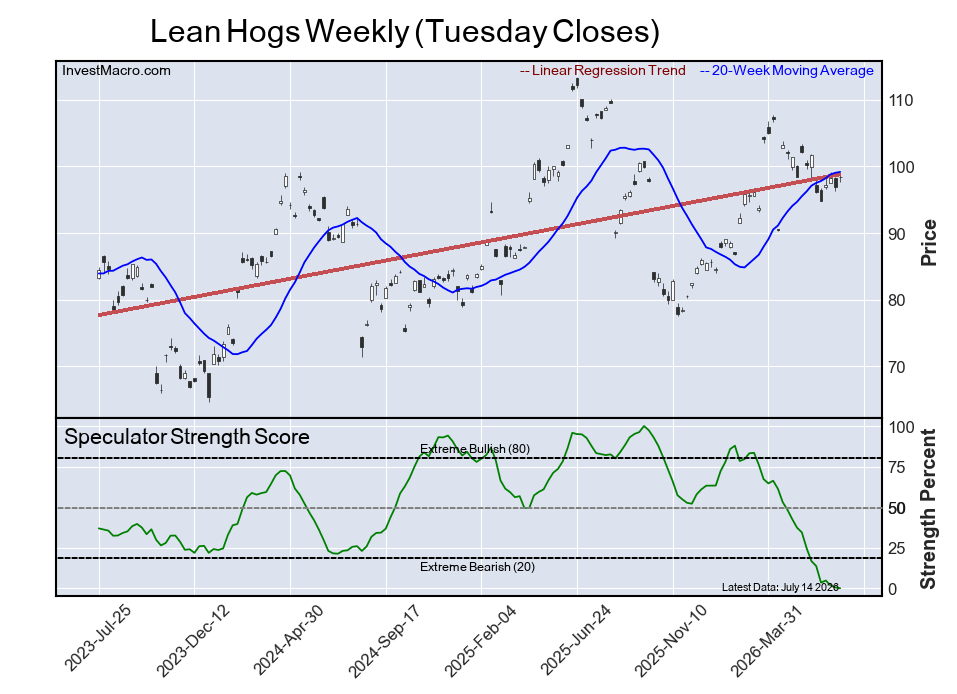
The Lean Hogs speculator position also comes in tied as the most bearish extreme standing on the week. The Lean Hogs speculator level is at a 0 percent score of its 3-year range.
The six-week trend for the speculator strength score was a retreat of -17 percentage points this week and the speculator position was -65,228 net contracts this week with a fall of -807 contracts in the weekly speculator bets.
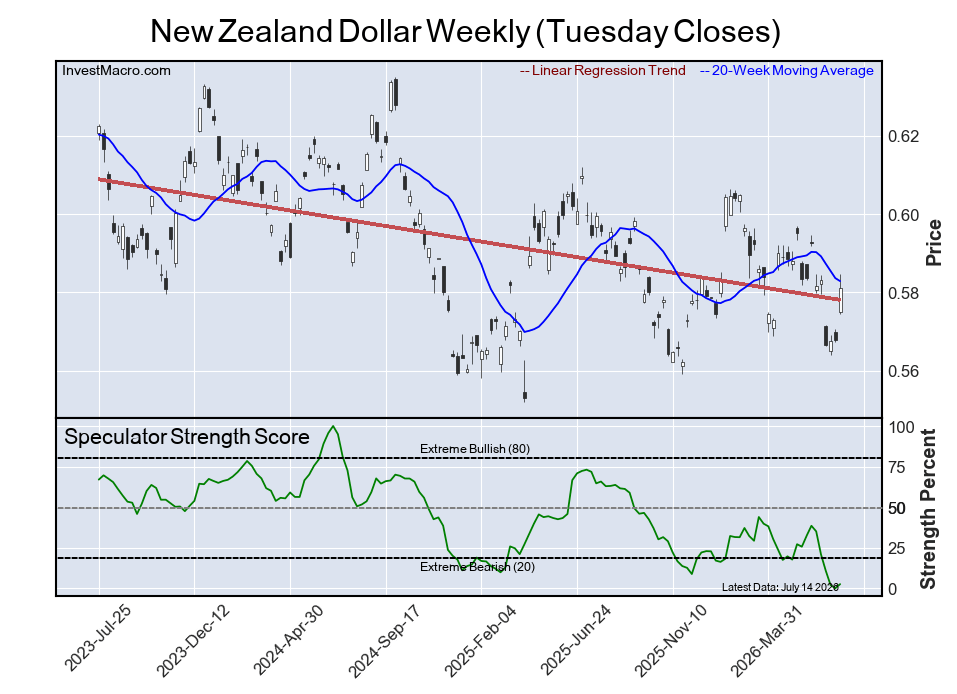
The New Zealand Dollar speculator position comes in as third most bearish extreme standing of the week as the NZD speculator level stands at a 3 percent score of its 3-year range.
The six-week trend for the speculator strength score was a decline of -36 percentage points this week. The overall speculator position was -62,766 net contracts this week with an increase of 2,423 contracts in the speculator bets.
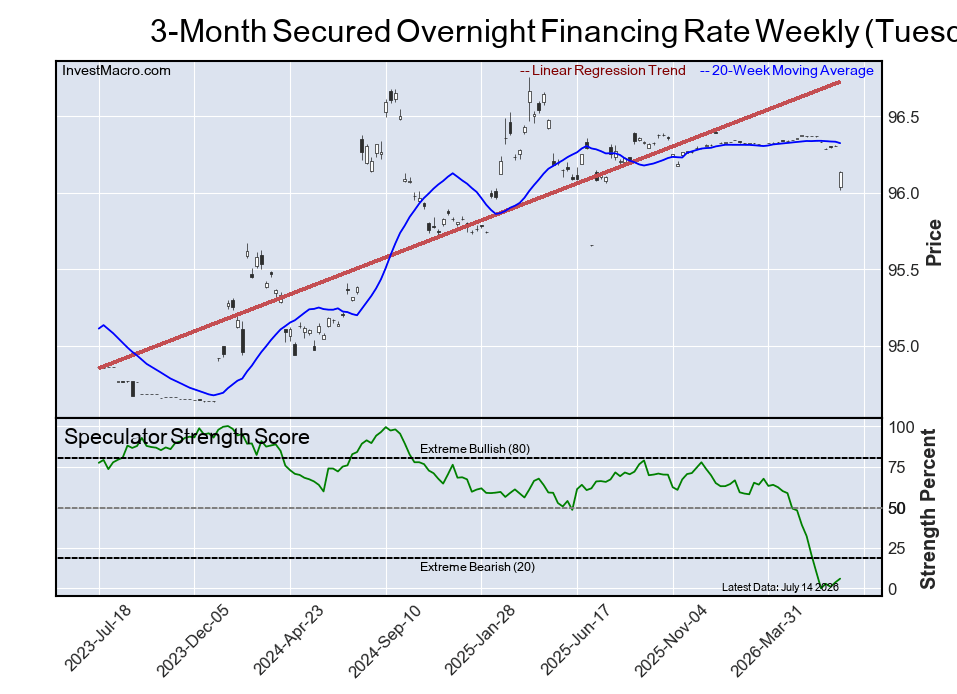
The 3-Month Secured Overnight Financing Rate speculator position comes in as this week’s fourth most bearish extreme standing with the SOFR 3-Months speculator level at a 6 percent score of its 3-year range.
The six-week trend for the speculator strength score was a decrease of -15 percentage points this week while the speculator position was -2,692,081 net contracts this week with a boost of 83,873 contracts in the weekly speculator bets.
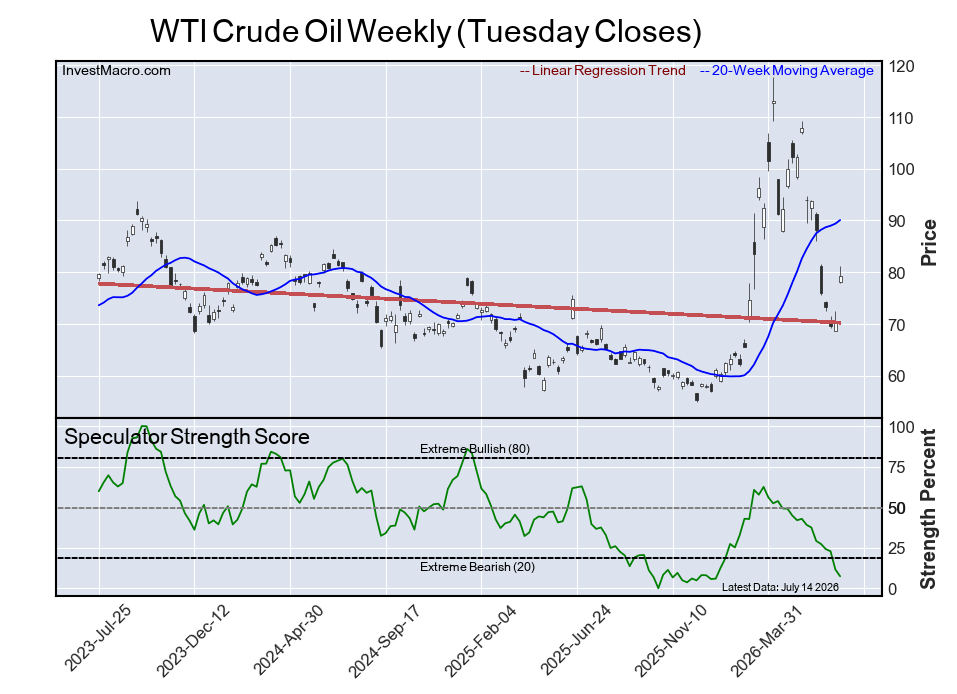
Finally, the WTI Crude Oil speculator position comes in as the fifth most bearish extreme standing for this week with the WTI Crude speculator level sitting at a 7 percent score of its 3-year range.
The six-week trend for the speculator strength score was a fall by -30 percentage points this week while the speculator position was 62,683 net contracts this week with a decrease of -13,066 contracts in the weekly speculator bets.
Article By InvestMacro – Receive our weekly COT Reports by Email
*COT Report: The COT data, released weekly to the public each Friday, is updated through the most recent Tuesday (data is 3 days old) and shows a quick view of how large speculators or non-commercials (for-profit traders) were positioned in the futures markets.
The CFTC categorizes trader positions according to commercial hedgers (traders who use futures contracts for hedging as part of the business), non-commercials (large traders who speculate to realize trading profits) and nonreportable traders (usually small traders/speculators) as well as their open interest (contracts open in the market at time of reporting).See CFTC criteria here.
All information and opinions on this website and contained in this article are for general informational purposes only and do not constitute investment advice.
By JustMarkets On Thursday, US stock indices ended the session lower, as a sharp spike…
By Analytical Department RoboForex USD/JPY stood at 158.39 on Friday, with the Japanese yen giving…
By Analytical Department RoboForex Gold rose to 4,300 USD per ounce on Thursday, marking its…
By JustMarkets On Wednesday, the US stock indices finished trading near historical highs amid strong…
Source: Adrian Day (8/5/26) Global Analyst Adrian Day looks at preliminary results from gold and…
By William Akoto, American University School of International Service Hackers tried to break into at…
This website uses cookies.