By InvestMacro
Here are the latest charts and statistics for the Commitment of Traders (COT) data published by the Commodities Futures Trading Commission (CFTC).
The latest COT data is updated through Tuesday August 4th and shows a quick view of how large market participants (for-profit speculators and commercial traders) were positioned in the futures markets. All currency positions are in direct relation to the US dollar where, for example, a bet for the euro is a bet that the euro will rise versus the dollar while a bet against the euro will be a bet that the euro will decline versus the dollar.
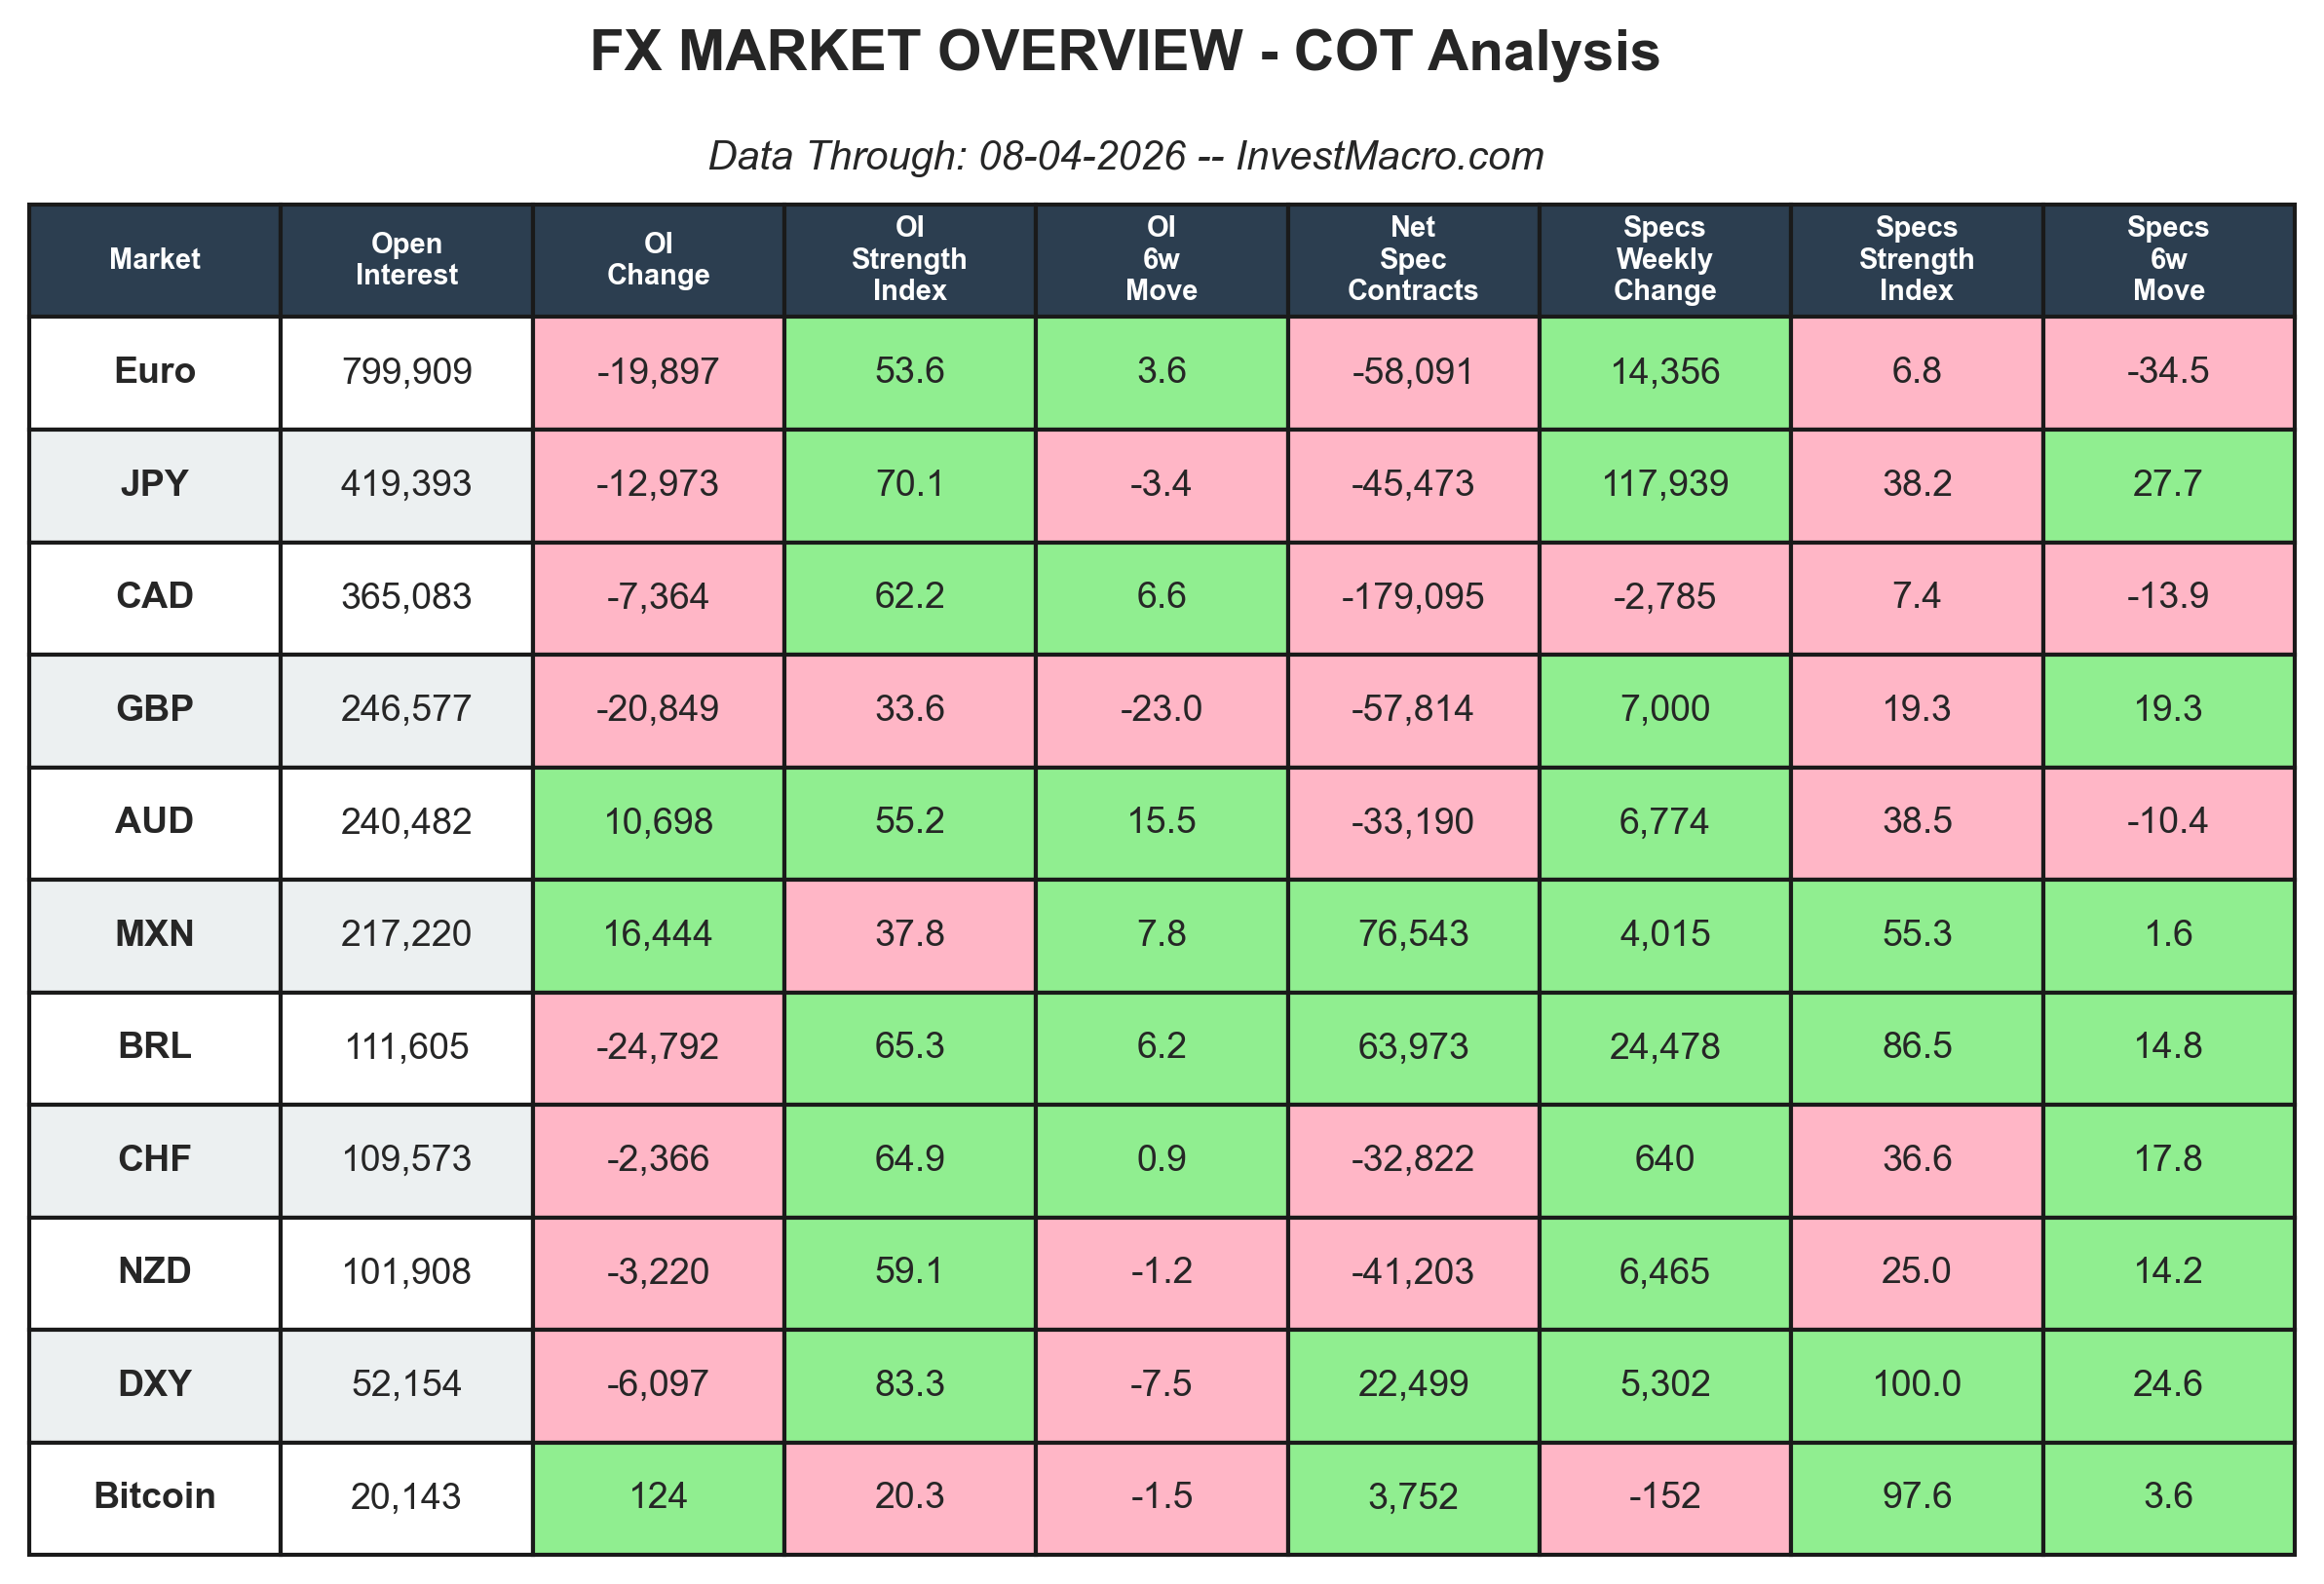
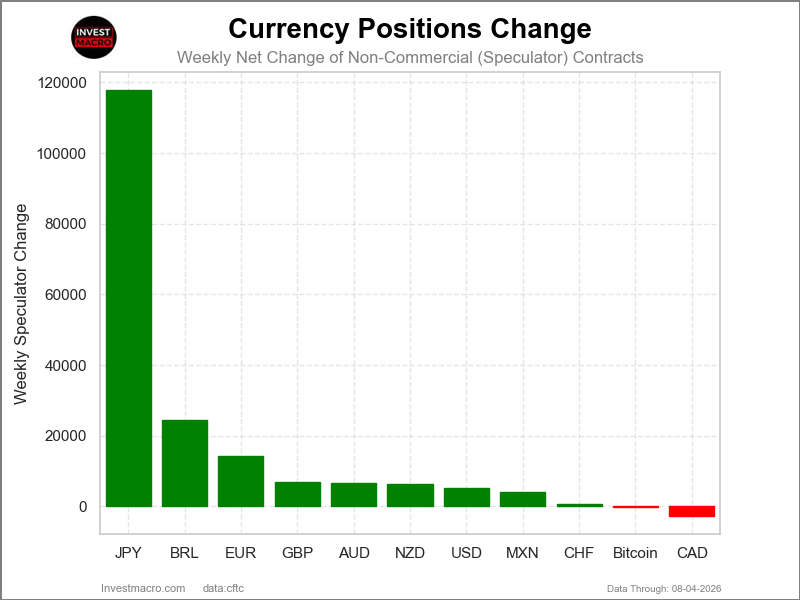
The COT currency market speculator bets were overall higher this week as nine out of the eleven currency markets we cover had higher positioning while the other two markets had lower speculator contracts.
Leading the gains for the currency markets was the Japanese Yen (117,939 contracts) with the Brazilian Real (24,478 contracts), EuroFX (14,356 contracts), British Pound (7,000 contracts), Australian Dollar (6,774 contracts) and the New Zealand Dollar (6,465 contracts), the US Dollar Index (5,302 contracts), the Mexican Peso (4,015 contracts) and with the Swiss Franc (640 contracts) also showing positive weeks.
Free Reports:
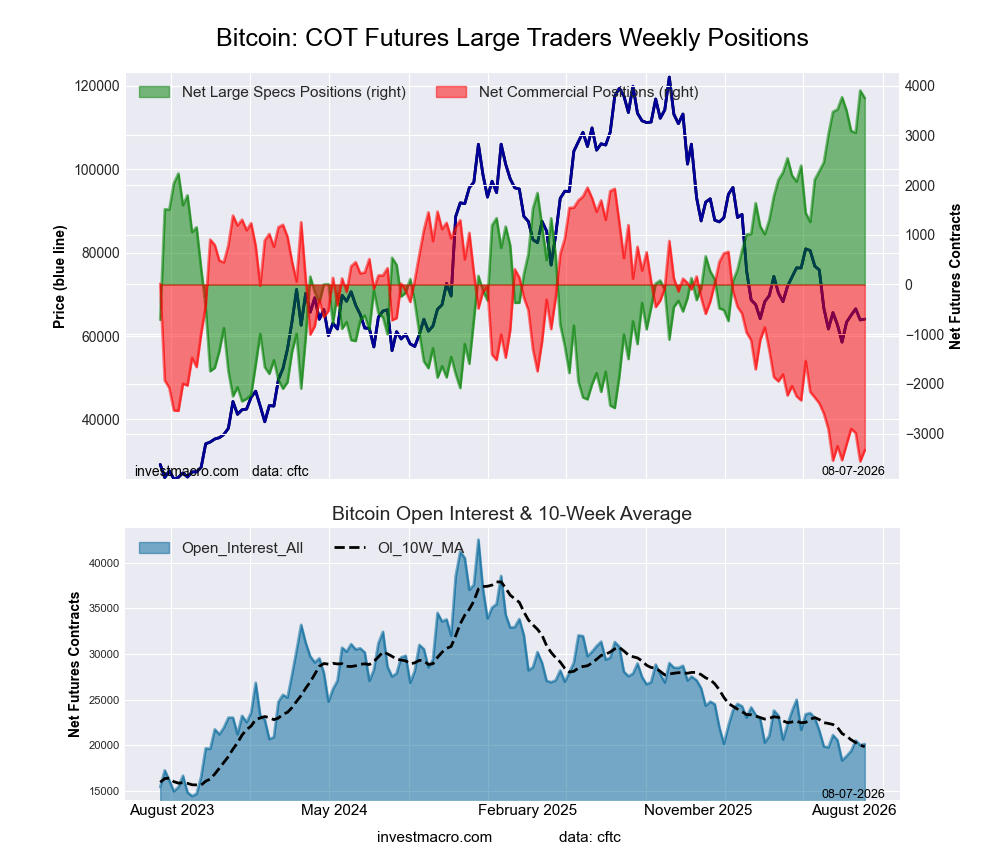
The currencies seeing declines in speculator bets on the week were the Canadian Dollar (-2,785 contracts) with Bitcoin (-152 contracts) also registering lower bets on the week.
Highlighting the major Currency speculator positioning this week was the US Dollar Index and the Japanese Yen.
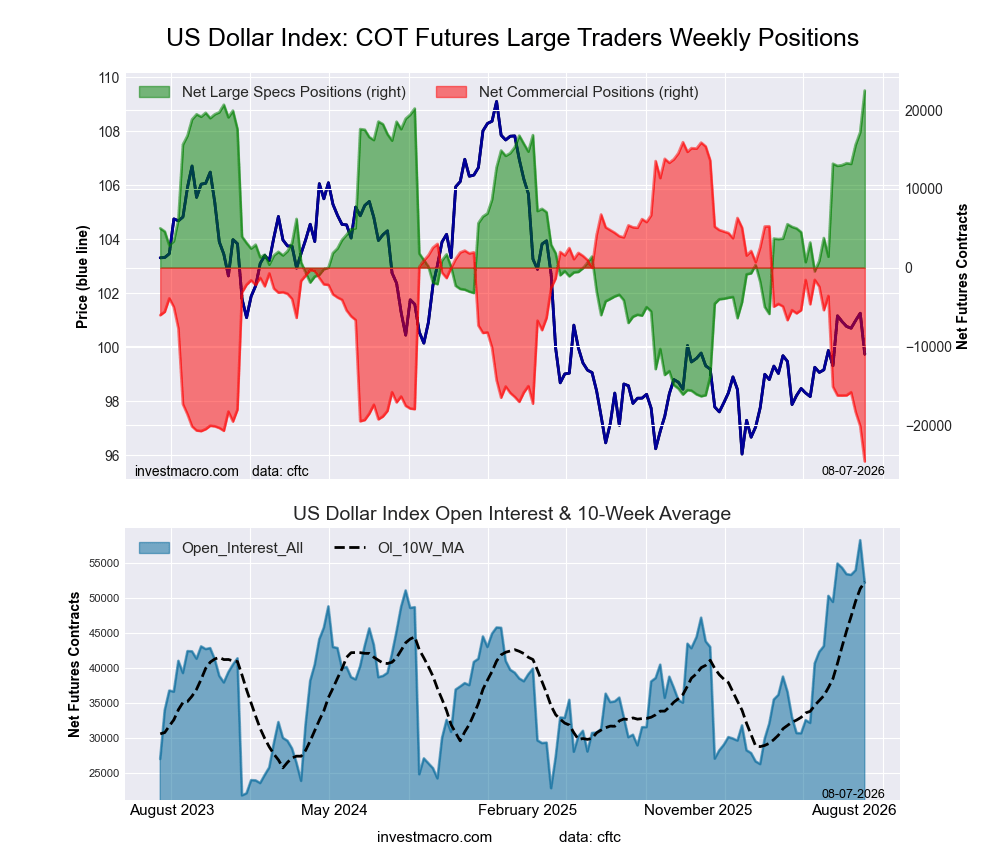
First up, the US Dollar Index speculator bets continue to improve and push higher in bullish territory. This week, the speculator bets rose for a third consecutive week and for the fifth time out of the past six weeks. This recent bullishness in speculator bets has pushed the overall net standing this week to +22,499 net contracts. This is the highest level of the last 190 weeks, dating back to December 13th of 2022 when the net position was over +25,000 contracts. The US Dollar Index speculator positions have now been above at least +10,000 contracts for eight consecutive weeks.
Despite the positive sentiment for the US Dollar Index, in the Foreign Exchange markets, the DXY price has now fallen for two consecutive weeks and dropped under the significant 100.00 level. The US Dollar Index had been above this level for the past six weeks but has now slid back into its trading range that had persisted for over the previous year. That range currently still has a top side of 100.00 with a bottom level support around the 96.50 threshold. It will be interesting to see where the US Dollar Index goes from here, whether rising interest rates can get the DXY back to above the 100.00 resistance, or if we fall back into this range for the time being.
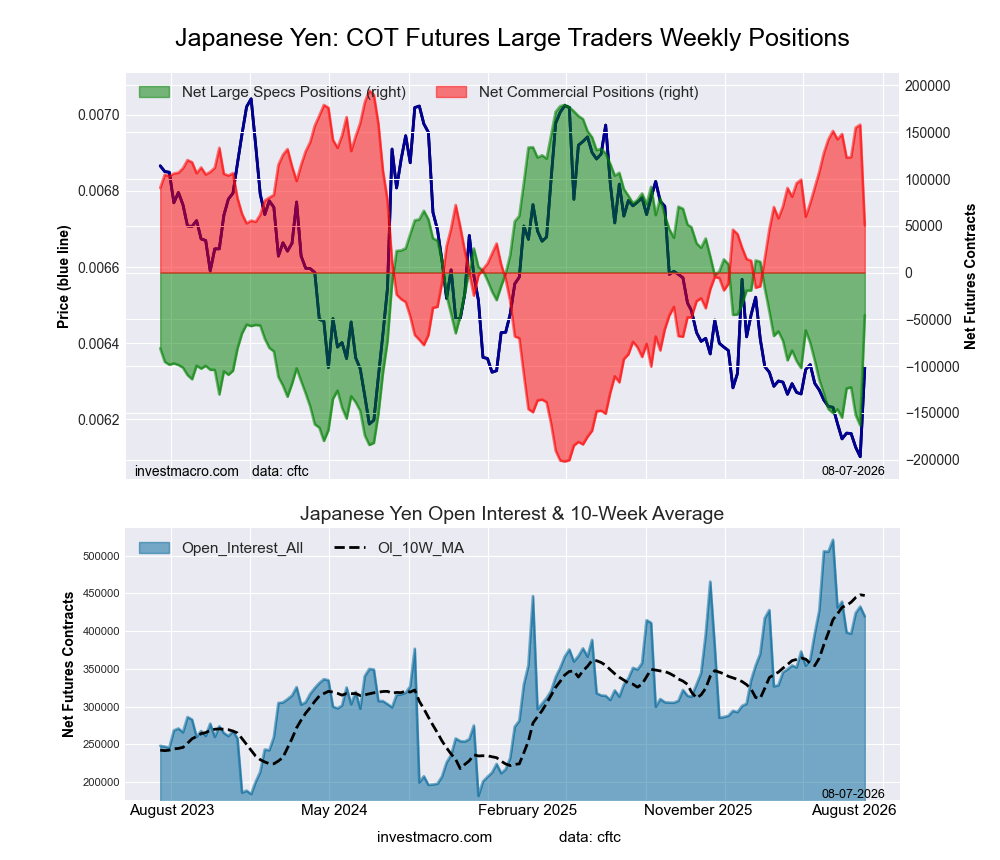
Next up, the Japanese Yen speculator bets saw a giant reversal this week due to the Currency intervention by both the United States and Japan. This week’s speculator positioning saw an improvement by +117,939 contracts for the Japanese Yen, which is the highest one-week change on record. This has taken the Japanese Yen speculator position from a total of -163,412 net contracts on July 28th to this week’s total of -45,473 net contracts.
Speculators bailed on a lot of their bearish positioning due to the coordinated United States and Japan Currency intervention, which looked to stem the slide in the Japanese Yen. The Japanese Yen weakness against the US Dollar has hit remarkable low points, and in July, touched the lowest levels since 1986, according to Currency data from forex.com. The USD strength in July touched the 163.98 level against the Yen and overtook the USDJPY levels of 2024 when the US Dollar hit a 161.95 high against the Yen. The USDJPY Currency pair retreated this week off those levels and closed at the 157.76 exchange rate. Currency interventions rarely work by themselves in the longer term without other policy changes but can dent the Japanese Yen’s slide in the short-term.
In the major Currency markets, Bitcoin led the way this week with a 2.20% increase. The Mexican Peso came in next with a 1.16% rise, while the Canadian Dollar was higher by 0.63%. The Australian Dollar was up by 0.59% on the week, followed by the Euro, which saw a 0.3% increase.
The New Zealand Dollar rose by 0.25% and was followed by the British Pound Sterling, which was up by 0.13%, and the Swiss Franc, which was higher by 0.11%. The Brazilian Real rounds up the gainers with an edge higher by 0.08%.
On the downside, the US Dollar Index dipped by -0.14% and was followed by the biggest decliner on the week, which was the Japanese Yen, and which fell by -0.70%.
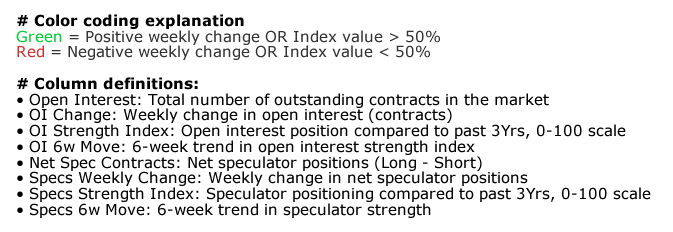
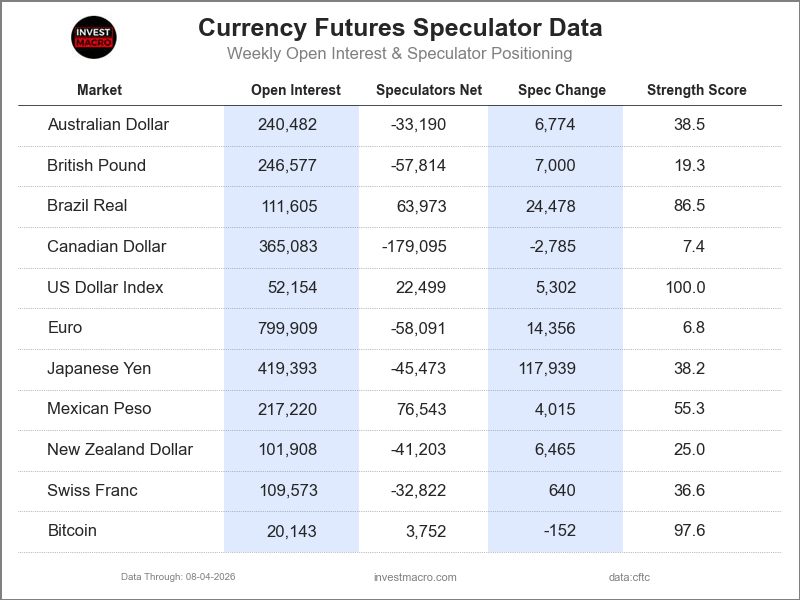
Legend: Open Interest | Speculators Current Net Position | Weekly Specs Change | Specs Strength Score compared to last 3-Years (0-100 range)
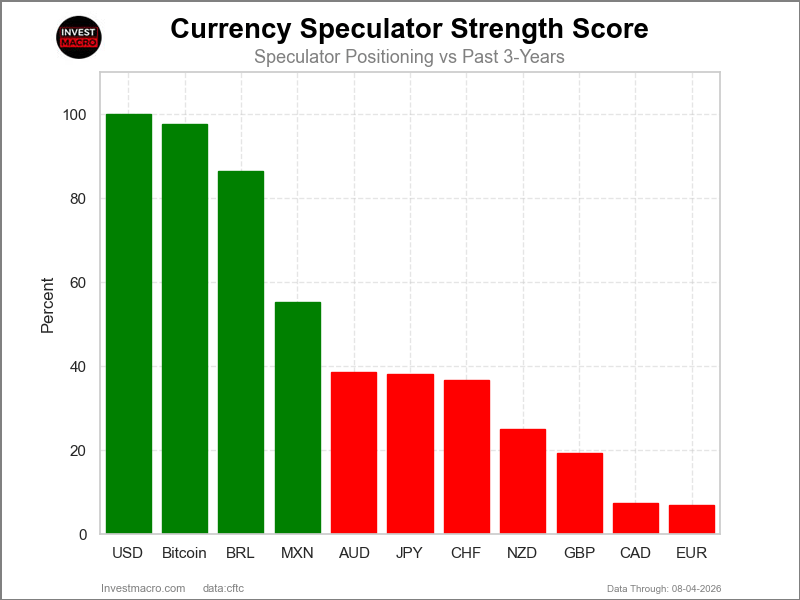
COT Strength Scores (a normalized measure of Speculator positions over a 3-Year range, from 0 to 100 where above 80 is Extreme-Bullish and below 20 is Extreme-Bearish) showed that the US Dollar Index (100 percent) and Bitcoin (98 percent) lead the currency markets this week. The Brazilian Real (86 percent) and the Mexican Peso (55 percent) come in as the next highest in the weekly strength scores.
On the downside, the Canadian Dollar (7 percent), the EuroFX (7 percent) and the British Pound (19 percent) come in at the lowest strength levels currently and are in Extreme-Bearish territory (below 20 percent).
3-Year Strength Statistics:
US Dollar Index (100.0 percent) vs US Dollar Index previous week (86.4 percent)
EuroFX (6.8 percent) vs EuroFX previous week (1.2 percent)
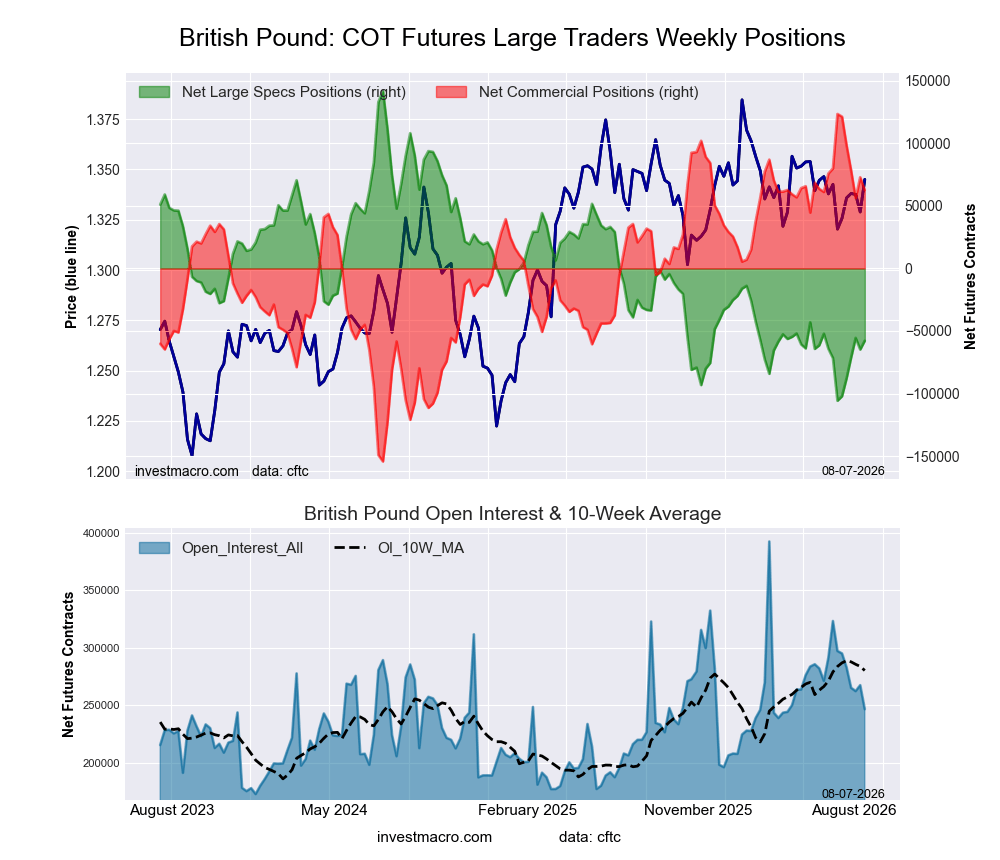
British Pound Sterling (19.3 percent) vs British Pound Sterling previous week (16.5 percent)
Japanese Yen (38.2 percent) vs Japanese Yen previous week (5.7 percent)
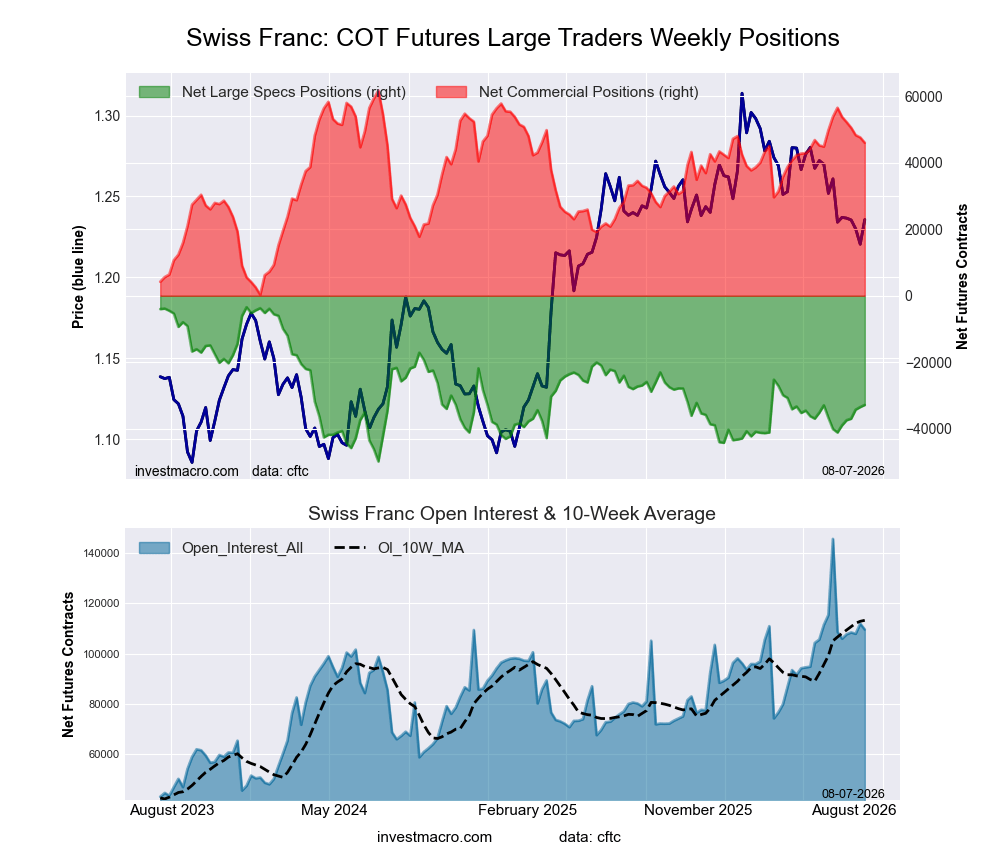
Swiss Franc (36.6 percent) vs Swiss Franc previous week (35.2 percent)
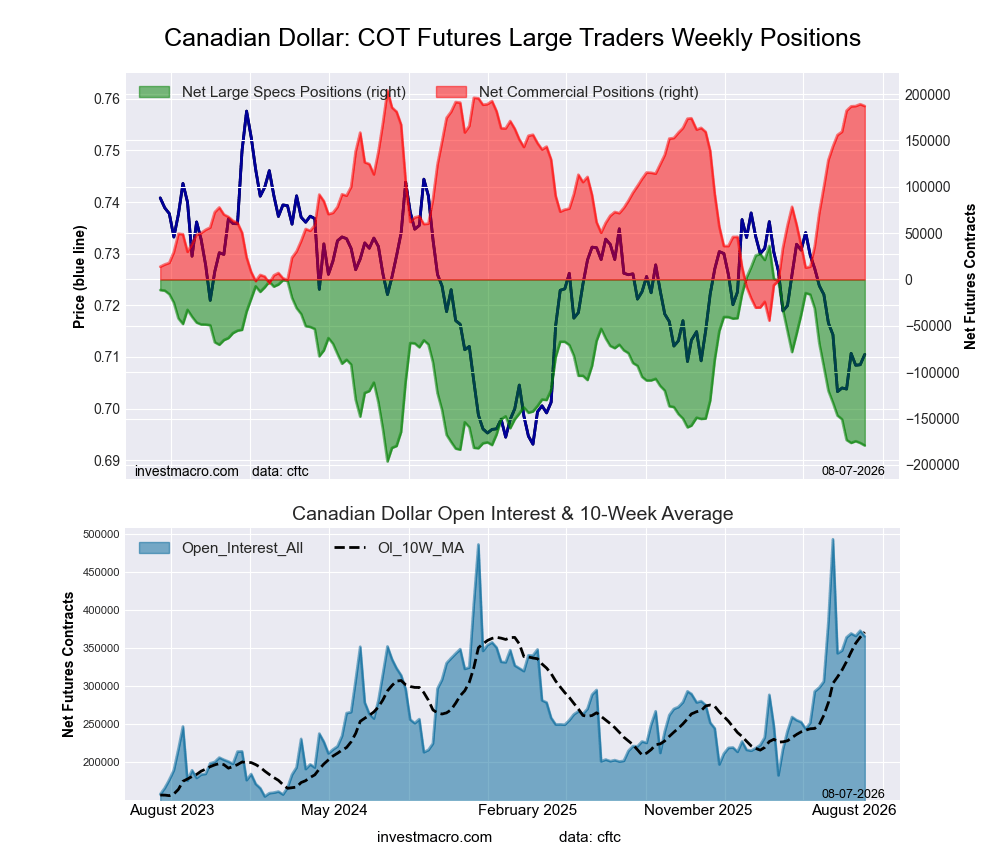
Canadian Dollar (7.4 percent) vs Canadian Dollar previous week (8.6 percent)
Australian Dollar (38.5 percent) vs Australian Dollar previous week (35.0 percent)
New Zealand Dollar (25.0 percent) vs New Zealand Dollar previous week (18.3 percent)
Mexican Peso (55.3 percent) vs Mexican Peso previous week (52.4 percent)
Brazilian Real (86.5 percent) vs Brazilian Real previous week (68.7 percent)
Bitcoin (97.6 percent) vs Bitcoin previous week (100.0 percent)
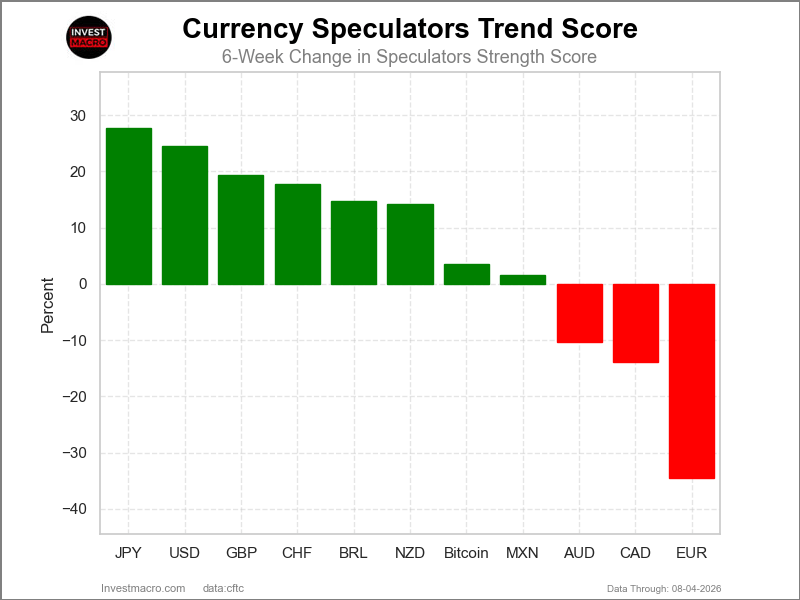
COT Strength Score Trends (or move index, calculates the 6-week changes in strength scores) showed that the Japanese Yen (28 percent) and the US Dollar Index (25 percent) lead the past six weeks trends for the currencies. The British Pound (19 percent), the Swiss Franc (18 percent) and the Brazilian Real (15 percent) are the next highest positive movers in the 3-Year trends data.
The EuroFX (-34 percent) leads the downside trend scores currently with the Canadian Dollar (-14 percent) and the Australian Dollar (-10 percent) following next with lower trend scores.
3-Year Strength Trends:
US Dollar Index (24.6 percent) vs US Dollar Index previous week (10.3 percent)
EuroFX (-34.5 percent) vs EuroFX previous week (-41.7 percent)
British Pound Sterling (19.3 percent) vs British Pound Sterling previous week (2.7 percent)
Japanese Yen (27.7 percent) vs Japanese Yen previous week (-3.7 percent)
Swiss Franc (17.8 percent) vs Swiss Franc previous week (14.2 percent)
Canadian Dollar (-13.9 percent) vs Canadian Dollar previous week (-18.7 percent)
Australian Dollar (-10.4 percent) vs Australian Dollar previous week (-18.6 percent)
New Zealand Dollar (14.2 percent) vs New Zealand Dollar previous week (-2.6 percent)
Mexican Peso (1.6 percent) vs Mexican Peso previous week (0.5 percent)
Brazilian Real (14.8 percent) vs Brazilian Real previous week (-1.1 percent)
Bitcoin (3.6 percent) vs Bitcoin previous week (6.7 percent)
Our weekly trend-following model classifies the current market price position as: Weak Uptrend.
| US DOLLAR INDEX Statistics | SPECULATORS | COMMERCIALS | SMALL TRADERS |
| – Percent of Open Interest Longs: | 67.6 | 22.4 | 7.0 |
| – Percent of Open Interest Shorts: | 24.4 | 69.6 | 2.9 |
| – Net Position: | 22,499 | -24,626 | 2,127 |
| – Gross Longs: | 35,247 | 11,665 | 3,661 |
| – Gross Shorts: | 12,748 | 36,291 | 1,534 |
| – Long to Short Ratio: | 2.8 to 1 | 0.3 to 1 | 2.4 to 1 |
| NET POSITION TREND: | |||
| – Strength Index Score (3 Year Range Pct): | 100.0 | 0.0 | 78.5 |
| – Strength Index Reading (3 Year Range): | Bullish-Extreme | Bearish-Extreme | Bullish |
| NET POSITION MOVEMENT INDEX: | |||
| – 6-Week Change in Strength Index: | 24.6 | -20.7 | -21.5 |
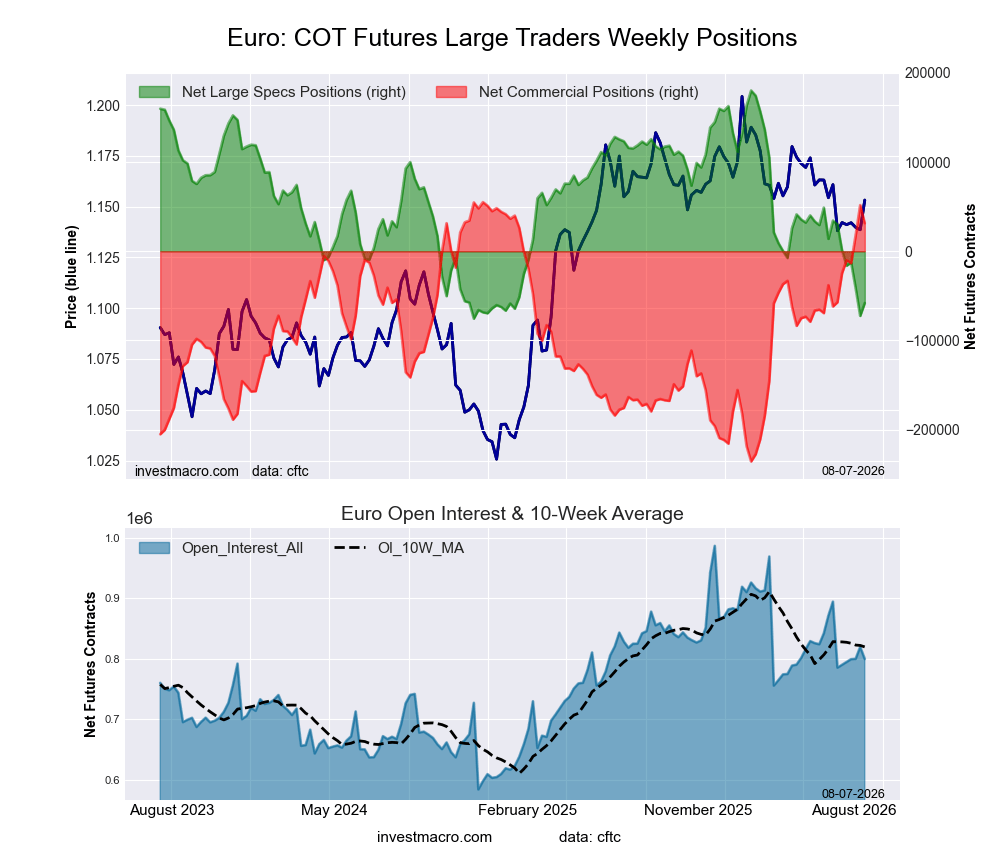
Our weekly trend-following model classifies the current market price position as: Downtrend.
| EURO Currency Statistics | SPECULATORS | COMMERCIALS | SMALL TRADERS |
| – Percent of Open Interest Longs: | 25.2 | 59.5 | 10.1 |
| – Percent of Open Interest Shorts: | 32.5 | 55.5 | 6.8 |
| – Net Position: | -58,091 | 31,462 | 26,629 |
| – Gross Longs: | 201,847 | 475,669 | 80,953 |
| – Gross Shorts: | 259,938 | 444,207 | 54,324 |
| – Long to Short Ratio: | 0.8 to 1 | 1.1 to 1 | 1.5 to 1 |
| NET POSITION TREND: | |||
| – Strength Index Score (3 Year Range Pct): | 6.8 | 91.9 | 30.7 |
| – Strength Index Reading (3 Year Range): | Bearish-Extreme | Bullish-Extreme | Bearish |
| NET POSITION MOVEMENT INDEX: | |||
| – 6-Week Change in Strength Index: | -34.5 | 30.5 | -0.8 |
Our weekly trend-following model classifies the current market price position as: Uptrend.
| BRITISH POUND Statistics | SPECULATORS | COMMERCIALS | SMALL TRADERS |
| – Percent of Open Interest Longs: | 22.3 | 66.0 | 9.6 |
| – Percent of Open Interest Shorts: | 45.8 | 40.6 | 11.6 |
| – Net Position: | -57,814 | 62,645 | -4,831 |
| – Gross Longs: | 55,012 | 162,731 | 23,651 |
| – Gross Shorts: | 112,826 | 100,086 | 28,482 |
| – Long to Short Ratio: | 0.5 to 1 | 1.6 to 1 | 0.8 to 1 |
| NET POSITION TREND: | |||
| – Strength Index Score (3 Year Range Pct): | 19.3 | 78.1 | 41.0 |
| – Strength Index Reading (3 Year Range): | Bearish-Extreme | Bullish | Bearish |
| NET POSITION MOVEMENT INDEX: | |||
| – 6-Week Change in Strength Index: | 19.3 | -21.9 | 33.8 |
Our weekly trend-following model classifies the current market price position as: Weak Downtrend.
| JAPANESE YEN Statistics | SPECULATORS | COMMERCIALS | SMALL TRADERS |
| – Percent of Open Interest Longs: | 35.1 | 53.0 | 8.2 |
| – Percent of Open Interest Shorts: | 45.9 | 41.0 | 9.4 |
| – Net Position: | -45,473 | 50,568 | -5,095 |
| – Gross Longs: | 147,228 | 222,390 | 34,510 |
| – Gross Shorts: | 192,701 | 171,822 | 39,605 |
| – Long to Short Ratio: | 0.8 to 1 | 1.3 to 1 | 0.9 to 1 |
| NET POSITION TREND: | |||
| – Strength Index Score (3 Year Range Pct): | 38.2 | 63.7 | 19.0 |
| – Strength Index Reading (3 Year Range): | Bearish | Bullish | Bearish-Extreme |
| NET POSITION MOVEMENT INDEX: | |||
| – 6-Week Change in Strength Index: | 27.7 | -23.2 | -24.2 |
Our weekly trend-following model classifies the current market price position as: Downtrend.
| SWISS FRANC Statistics | SPECULATORS | COMMERCIALS | SMALL TRADERS |
| – Percent of Open Interest Longs: | 10.3 | 75.5 | 9.7 |
| – Percent of Open Interest Shorts: | 40.2 | 33.5 | 21.7 |
| – Net Position: | -32,822 | 45,974 | -13,152 |
| – Gross Longs: | 11,270 | 82,724 | 10,584 |
| – Gross Shorts: | 44,092 | 36,750 | 23,736 |
| – Long to Short Ratio: | 0.3 to 1 | 2.3 to 1 | 0.4 to 1 |
| NET POSITION TREND: | |||
| – Strength Index Score (3 Year Range Pct): | 36.6 | 74.4 | 23.4 |
| – Strength Index Reading (3 Year Range): | Bearish | Bullish | Bearish |
| NET POSITION MOVEMENT INDEX: | |||
| – 6-Week Change in Strength Index: | 17.8 | -17.1 | 9.7 |
Our weekly trend-following model classifies the current market price position as: Downtrend.
| CANADIAN DOLLAR Statistics | SPECULATORS | COMMERCIALS | SMALL TRADERS |
| – Percent of Open Interest Longs: | 3.7 | 83.7 | 8.2 |
| – Percent of Open Interest Shorts: | 52.8 | 32.5 | 10.4 |
| – Net Position: | -179,095 | 187,008 | -7,913 |
| – Gross Longs: | 13,514 | 305,631 | 29,943 |
| – Gross Shorts: | 192,609 | 118,623 | 37,856 |
| – Long to Short Ratio: | 0.1 to 1 | 2.6 to 1 | 0.8 to 1 |
| NET POSITION TREND: | |||
| – Strength Index Score (3 Year Range Pct): | 7.4 | 93.2 | 28.7 |
| – Strength Index Reading (3 Year Range): | Bearish-Extreme | Bullish-Extreme | Bearish |
| NET POSITION MOVEMENT INDEX: | |||
| – 6-Week Change in Strength Index: | -13.9 | 12.6 | 3.7 |
Our weekly trend-following model classifies the current market price position as: Weak Downtrend.
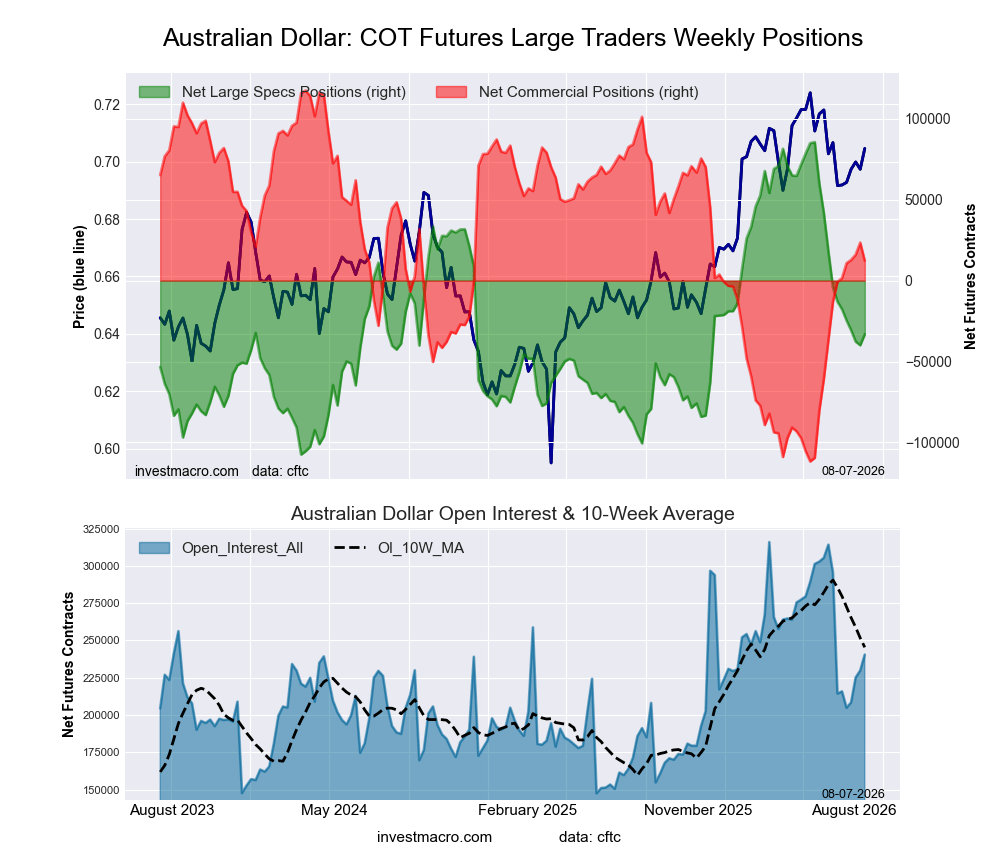
| AUSTRALIAN DOLLAR Statistics | SPECULATORS | COMMERCIALS | SMALL TRADERS |
| – Percent of Open Interest Longs: | 30.9 | 53.1 | 15.2 |
| – Percent of Open Interest Shorts: | 44.7 | 48.0 | 6.5 |
| – Net Position: | -33,190 | 12,324 | 20,866 |
| – Gross Longs: | 74,385 | 127,695 | 36,579 |
| – Gross Shorts: | 107,575 | 115,371 | 15,713 |
| – Long to Short Ratio: | 0.7 to 1 | 1.1 to 1 | 2.3 to 1 |
| NET POSITION TREND: | |||
| – Strength Index Score (3 Year Range Pct): | 38.5 | 54.1 | 84.0 |
| – Strength Index Reading (3 Year Range): | Bearish | Bullish | Bullish-Extreme |
| NET POSITION MOVEMENT INDEX: | |||
| – 6-Week Change in Strength Index: | -10.4 | 5.7 | 14.9 |
Our weekly trend-following model classifies the current market price position as: Weak Downtrend.
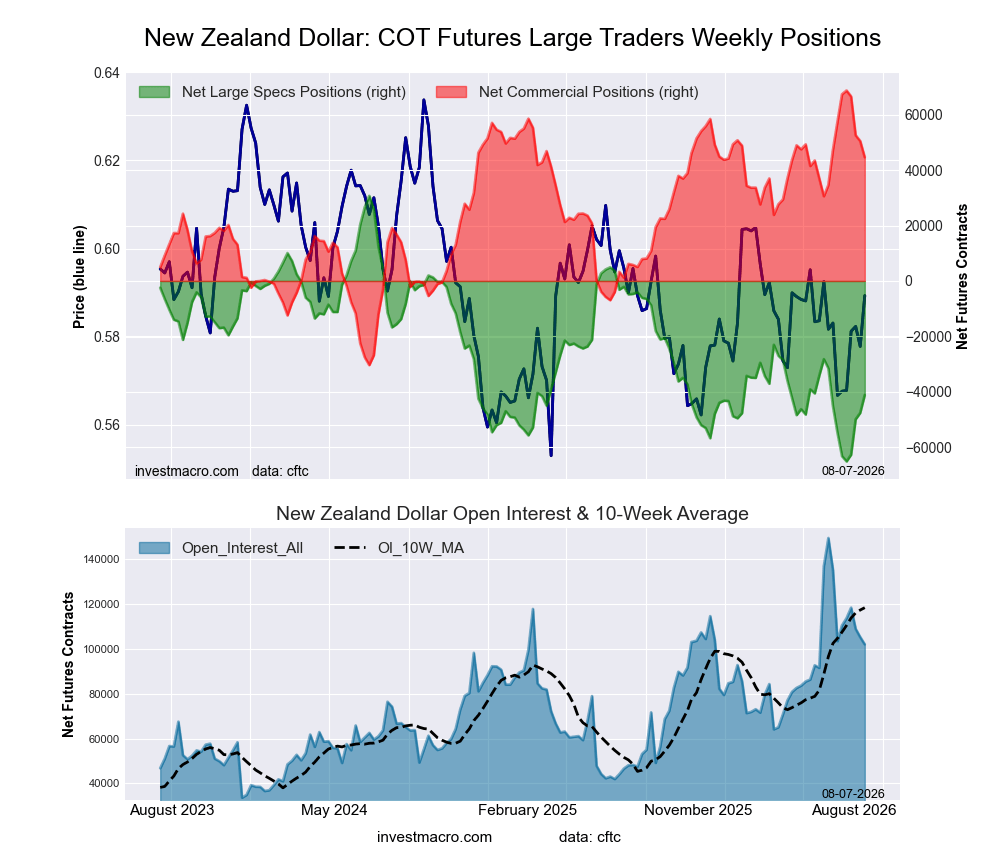
| NEW ZEALAND DOLLAR Statistics | SPECULATORS | COMMERCIALS | SMALL TRADERS |
| – Percent of Open Interest Longs: | 5.5 | 91.5 | 2.6 |
| – Percent of Open Interest Shorts: | 45.9 | 47.6 | 6.0 |
| – Net Position: | -41,203 | 44,687 | -3,484 |
| – Gross Longs: | 5,577 | 93,208 | 2,662 |
| – Gross Shorts: | 46,780 | 48,521 | 6,146 |
| – Long to Short Ratio: | 0.1 to 1 | 1.9 to 1 | 0.4 to 1 |
| NET POSITION TREND: | |||
| – Strength Index Score (3 Year Range Pct): | 25.0 | 75.7 | 8.7 |
| – Strength Index Reading (3 Year Range): | Bearish | Bullish | Bearish-Extreme |
| NET POSITION MOVEMENT INDEX: | |||
| – 6-Week Change in Strength Index: | 14.2 | -12.9 | -10.3 |
Our weekly trend-following model classifies the current market price position as: Uptrend.
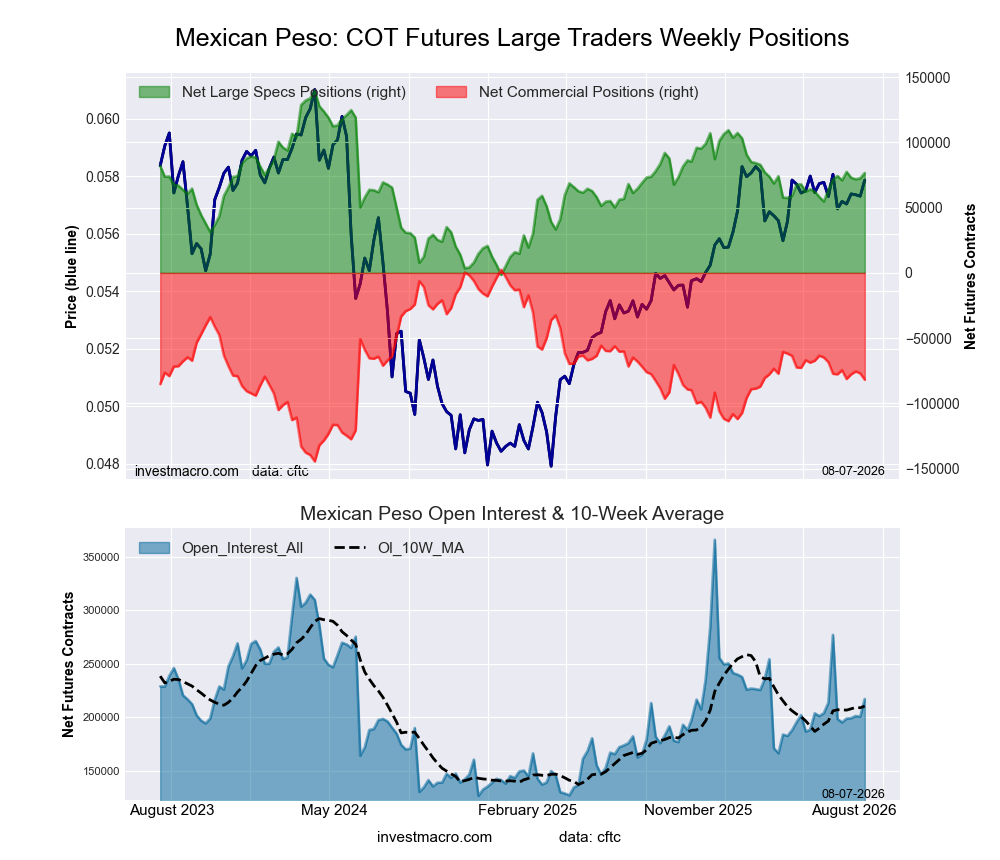
| MEXICAN PESO Statistics | SPECULATORS | COMMERCIALS | SMALL TRADERS |
| – Percent of Open Interest Longs: | 54.6 | 41.3 | 3.6 |
| – Percent of Open Interest Shorts: | 19.3 | 78.9 | 1.1 |
| – Net Position: | 76,543 | -81,853 | 5,310 |
| – Gross Longs: | 118,510 | 89,618 | 7,717 |
| – Gross Shorts: | 41,967 | 171,471 | 2,407 |
| – Long to Short Ratio: | 2.8 to 1 | 0.5 to 1 | 3.2 to 1 |
| NET POSITION TREND: | |||
| – Strength Index Score (3 Year Range Pct): | 55.3 | 42.6 | 65.9 |
| – Strength Index Reading (3 Year Range): | Bullish | Bearish | Bullish |
| NET POSITION MOVEMENT INDEX: | |||
| – 6-Week Change in Strength Index: | 1.6 | -2.9 | 13.1 |
Our weekly trend-following model classifies the current market price position as: Downtrend.
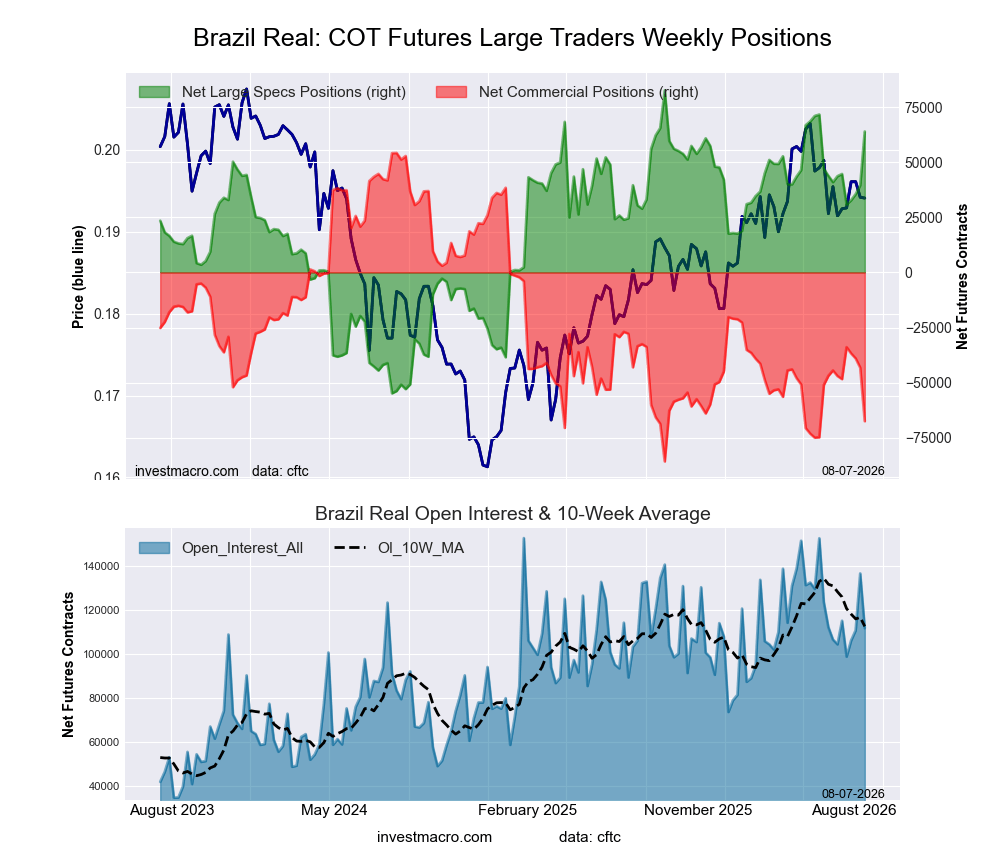
| BRAZIL REAL Statistics | SPECULATORS | COMMERCIALS | SMALL TRADERS |
| – Percent of Open Interest Longs: | 80.0 | 14.9 | 4.4 |
| – Percent of Open Interest Shorts: | 22.7 | 75.4 | 1.3 |
| – Net Position: | 63,973 | -67,523 | 3,550 |
| – Gross Longs: | 89,256 | 16,578 | 4,958 |
| – Gross Shorts: | 25,283 | 84,101 | 1,408 |
| – Long to Short Ratio: | 3.5 to 1 | 0.2 to 1 | 3.5 to 1 |
| NET POSITION TREND: | |||
| – Strength Index Score (3 Year Range Pct): | 86.5 | 13.1 | 40.7 |
| – Strength Index Reading (3 Year Range): | Bullish-Extreme | Bearish-Extreme | Bearish |
| NET POSITION MOVEMENT INDEX: | |||
| – 6-Week Change in Strength Index: | 14.8 | -14.6 | 1.2 |
Our weekly trend-following model classifies the current market price position as: Downtrend.
| BITCOIN Statistics | SPECULATORS | COMMERCIALS | SMALL TRADERS |
| – Percent of Open Interest Longs: | 87.2 | 0.2 | 3.2 |
| – Percent of Open Interest Shorts: | 68.5 | 16.7 | 5.3 |
| – Net Position: | 3,752 | -3,332 | -420 |
| – Gross Longs: | 17,559 | 38 | 652 |
| – Gross Shorts: | 13,807 | 3,370 | 1,072 |
| – Long to Short Ratio: | 1.3 to 1 | 0.0 to 1 | 0.6 to 1 |
| NET POSITION TREND: | |||
| – Strength Index Score (3 Year Range Pct): | 97.6 | 4.2 | 15.6 |
| – Strength Index Reading (3 Year Range): | Bullish-Extreme | Bearish-Extreme | Bearish-Extreme |
| NET POSITION MOVEMENT INDEX: | |||
| – 6-Week Change in Strength Index: | 3.6 | -1.4 | -7.7 |
Article By InvestMacro – Receive our weekly COT Newsletter
*COT Report: The COT data, released weekly to the public each Friday, is updated through the most recent Tuesday (data is 3 days old) and shows a quick view of how large speculators or non-commercials (for-profit traders) were positioned in the futures markets.
The CFTC categorizes trader positions according to commercial hedgers (traders who use futures contracts for hedging as part of the business), non-commercials (large traders who speculate to realize trading profits) and nonreportable traders (usually small traders/speculators) as well as their open interest (contracts open in the market at time of reporting). See CFTC criteria here.
By InvestMacro The latest update for the weekly Commitment of Traders (COT) report was released…
By InvestMacro Here are the latest charts and statistics for the Commitment of Traders (COT)…
By InvestMacro Here are the latest charts and statistics for the Commitment of Traders (COT)…
By InvestMacro Here are the latest charts and statistics for the Commitment of Traders (COT)…
By InvestMacro Here are the latest charts and statistics for the Commitment of Traders (COT)…
By JustMarkets On Thursday, US stock indices ended the session lower, as a sharp spike…
This website uses cookies.