By InvestMacro
Here are the latest charts and statistics for the Commitment of Traders (COT) data published by the Commodities Futures Trading Commission (CFTC).
The latest COT data is updated through Tuesday January 30th and shows a quick view of how large traders (for-profit speculators and commercial entities) were positioned in the futures markets.
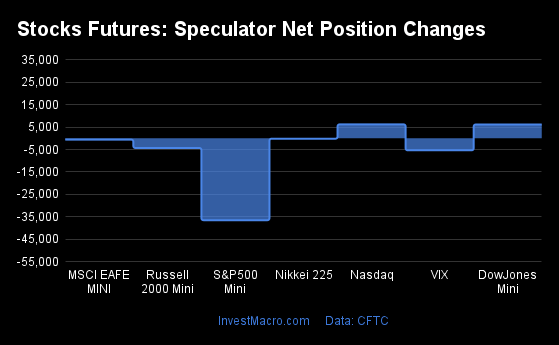
The COT stock markets speculator bets were lower this week as just two out of the seven stock markets we cover had higher positioning while the other five markets had lower speculator contracts.
Free Reports:
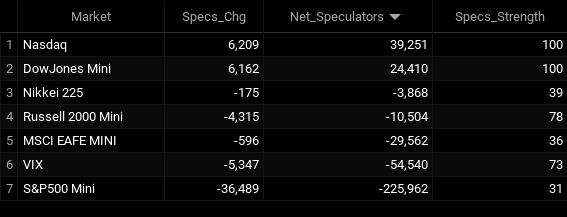
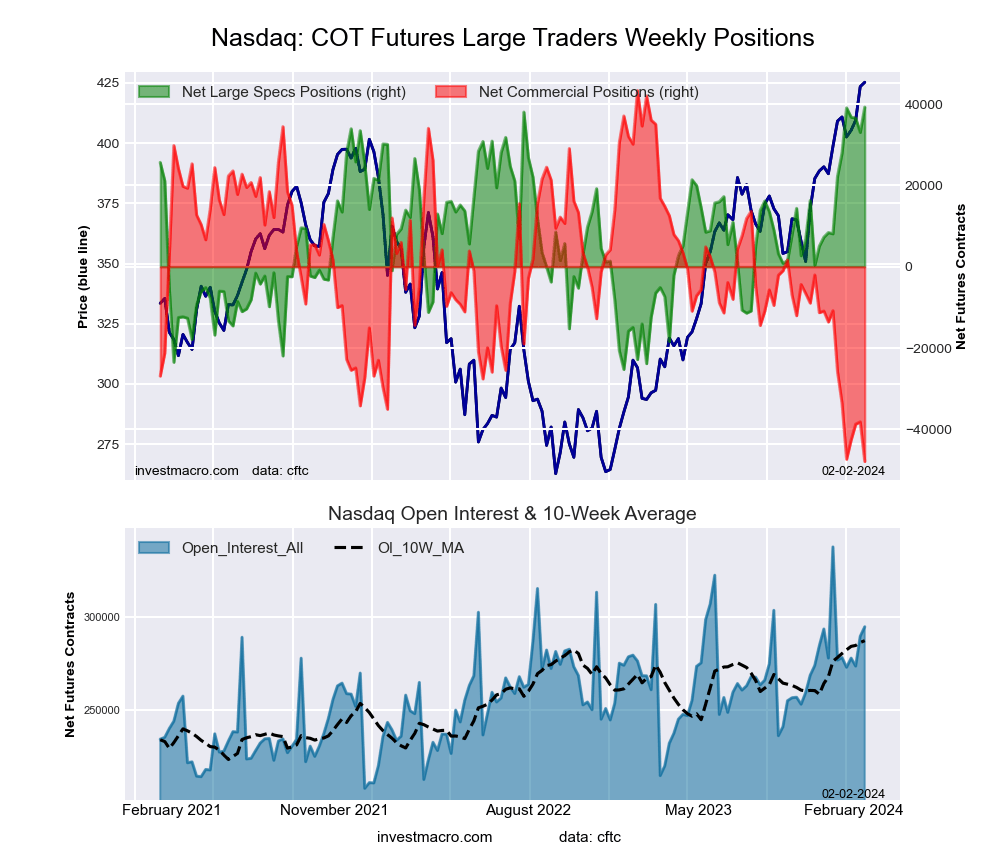
Leading the gains for the stock markets was Nasdaq-Mini (6,209 contracts) with the DowJones-Mini (6,162 contracts) also showing positive weeks.
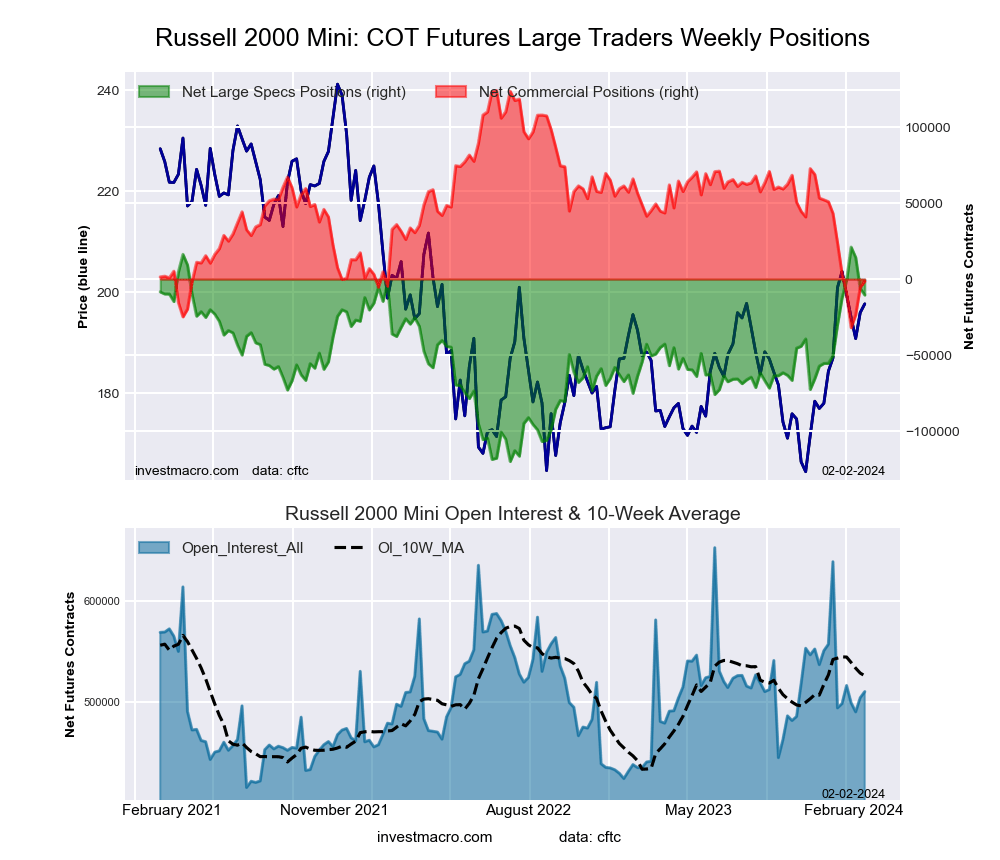
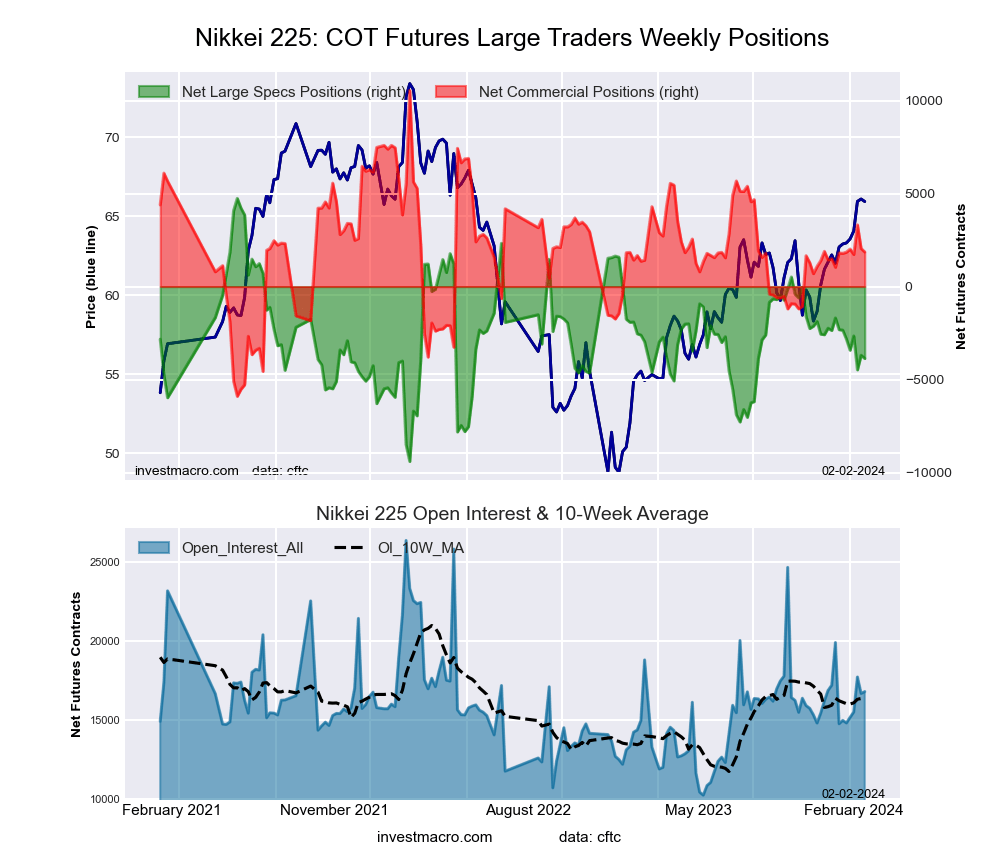
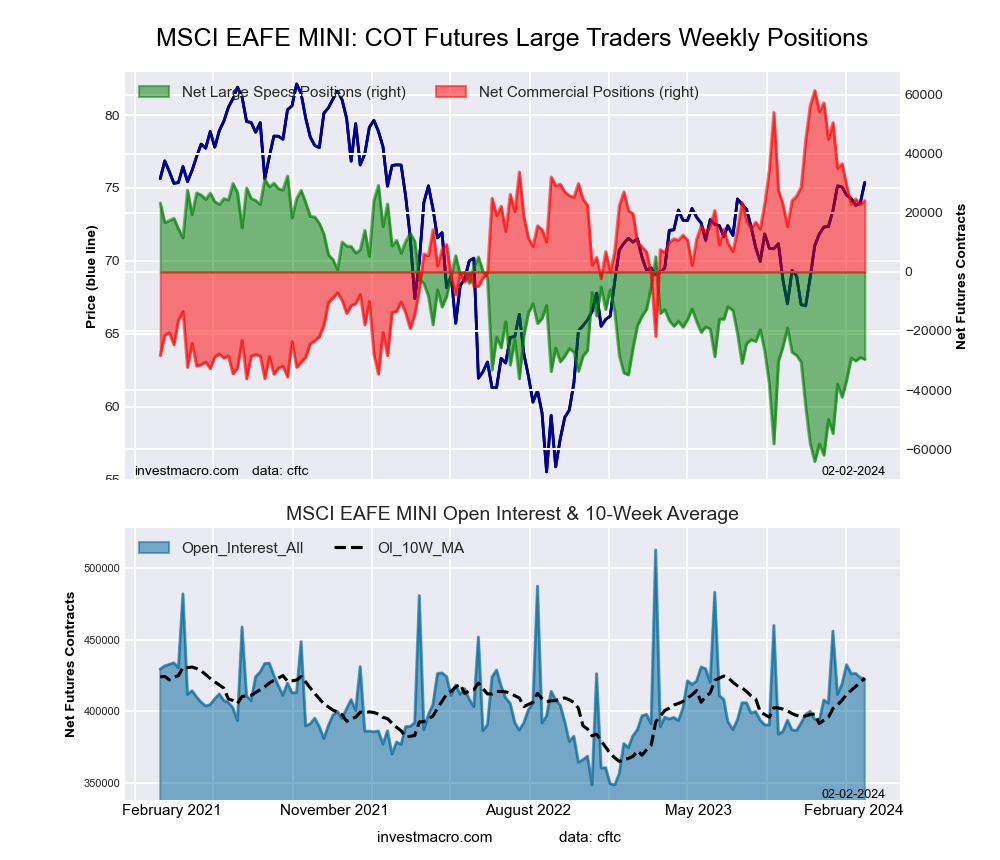
The markets with the declines in speculator bets this week were the S&P500-Mini (-36,489 contracts), the VIX (-5,347 contracts), the Russell-Mini (-4,315 contracts), the Nikkei 225 (-175 contracts) and the MSCI EAFE-Mini (-596 contracts) also registering lower bets on the week.
Legend: Weekly Speculators Change | Speculators Current Net Position | Speculators Strength Score compared to last 3-Years (0-100 range)
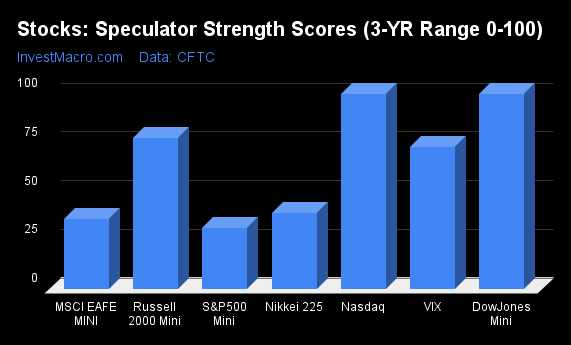
COT Strength Scores (a normalized measure of Speculator positions over a 3-Year range, from 0 to 100 where above 80 is Extreme-Bullish and below 20 is Extreme-Bearish) showed that the Nasdaq-Mini (100 percent) and the DowJones-Mini (100 percent) lead the stock markets this week and are at the top of their 3-year ranges. The Russell-Mini (78 percent) comes in as the next highest in the weekly strength scores.
On the downside, the S&P500-Mini (31 percent) comes in at the lowest strength level currently with the next lowest strength score being the MSCI EAFE-Mini (36 percent).
Strength Statistics:
VIX (72.8 percent) vs VIX previous week (76.4 percent)
S&P500-Mini (31.0 percent) vs S&P500-Mini previous week (36.5 percent)
DowJones-Mini (100.0 percent) vs DowJones-Mini previous week (90.0 percent)
Nasdaq-Mini (100.0 percent) vs Nasdaq-Mini previous week (90.4 percent)
Russell2000-Mini (77.6 percent) vs Russell2000-Mini previous week (80.7 percent)
Nikkei USD (39.1 percent) vs Nikkei USD previous week (40.4 percent)
EAFE-Mini (35.8 percent) vs EAFE-Mini previous week (36.4 percent)
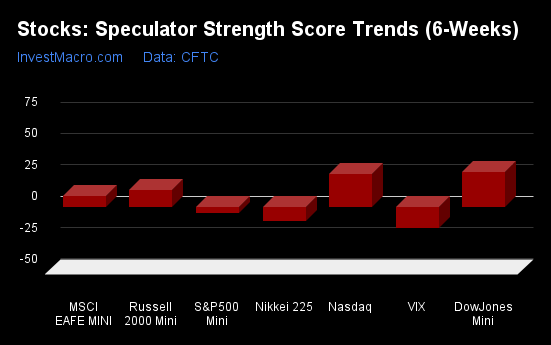
COT Strength Score Trends (or move index, calculates the 6-week changes in strength scores) showed that the DowJones-Mini (28 percent) leads the past six weeks trends for the stock markets. The Nasdaq-Mini (26 percent), the Russell-Mini (14 percent) and the MSCI EAFE-Mini (9 percent) are the next highest positive movers in the latest trends data.
The VIX (-16 percent) leads the downside trend scores currently with the Nikkei 225 (-11 percent) coming in as the next market with lower trend scores.
Strength Trend Statistics:
VIX (-16.3 percent) vs VIX previous week (-1.9 percent)
S&P500-Mini (-4.6 percent) vs S&P500-Mini previous week (-18.5 percent)
DowJones-Mini (28.1 percent) vs DowJones-Mini previous week (24.1 percent)
Nasdaq-Mini (26.5 percent) vs Nasdaq-Mini previous week (38.7 percent)
Russell2000-Mini (13.9 percent) vs Russell2000-Mini previous week (31.5 percent)
Nikkei USD (-10.8 percent) vs Nikkei USD previous week (-9.7 percent)
EAFE-Mini (8.7 percent) vs EAFE-Mini previous week (26.6 percent)
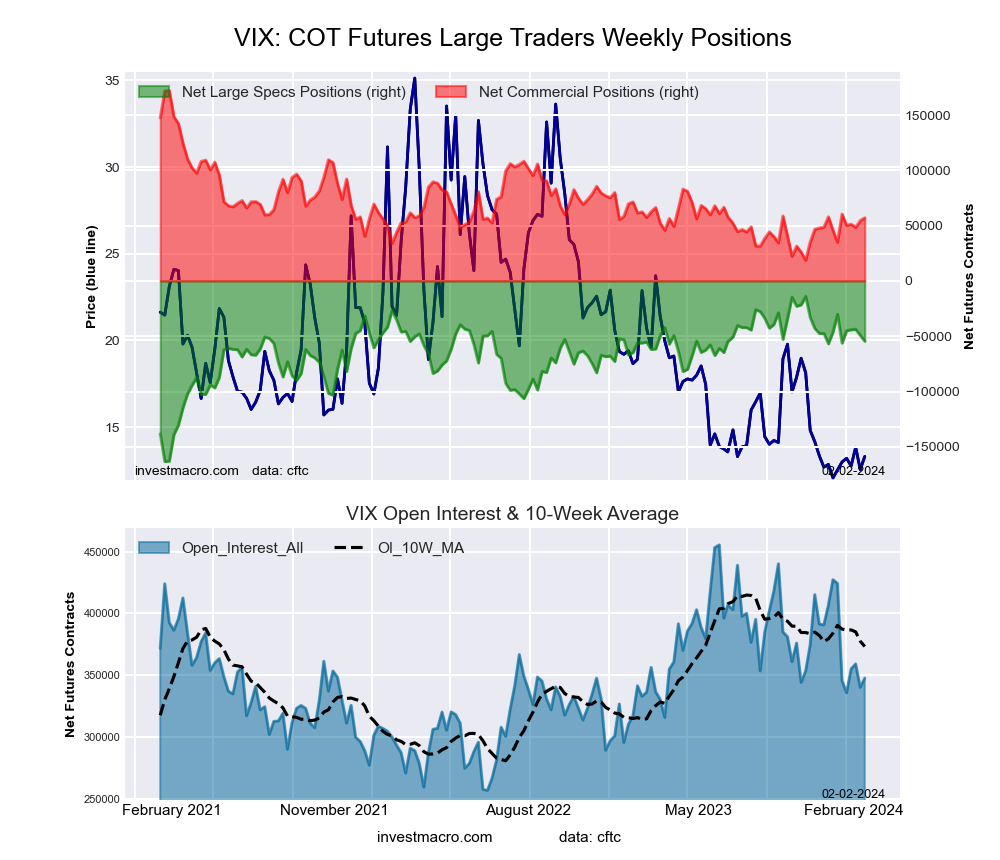
This week’s current strength score (the trader positioning range over the past three years, measured from 0 to 100) shows the speculators are currently Bullish with a score of 72.8 percent. The commercials are Bearish with a score of 25.0 percent and the small traders (not shown in chart) are Bullish-Extreme with a score of 83.7 percent.
Our weekly trend-following model classifies the current market price position as: Downtrend. The current action for the model is considered to be: Hold – Maintain Short Position.
| VIX Volatility Futures Statistics | SPECULATORS | COMMERCIALS | SMALL TRADERS |
| – Percent of Open Interest Longs: | 20.2 | 45.9 | 8.1 |
| – Percent of Open Interest Shorts: | 35.9 | 29.5 | 8.8 |
| – Net Position: | -54,540 | 57,042 | -2,502 |
| – Gross Longs: | 70,187 | 159,581 | 28,032 |
| – Gross Shorts: | 124,727 | 102,539 | 30,534 |
| – Long to Short Ratio: | 0.6 to 1 | 1.6 to 1 | 0.9 to 1 |
| NET POSITION TREND: | |||
| – Strength Index Score (3 Year Range Pct): | 72.8 | 25.0 | 83.7 |
| – Strength Index Reading (3 Year Range): | Bullish | Bearish | Bullish-Extreme |
| NET POSITION MOVEMENT INDEX: | |||
| – 6-Week Change in Strength Index: | -16.3 | 14.4 | 11.4 |
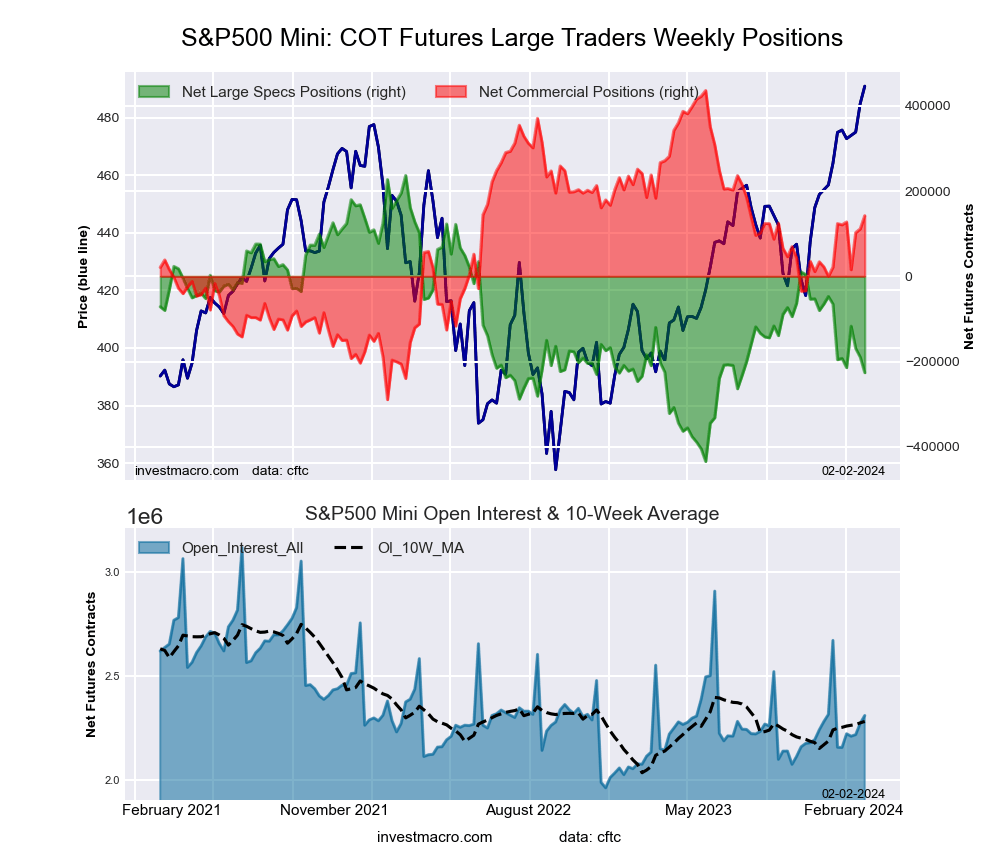
This week’s current strength score (the trader positioning range over the past three years, measured from 0 to 100) shows the speculators are currently Bearish with a score of 31.0 percent. The commercials are Bullish with a score of 59.5 percent and the small traders (not shown in chart) are Bullish with a score of 70.4 percent.
Our weekly trend-following model classifies the current market price position as: Strong Uptrend. The current action for the model is considered to be: Hold – Maintain Long Position.
| S&P500 Mini Futures Statistics | SPECULATORS | COMMERCIALS | SMALL TRADERS |
| – Percent of Open Interest Longs: | 12.3 | 74.3 | 11.5 |
| – Percent of Open Interest Shorts: | 22.1 | 68.1 | 7.8 |
| – Net Position: | -225,962 | 142,194 | 83,768 |
| – Gross Longs: | 284,559 | 1,715,110 | 264,947 |
| – Gross Shorts: | 510,521 | 1,572,916 | 181,179 |
| – Long to Short Ratio: | 0.6 to 1 | 1.1 to 1 | 1.5 to 1 |
| NET POSITION TREND: | |||
| – Strength Index Score (3 Year Range Pct): | 31.0 | 59.5 | 70.4 |
| – Strength Index Reading (3 Year Range): | Bearish | Bullish | Bullish |
| NET POSITION MOVEMENT INDEX: | |||
| – 6-Week Change in Strength Index: | -4.6 | 2.6 | 4.7 |
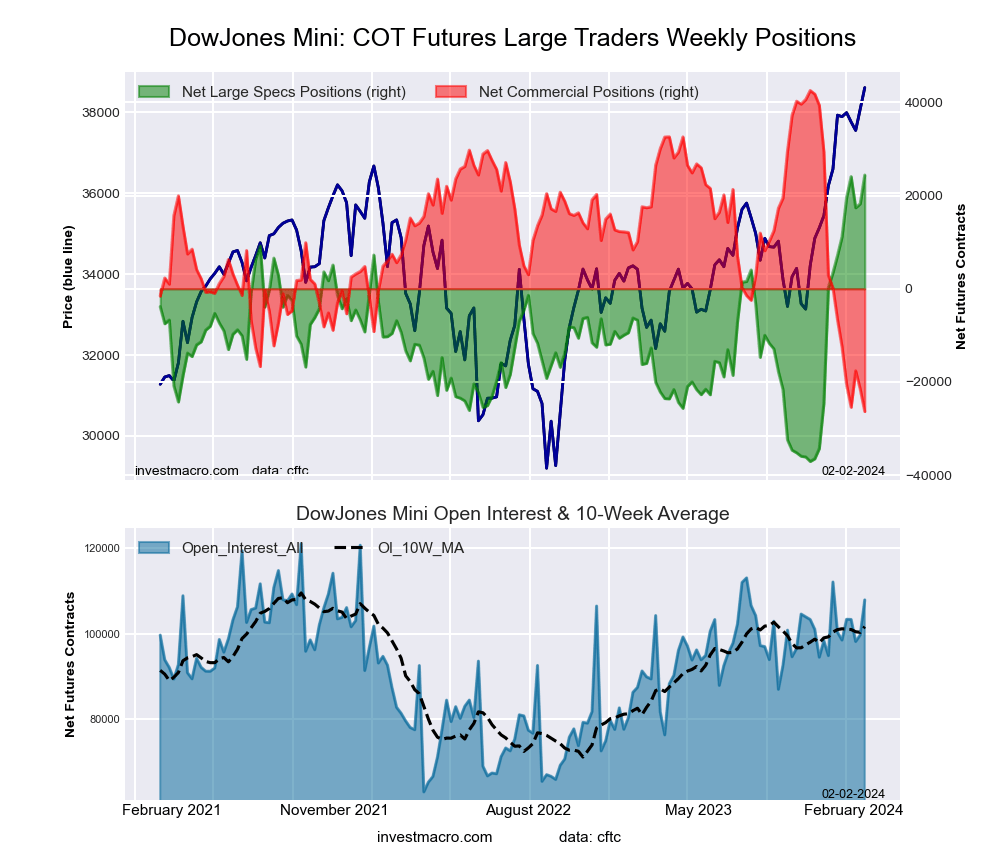
This week’s current strength score (the trader positioning range over the past three years, measured from 0 to 100) shows the speculators are currently Bullish-Extreme with a score of 100.0 percent. The commercials are Bearish-Extreme with a score of 0.0 percent and the small traders (not shown in chart) are Bullish with a score of 53.4 percent.
Our weekly trend-following model classifies the current market price position as: Strong Uptrend. The current action for the model is considered to be: Hold – Maintain Long Position.
| Dow Jones Mini Futures Statistics | SPECULATORS | COMMERCIALS | SMALL TRADERS |
| – Percent of Open Interest Longs: | 36.4 | 48.2 | 13.8 |
| – Percent of Open Interest Shorts: | 13.8 | 72.7 | 12.0 |
| – Net Position: | 24,410 | -26,351 | 1,941 |
| – Gross Longs: | 39,325 | 52,040 | 14,936 |
| – Gross Shorts: | 14,915 | 78,391 | 12,995 |
| – Long to Short Ratio: | 2.6 to 1 | 0.7 to 1 | 1.1 to 1 |
| NET POSITION TREND: | |||
| – Strength Index Score (3 Year Range Pct): | 100.0 | 0.0 | 53.4 |
| – Strength Index Reading (3 Year Range): | Bullish-Extreme | Bearish-Extreme | Bullish |
| NET POSITION MOVEMENT INDEX: | |||
| – 6-Week Change in Strength Index: | 28.1 | -28.6 | 11.9 |
This week’s current strength score (the trader positioning range over the past three years, measured from 0 to 100) shows the speculators are currently Bullish-Extreme with a score of 100.0 percent. The commercials are Bearish-Extreme with a score of 0.0 percent and the small traders (not shown in chart) are Bullish-Extreme with a score of 100.0 percent.
Our weekly trend-following model classifies the current market price position as: Strong Uptrend. The current action for the model is considered to be: Hold – Maintain Long Position.
| Nasdaq Mini Futures Statistics | SPECULATORS | COMMERCIALS | SMALL TRADERS |
| – Percent of Open Interest Longs: | 32.0 | 53.0 | 14.2 |
| – Percent of Open Interest Shorts: | 18.7 | 69.3 | 11.3 |
| – Net Position: | 39,251 | -47,893 | 8,642 |
| – Gross Longs: | 94,317 | 156,086 | 41,844 |
| – Gross Shorts: | 55,066 | 203,979 | 33,202 |
| – Long to Short Ratio: | 1.7 to 1 | 0.8 to 1 | 1.3 to 1 |
| NET POSITION TREND: | |||
| – Strength Index Score (3 Year Range Pct): | 100.0 | 0.0 | 100.0 |
| – Strength Index Reading (3 Year Range): | Bullish-Extreme | Bearish-Extreme | Bullish-Extreme |
| NET POSITION MOVEMENT INDEX: | |||
| – 6-Week Change in Strength Index: | 26.5 | -24.3 | 13.6 |
This week’s current strength score (the trader positioning range over the past three years, measured from 0 to 100) shows the speculators are currently Bullish with a score of 77.6 percent. The commercials are Bearish-Extreme with a score of 19.5 percent and the small traders (not shown in chart) are Bullish with a score of 69.4 percent.
Our weekly trend-following model classifies the current market price position as: Uptrend. The current action for the model is considered to be: Hold – Maintain Long Position.
| Russell 2000 Mini Futures Statistics | SPECULATORS | COMMERCIALS | SMALL TRADERS |
| – Percent of Open Interest Longs: | 16.4 | 75.9 | 6.7 |
| – Percent of Open Interest Shorts: | 18.4 | 76.2 | 4.3 |
| – Net Position: | -10,504 | -1,488 | 11,992 |
| – Gross Longs: | 83,470 | 387,387 | 34,014 |
| – Gross Shorts: | 93,974 | 388,875 | 22,022 |
| – Long to Short Ratio: | 0.9 to 1 | 1.0 to 1 | 1.5 to 1 |
| NET POSITION TREND: | |||
| – Strength Index Score (3 Year Range Pct): | 77.6 | 19.5 | 69.4 |
| – Strength Index Reading (3 Year Range): | Bullish | Bearish-Extreme | Bullish |
| NET POSITION MOVEMENT INDEX: | |||
| – 6-Week Change in Strength Index: | 13.9 | -16.3 | 19.6 |
This week’s current strength score (the trader positioning range over the past three years, measured from 0 to 100) shows the speculators are currently Bearish with a score of 39.1 percent. The commercials are Bearish with a score of 47.2 percent and the small traders (not shown in chart) are Bullish with a score of 69.8 percent.
Our weekly trend-following model classifies the current market price position as: Strong Uptrend. The current action for the model is considered to be: Hold – Maintain Long Position.
| Nikkei Stock Average Futures Statistics | SPECULATORS | COMMERCIALS | SMALL TRADERS |
| – Percent of Open Interest Longs: | 11.5 | 63.9 | 24.6 |
| – Percent of Open Interest Shorts: | 34.5 | 52.9 | 12.6 |
| – Net Position: | -3,868 | 1,857 | 2,011 |
| – Gross Longs: | 1,931 | 10,736 | 4,133 |
| – Gross Shorts: | 5,799 | 8,879 | 2,122 |
| – Long to Short Ratio: | 0.3 to 1 | 1.2 to 1 | 1.9 to 1 |
| NET POSITION TREND: | |||
| – Strength Index Score (3 Year Range Pct): | 39.1 | 47.2 | 69.8 |
| – Strength Index Reading (3 Year Range): | Bearish | Bearish | Bullish |
| NET POSITION MOVEMENT INDEX: | |||
| – 6-Week Change in Strength Index: | -10.8 | 0.4 | 23.8 |
This week’s current strength score (the trader positioning range over the past three years, measured from 0 to 100) shows the speculators are currently Bearish with a score of 35.8 percent. The commercials are Bullish with a score of 61.8 percent and the small traders (not shown in chart) are Bearish with a score of 43.9 percent.
Our weekly trend-following model classifies the current market price position as: Uptrend. The current action for the model is considered to be: Hold – Maintain Long Position.
| MSCI EAFE Mini Futures Statistics | SPECULATORS | COMMERCIALS | SMALL TRADERS |
| – Percent of Open Interest Longs: | 7.4 | 89.2 | 3.2 |
| – Percent of Open Interest Shorts: | 14.4 | 83.5 | 2.0 |
| – Net Position: | -29,562 | 24,171 | 5,391 |
| – Gross Longs: | 31,441 | 376,774 | 13,648 |
| – Gross Shorts: | 61,003 | 352,603 | 8,257 |
| – Long to Short Ratio: | 0.5 to 1 | 1.1 to 1 | 1.7 to 1 |
| NET POSITION TREND: | |||
| – Strength Index Score (3 Year Range Pct): | 35.8 | 61.8 | 43.9 |
| – Strength Index Reading (3 Year Range): | Bearish | Bullish | Bearish |
| NET POSITION MOVEMENT INDEX: | |||
| – 6-Week Change in Strength Index: | 8.7 | -11.2 | 12.6 |
Article By InvestMacro – Receive our weekly COT Newsletter
*COT Report: The COT data, released weekly to the public each Friday, is updated through the most recent Tuesday (data is 3 days old) and shows a quick view of how large speculators or non-commercials (for-profit traders) were positioned in the futures markets.
The CFTC categorizes trader positions according to commercial hedgers (traders who use futures contracts for hedging as part of the business), non-commercials (large traders who speculate to realize trading profits) and nonreportable traders (usually small traders/speculators) as well as their open interest (contracts open in the market at time of reporting). See CFTC criteria here.
By InvestMacro Here are the latest charts and statistics for the Commitment of Traders (COT)…
By InvestMacro Here are the latest charts and statistics for the Commitment of Traders (COT)…
By Analytical Department RoboForex Gold fell to 4,033 USD per ounce on Thursday, extending its…
By JustMarkets By the end of the day, the Dow Jones Index (US30) rose by…
By JustMarkets On Tuesday, the US stock indices finished the session in the green, supported…
By Analytical Department RoboForex GBP/USD rose to 1.3403 on Wednesday, with British politics taking centre…
This website uses cookies.