By InvestMacro | COT | Data Tables | COT Leaders | Downloads | COT Newsletter
Here are the latest charts and statistics for the Commitment of Traders (COT) data published by the Commodities Futures Trading Commission (CFTC).
The latest COT data is updated through Tuesday January 25th and shows a quick view of how large traders (for-profit speculators and commercial entities) were positioned in the futures markets.
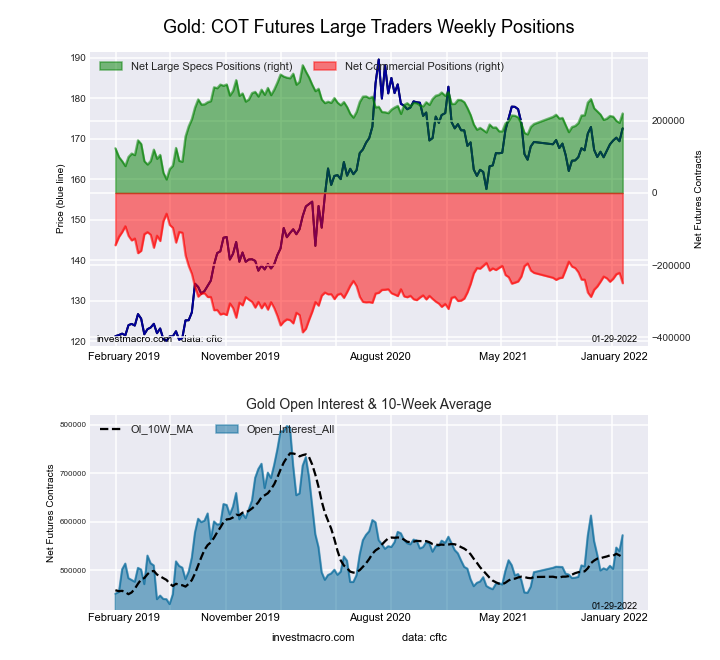
Highlighting the COT metals data is the gains in the Gold futures bets. Gold speculator bullish bets jumped by the most contracts in the past eleven weeks this week following three straight weeks of declines. The gain by +25,944 contracts have more than erased the previous three weeks of losses and has pushed the current net speculator standing to the highest level since November 30th at over +220,000 net contracts.
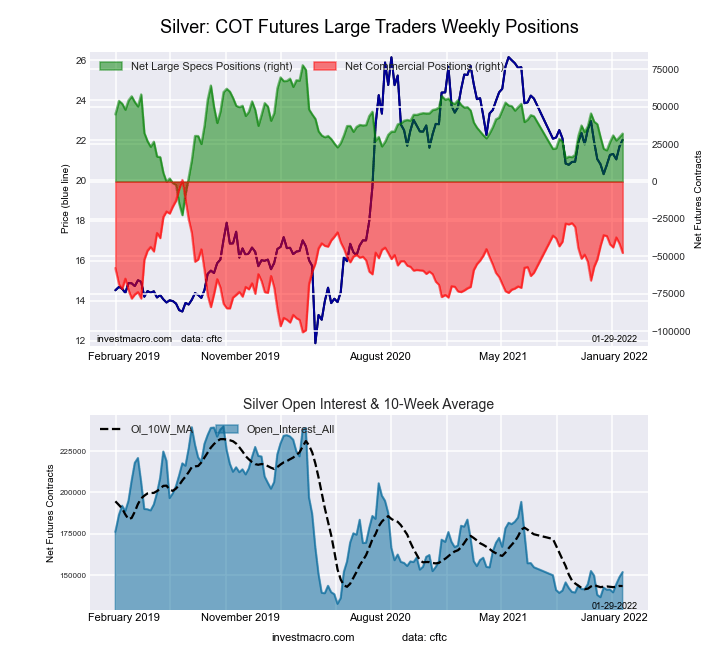
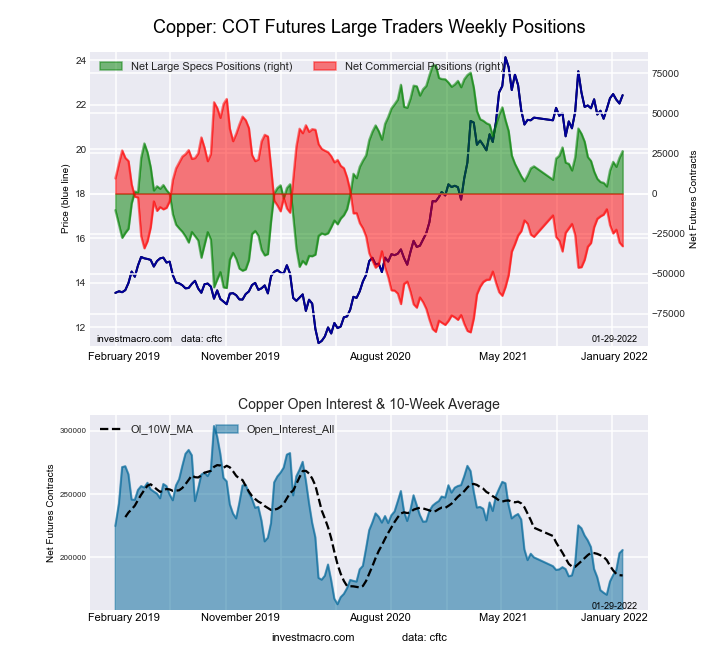
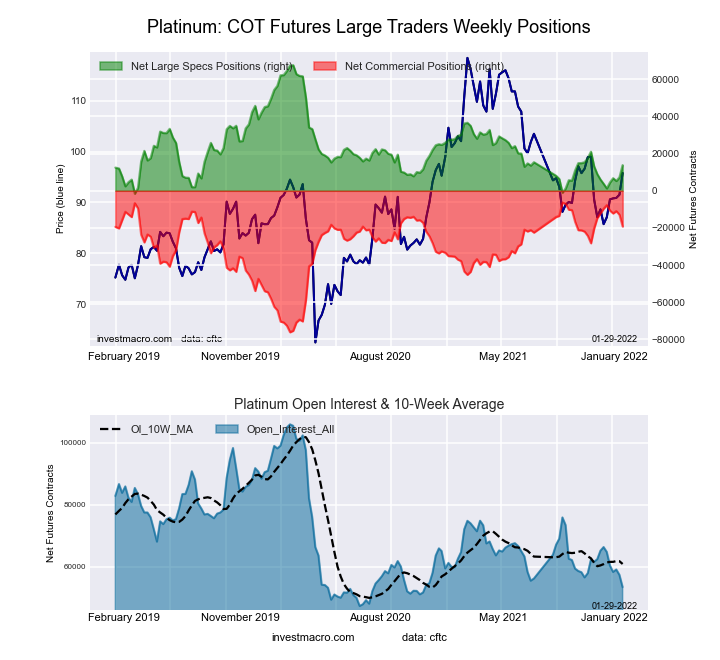
Joining Gold (25,944 contracts) in gaining this week were Silver (2,441 contracts), Copper (4,171 contracts), Platinum (6,563 contracts), Palladium (1,321 contracts).
| Jan-25-2022 | OI | OI-Index | Spec-Net | Spec-Index | Com-Net | COM-Index | Smalls-Net | Smalls-Index |
|---|---|---|---|---|---|---|---|---|
| WTI Crude | 2,095,994 | 35 | 373,415 | 28 | -420,646 | 61 | 47,231 | 82 |
| Gold | 572,078 | 39 | 220,151 | 58 | -249,746 | 41 | 29,595 | 48 |
| Silver | 151,779 | 18 | 32,141 | 54 | -47,684 | 52 | 15,543 | 33 |
| Copper | 205,771 | 30 | 26,481 | 61 | -32,836 | 37 | 6,355 | 62 |
| Palladium | 9,034 | 11 | -1,988 | 10 | 2,274 | 90 | -286 | 28 |
| Platinum | 53,390 | 10 | 13,792 | 22 | -19,227 | 82 | 5,435 | 38 |
| Natural Gas | 1,141,796 | 7 | -124,535 | 41 | 97,541 | 62 | 26,994 | 47 |
| Brent | 224,561 | 59 | -25,936 | 73 | 23,862 | 29 | 2,074 | 37 |
| Heating Oil | 360,969 | 38 | 18,000 | 69 | -40,959 | 28 | 22,959 | 78 |
| Soybeans | 735,966 | 30 | 148,872 | 67 | -112,799 | 39 | -36,073 | 12 |
| Corn | 1,539,124 | 28 | 439,098 | 86 | -389,471 | 16 | -49,627 | 14 |
| Coffee | 274,327 | 40 | 61,643 | 93 | -64,950 | 9 | 3,307 | 11 |
| Sugar | 875,995 | 12 | 121,283 | 62 | -142,972 | 41 | 21,689 | 35 |
| Wheat | 390,266 | 29 | 11,661 | 57 | -3,525 | 37 | -8,136 | 63 |
Free Reports:
This week’s current strength score (the trader positioning range over the past three years, measured from 0 to 100) shows the speculators are currently Bullish with a score of 57.8 percent. The commercials are Bearish with a score of 41.4 percent and the small traders (not shown in chart) are Bearish with a score of 48.2 percent.
| Gold Futures Statistics | SPECULATORS | COMMERCIALS | SMALL TRADERS |
| – Percent of Open Interest Longs: | 54.8 | 22.8 | 8.9 |
| – Percent of Open Interest Shorts: | 16.3 | 66.4 | 3.7 |
| – Net Position: | 220,151 | -249,746 | 29,595 |
| – Gross Longs: | 313,415 | 130,208 | 50,669 |
| – Gross Shorts: | 93,264 | 379,954 | 21,074 |
| – Long to Short Ratio: | 3.4 to 1 | 0.3 to 1 | 2.4 to 1 |
| NET POSITION TREND: | |||
| – Strength Index Score (3 Year Range Pct): | 57.8 | 41.4 | 48.2 |
| – Strength Index Reading (3 Year Range): | Bullish | Bearish | Bearish |
| NET POSITION MOVEMENT INDEX: | |||
| – 6-Week Change in Strength Index: | 5.6 | -5.6 | 1.7 |
This week’s current strength score (the trader positioning range over the past three years, measured from 0 to 100) shows the speculators are currently Bullish with a score of 54.4 percent. The commercials are Bullish with a score of 52.1 percent and the small traders (not shown in chart) are Bearish with a score of 33.4 percent.
| Silver Futures Statistics | SPECULATORS | COMMERCIALS | SMALL TRADERS |
| – Percent of Open Interest Longs: | 42.1 | 33.0 | 18.5 |
| – Percent of Open Interest Shorts: | 20.9 | 64.4 | 8.3 |
| – Net Position: | 32,141 | -47,684 | 15,543 |
| – Gross Longs: | 63,923 | 50,135 | 28,132 |
| – Gross Shorts: | 31,782 | 97,819 | 12,589 |
| – Long to Short Ratio: | 2.0 to 1 | 0.5 to 1 | 2.2 to 1 |
| NET POSITION TREND: | |||
| – Strength Index Score (3 Year Range Pct): | 54.4 | 52.1 | 33.4 |
| – Strength Index Reading (3 Year Range): | Bullish | Bullish | Bearish |
| NET POSITION MOVEMENT INDEX: | |||
| – 6-Week Change in Strength Index: | 10.1 | -11.6 | 9.7 |
This week’s current strength score (the trader positioning range over the past three years, measured from 0 to 100) shows the speculators are currently Bullish with a score of 61.4 percent. The commercials are Bearish with a score of 36.9 percent and the small traders (not shown in chart) are Bullish with a score of 62.0 percent.
| Copper Futures Statistics | SPECULATORS | COMMERCIALS | SMALL TRADERS |
| – Percent of Open Interest Longs: | 38.2 | 39.3 | 9.0 |
| – Percent of Open Interest Shorts: | 25.3 | 55.3 | 5.9 |
| – Net Position: | 26,481 | -32,836 | 6,355 |
| – Gross Longs: | 78,616 | 80,969 | 18,431 |
| – Gross Shorts: | 52,135 | 113,805 | 12,076 |
| – Long to Short Ratio: | 1.5 to 1 | 0.7 to 1 | 1.5 to 1 |
| NET POSITION TREND: | |||
| – Strength Index Score (3 Year Range Pct): | 61.4 | 36.9 | 62.0 |
| – Strength Index Reading (3 Year Range): | Bullish | Bearish | Bullish |
| NET POSITION MOVEMENT INDEX: | |||
| – 6-Week Change in Strength Index: | 14.2 | -13.6 | -0.3 |
This week’s current strength score (the trader positioning range over the past three years, measured from 0 to 100) shows the speculators are currently Bearish with a score of 22.3 percent. The commercials are Bullish-Extreme with a score of 81.5 percent and the small traders (not shown in chart) are Bearish with a score of 37.8 percent.
| Platinum Futures Statistics | SPECULATORS | COMMERCIALS | SMALL TRADERS |
| – Percent of Open Interest Longs: | 51.4 | 31.1 | 14.9 |
| – Percent of Open Interest Shorts: | 25.5 | 67.1 | 4.8 |
| – Net Position: | 13,792 | -19,227 | 5,435 |
| – Gross Longs: | 27,429 | 16,618 | 7,973 |
| – Gross Shorts: | 13,637 | 35,845 | 2,538 |
| – Long to Short Ratio: | 2.0 to 1 | 0.5 to 1 | 3.1 to 1 |
| NET POSITION TREND: | |||
| – Strength Index Score (3 Year Range Pct): | 22.3 | 81.5 | 37.8 |
| – Strength Index Reading (3 Year Range): | Bearish | Bullish-Extreme | Bearish |
| NET POSITION MOVEMENT INDEX: | |||
| – 6-Week Change in Strength Index: | 14.5 | -13.7 | -6.9 |
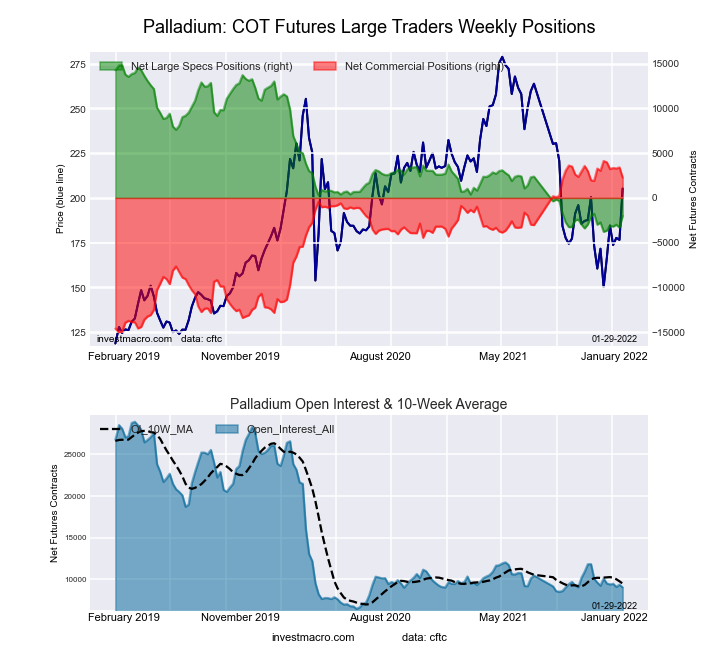
This week’s current strength score (the trader positioning range over the past three years, measured from 0 to 100) shows the speculators are currently Bearish-Extreme with a score of 9.7 percent. The commercials are Bullish-Extreme with a score of 90.1 percent and the small traders (not shown in chart) are Bearish with a score of 27.8 percent.
| Palladium Futures Statistics | SPECULATORS | COMMERCIALS | SMALL TRADERS |
| – Percent of Open Interest Longs: | 31.4 | 52.6 | 12.9 |
| – Percent of Open Interest Shorts: | 53.4 | 27.4 | 16.1 |
| – Net Position: | -1,988 | 2,274 | -286 |
| – Gross Longs: | 2,839 | 4,753 | 1,167 |
| – Gross Shorts: | 4,827 | 2,479 | 1,453 |
| – Long to Short Ratio: | 0.6 to 1 | 1.9 to 1 | 0.8 to 1 |
| NET POSITION TREND: | |||
| – Strength Index Score (3 Year Range Pct): | 9.7 | 90.1 | 27.8 |
| – Strength Index Reading (3 Year Range): | Bearish-Extreme | Bullish-Extreme | Bearish |
| NET POSITION MOVEMENT INDEX: | |||
| – 6-Week Change in Strength Index: | 9.7 | -9.9 | 3.8 |
Article By InvestMacro – Receive our weekly COT Reports by Email
*COT Report: The COT data, released weekly to the public each Friday, is updated through the most recent Tuesday (data is 3 days old) and shows a quick view of how large speculators or non-commercials (for-profit traders) were positioned in the futures markets.
The CFTC categorizes trader positions according to commercial hedgers (traders who use futures contracts for hedging as part of the business), non-commercials (large traders who speculate to realize trading profits) and nonreportable traders (usually small traders/speculators) as well as their open interest (contracts open in the market at time of reporting).See CFTC criteria here.
By JustMarkets The US stock indices ended Friday’s session in the red. By the end…
By Analytical Department RoboForex USD/JPY opens the week at 162.36 on Monday. The Japanese yen…
By InvestMacro Here are the latest charts and statistics for the Commitment of Traders (COT)…
By InvestMacro The latest update for the weekly Commitment of Traders (COT) report was released…
By InvestMacro Here are the latest charts and statistics for the Commitment of Traders (COT)…
By InvestMacro Here are the latest charts and statistics for the Commitment of Traders (COT)…
This website uses cookies.