By InvestMacro | COT | Data Tables | COT Leaders | Downloads | COT Newsletter
Here are the latest charts and statistics for the Commitment of Traders (COT) data published by the Commodities Futures Trading Commission (CFTC).
The latest COT data is updated through Tuesday January 25th and shows a quick view of how large traders (for-profit speculators and commercial entities) were positioned in the futures markets.
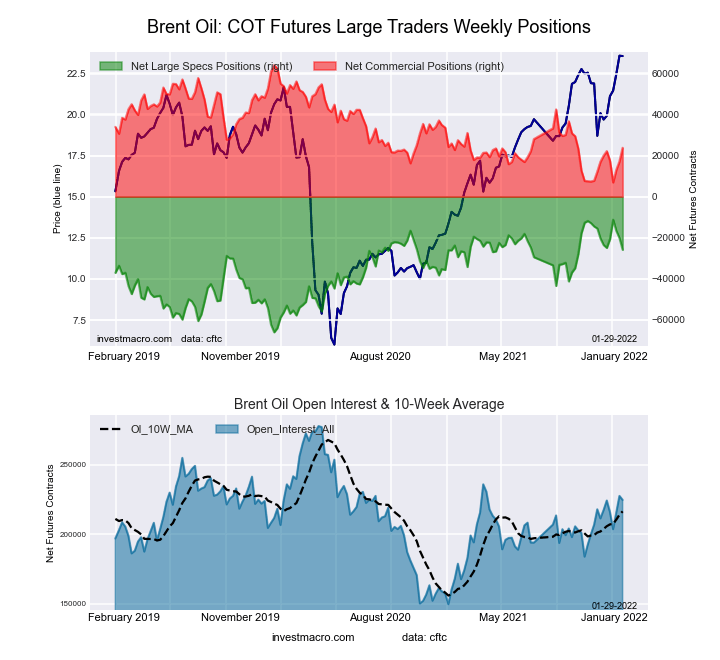
Highlighting the COT energy data is the recent rise in bearish bets for the Brent Crude Oil (last day) futures bets. The speculative net position in the Brent Crude Oil futures has now seen higher bearish positions for three consecutive weeks. This comes after a streak of improving positions that culminated in speculator bets touching the least bearish level in the previous 167 weeks (on January 4th). The overall speculator standing in Brent oil have been in a continuous bearish position since December of 2013 (due to the unique positioning dynamics of the market) but positioning has been less and less bearish with crude oil prices rising in recent months. However, this recent 3-week streak of rising bearish bets brings the Brent net standing to the most bearish of the last fourteen weeks.
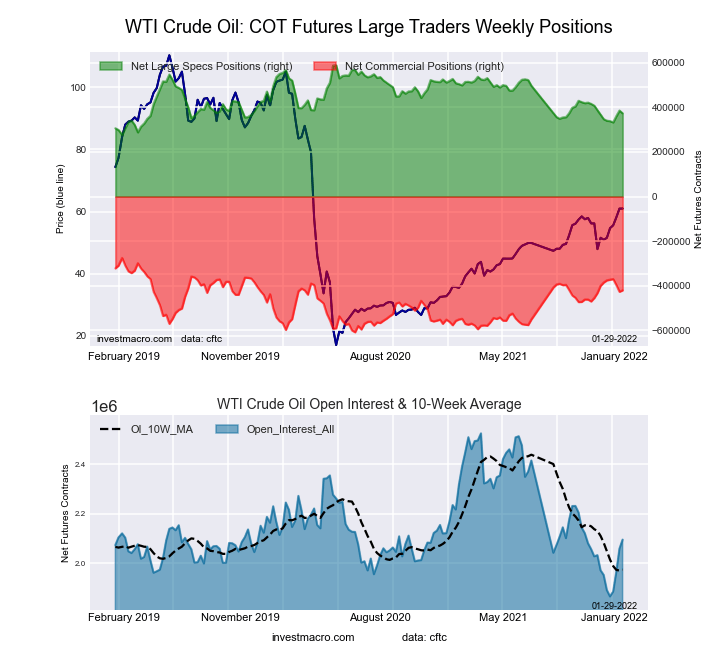
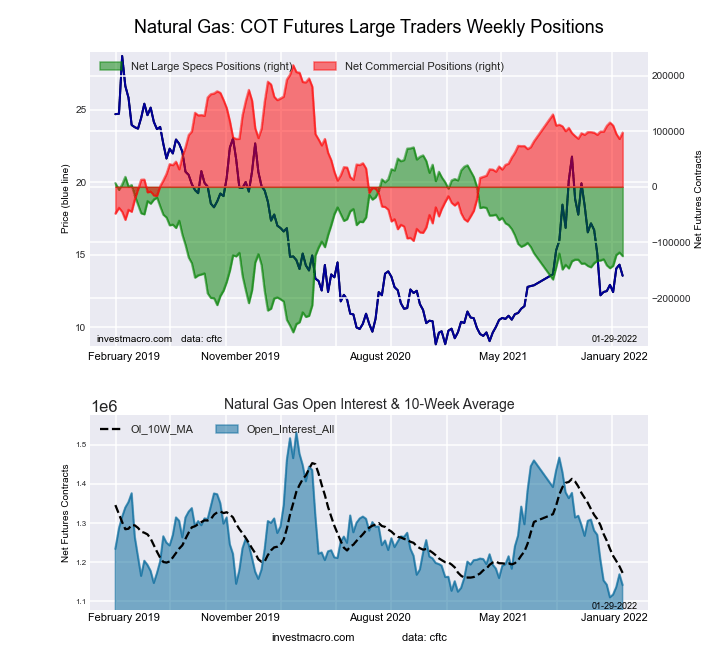
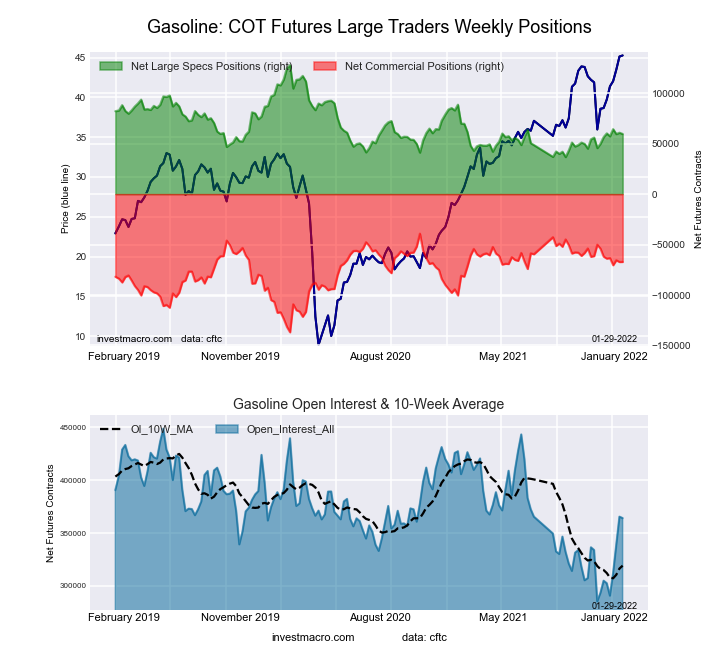
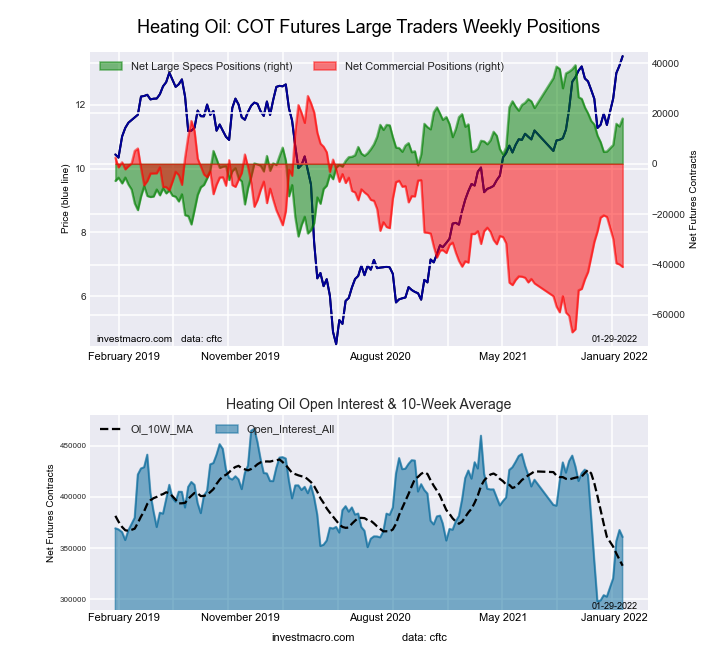
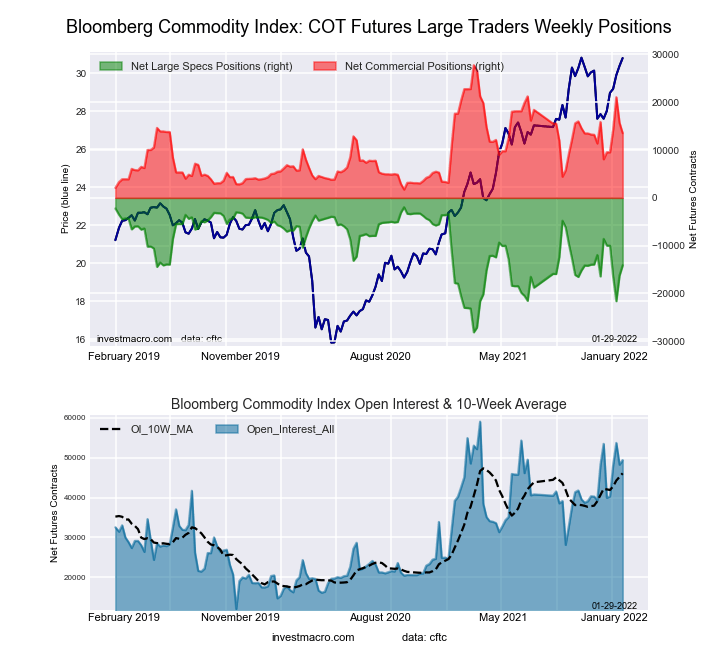
Joining Brent Crude Oil (-5,730 contracts) in falling this week were Natural Gas (-6,488 contracts), WTI Crude Oil (-12,366 contracts) and Gasoline (-1,184 contracts) while Heating Oil (3,173 contracts) and the Bloomberg Commodity Index (2,177 contracts) saw higher bets on the week.
| Jan-25-2022 | OI | OI-Index | Spec-Net | Spec-Index | Com-Net | COM-Index | Smalls-Net | Smalls-Index |
|---|---|---|---|---|---|---|---|---|
| WTI Crude | 2,095,994 | 35 | 373,415 | 28 | -420,646 | 61 | 47,231 | 82 |
| Gold | 572,078 | 39 | 220,151 | 58 | -249,746 | 41 | 29,595 | 48 |
| Silver | 151,779 | 18 | 32,141 | 54 | -47,684 | 52 | 15,543 | 33 |
| Copper | 205,771 | 30 | 26,481 | 61 | -32,836 | 37 | 6,355 | 62 |
| Palladium | 9,034 | 11 | -1,988 | 10 | 2,274 | 90 | -286 | 28 |
| Platinum | 53,390 | 10 | 13,792 | 22 | -19,227 | 82 | 5,435 | 38 |
| Natural Gas | 1,141,796 | 7 | -124,535 | 41 | 97,541 | 62 | 26,994 | 47 |
| Brent | 224,561 | 59 | -25,936 | 73 | 23,862 | 29 | 2,074 | 37 |
| Heating Oil | 360,969 | 38 | 18,000 | 69 | -40,959 | 28 | 22,959 | 78 |
| Soybeans | 735,966 | 30 | 148,872 | 67 | -112,799 | 39 | -36,073 | 12 |
| Corn | 1,539,124 | 28 | 439,098 | 86 | -389,471 | 16 | -49,627 | 14 |
| Coffee | 274,327 | 40 | 61,643 | 93 | -64,950 | 9 | 3,307 | 11 |
| Sugar | 875,995 | 12 | 121,283 | 62 | -142,972 | 41 | 21,689 | 35 |
| Wheat | 390,266 | 29 | 11,661 | 57 | -3,525 | 37 | -8,136 | 63 |
Free Reports:
This week’s current strength score (the trader positioning range over the past three years, measured from 0 to 100) shows the speculators are currently Bearish with a score of 28.3 percent. The commercials are Bullish with a score of 60.7 percent and the small traders (not shown in chart) are Bullish-Extreme with a score of 81.6 percent.
| WTI Crude Oil Futures Statistics | SPECULATORS | COMMERCIALS | SMALL TRADERS |
| – Percent of Open Interest Longs: | 23.5 | 35.8 | 4.7 |
| – Percent of Open Interest Shorts: | 5.7 | 55.8 | 2.4 |
| – Net Position: | 373,415 | -420,646 | 47,231 |
| – Gross Longs: | 492,310 | 749,821 | 98,250 |
| – Gross Shorts: | 118,895 | 1,170,467 | 51,019 |
| – Long to Short Ratio: | 4.1 to 1 | 0.6 to 1 | 1.9 to 1 |
| NET POSITION TREND: | |||
| – Strength Index Score (3 Year Range Pct): | 28.3 | 60.7 | 81.6 |
| – Strength Index Reading (3 Year Range): | Bearish | Bullish | Bullish-Extreme |
| NET POSITION MOVEMENT INDEX: | |||
| – 6-Week Change in Strength Index: | 8.7 | -11.3 | 12.5 |
This week’s current strength score (the trader positioning range over the past three years, measured from 0 to 100) shows the speculators are currently Bullish with a score of 73.3 percent. The commercials are Bearish with a score of 29.5 percent and the small traders (not shown in chart) are Bearish with a score of 37.3 percent.
| Brent Crude Oil Futures Statistics | SPECULATORS | COMMERCIALS | SMALL TRADERS |
| – Percent of Open Interest Longs: | 17.8 | 44.2 | 4.1 |
| – Percent of Open Interest Shorts: | 29.3 | 33.6 | 3.2 |
| – Net Position: | -25,936 | 23,862 | 2,074 |
| – Gross Longs: | 39,888 | 99,224 | 9,298 |
| – Gross Shorts: | 65,824 | 75,362 | 7,224 |
| – Long to Short Ratio: | 0.6 to 1 | 1.3 to 1 | 1.3 to 1 |
| NET POSITION TREND: | |||
| – Strength Index Score (3 Year Range Pct): | 73.3 | 29.5 | 37.3 |
| – Strength Index Reading (3 Year Range): | Bullish | Bearish | Bearish |
| NET POSITION MOVEMENT INDEX: | |||
| – 6-Week Change in Strength Index: | -4.2 | 6.7 | -20.4 |
This week’s current strength score (the trader positioning range over the past three years, measured from 0 to 100) shows the speculators are currently Bearish with a score of 41.2 percent. The commercials are Bullish with a score of 61.6 percent and the small traders (not shown in chart) are Bearish with a score of 47.4 percent.
| Natural Gas Futures Statistics | SPECULATORS | COMMERCIALS | SMALL TRADERS |
| – Percent of Open Interest Longs: | 20.5 | 42.7 | 4.5 |
| – Percent of Open Interest Shorts: | 31.4 | 34.1 | 2.2 |
| – Net Position: | -124,535 | 97,541 | 26,994 |
| – Gross Longs: | 233,870 | 487,342 | 51,865 |
| – Gross Shorts: | 358,405 | 389,801 | 24,871 |
| – Long to Short Ratio: | 0.7 to 1 | 1.3 to 1 | 2.1 to 1 |
| NET POSITION TREND: | |||
| – Strength Index Score (3 Year Range Pct): | 41.2 | 61.6 | 47.4 |
| – Strength Index Reading (3 Year Range): | Bearish | Bullish | Bearish |
| NET POSITION MOVEMENT INDEX: | |||
| – 6-Week Change in Strength Index: | 1.7 | -0.5 | -10.1 |
This week’s current strength score (the trader positioning range over the past three years, measured from 0 to 100) shows the speculators are currently Bearish with a score of 30.8 percent. The commercials are Bullish with a score of 69.8 percent and the small traders (not shown in chart) are Bullish with a score of 56.9 percent.
| Nasdaq Mini Futures Statistics | SPECULATORS | COMMERCIALS | SMALL TRADERS |
| – Percent of Open Interest Longs: | 29.2 | 49.2 | 6.1 |
| – Percent of Open Interest Shorts: | 12.8 | 67.6 | 4.0 |
| – Net Position: | 59,605 | -67,195 | 7,590 |
| – Gross Longs: | 106,361 | 179,168 | 22,300 |
| – Gross Shorts: | 46,756 | 246,363 | 14,710 |
| – Long to Short Ratio: | 2.3 to 1 | 0.7 to 1 | 1.5 to 1 |
| NET POSITION TREND: | |||
| – Strength Index Score (3 Year Range Pct): | 30.8 | 69.8 | 56.9 |
| – Strength Index Reading (3 Year Range): | Bearish | Bullish | Bullish |
| NET POSITION MOVEMENT INDEX: | |||
| – 6-Week Change in Strength Index: | 3.2 | -5.3 | 12.5 |
This week’s current strength score (the trader positioning range over the past three years, measured from 0 to 100) shows the speculators are currently Bullish with a score of 68.9 percent. The commercials are Bearish with a score of 27.6 percent and the small traders (not shown in chart) are Bullish with a score of 77.9 percent.
| Heating Oil Futures Statistics | SPECULATORS | COMMERCIALS | SMALL TRADERS |
| – Percent of Open Interest Longs: | 16.8 | 49.8 | 13.9 |
| – Percent of Open Interest Shorts: | 11.8 | 61.2 | 7.5 |
| – Net Position: | 18,000 | -40,959 | 22,959 |
| – Gross Longs: | 60,678 | 179,923 | 50,189 |
| – Gross Shorts: | 42,678 | 220,882 | 27,230 |
| – Long to Short Ratio: | 1.4 to 1 | 0.8 to 1 | 1.8 to 1 |
| NET POSITION TREND: | |||
| – Strength Index Score (3 Year Range Pct): | 68.9 | 27.6 | 77.9 |
| – Strength Index Reading (3 Year Range): | Bullish | Bearish | Bullish |
| NET POSITION MOVEMENT INDEX: | |||
| – 6-Week Change in Strength Index: | 19.5 | -21.8 | 25.0 |
This week’s current strength score (the trader positioning range over the past three years, measured from 0 to 100) shows the speculators are currently Bullish with a score of 53.6 percent. The commercials are Bearish with a score of 45.4 percent and the small traders (not shown in chart) are Bearish with a score of 39.5 percent.
| Bloomberg Index Futures Statistics | SPECULATORS | COMMERCIALS | SMALL TRADERS |
| – Percent of Open Interest Longs: | 65.3 | 28.6 | 1.2 |
| – Percent of Open Interest Shorts: | 93.9 | 1.2 | 0.1 |
| – Net Position: | -14,100 | 13,537 | 563 |
| – Gross Longs: | 32,288 | 14,137 | 596 |
| – Gross Shorts: | 46,388 | 600 | 33 |
| – Long to Short Ratio: | 0.7 to 1 | 23.6 to 1 | 18.1 to 1 |
| NET POSITION TREND: | |||
| – Strength Index Score (3 Year Range Pct): | 53.6 | 45.4 | 39.5 |
| – Strength Index Reading (3 Year Range): | Bullish | Bearish | Bearish |
| NET POSITION MOVEMENT INDEX: | |||
| – 6-Week Change in Strength Index: | -21.1 | 21.0 | 1.8 |
Article By InvestMacro – Receive our weekly COT Reports by Email
*COT Report: The COT data, released weekly to the public each Friday, is updated through the most recent Tuesday (data is 3 days old) and shows a quick view of how large speculators or non-commercials (for-profit traders) were positioned in the futures markets.
The CFTC categorizes trader positions according to commercial hedgers (traders who use futures contracts for hedging as part of the business), non-commercials (large traders who speculate to realize trading profits) and nonreportable traders (usually small traders/speculators) as well as their open interest (contracts open in the market at time of reporting).See CFTC criteria here.
By JustMarkets The US stock indices ended Friday’s session in the red. By the end…
By Analytical Department RoboForex USD/JPY opens the week at 162.36 on Monday. The Japanese yen…
By InvestMacro Here are the latest charts and statistics for the Commitment of Traders (COT)…
By InvestMacro The latest update for the weekly Commitment of Traders (COT) report was released…
By InvestMacro Here are the latest charts and statistics for the Commitment of Traders (COT)…
By InvestMacro Here are the latest charts and statistics for the Commitment of Traders (COT)…
This website uses cookies.