WTI oil prices have collapsed below 80 dollars per barrel

By JustMarkets

On Tuesday, the US stock market showed mixed dynamics caused by large‑scale profit‑taking in the artificial intelligence sector. By the end of the day, the Dow Jones Index (US30) rose by 0.64%. The S&P 500 Index (US500) fell by 0.57%. The Technology Index NASDAQ (US100) closed lower by 1.89%. Chipmakers suffered significant losses: Intel plunged by 8.5%, AMD by 7.3%, Micron by 6.2%, while Broadcom and Nvidia declined by 4.4% and 2.4%. At the same time, SpaceX shares rose by 4.8%, extending their gains after last Friday’s IPO on news of a planned acquisition of Cursor for 60 billion dollars. Additional support for the market came from declining government bond yields, triggered by falling oil prices, which noticeably eased investors’ inflation fears. This occurred ahead of the June Federal Reserve meeting, where rates are expected to remain unchanged, although analysts do not rule out hawkish rhetoric from Fed Chair Warsh regarding further balance sheet reduction.

European indices closed in the green yesterday. By the end of the day, Germany’s DAX (DE40) rose by 0.07%, France’s CAC 40 (FR40) closed up by 0.75%, Spain’s IBEX 35 (ES35) gained 0.69%, and the UK’s FTSE 100 (UK100) ended the session higher by 0.61%. Investor sentiment remained supported by expectations of a peace agreement with Iran and the resumption of safe navigation in the Strait of Hormuz.

Palladium (XPD) prices stabilized near 1,350 dollars per ounce after reaching an eight‑month low, supported by easing Middle East tensions and short‑covering. Precious metals were also positively influenced by declining US Treasury yields. Despite a monthly decline of 3.84%, palladium prices still exceed last year’s level by 30.39%. Market participants are now assessing supply risks, demand prospects from the automotive sector, and awaiting a series of central bank meetings.

On Tuesday, crude oil prices (WTI) recorded a sharp drop of more than 6%, pushing the price per barrel down to 75.5 dollars – the lowest level since early March. This decline almost completely erased the previous rally triggered by the Middle East conflict, amid news of the imminent restoration of exports from Persian Gulf countries. The easing of tensions is supported by the likely signing of a memorandum between the US and Iran, which will ensure unimpeded tanker passage through the Strait of Hormuz. At the same time, US strategic reserves have fallen to their lowest level in 43 years. Meanwhile, Iranian supplies will most likely be directed toward replenishing China’s depleted inventories.

The US natural gas prices (XNG) increased by more than 2%, reaching 3.2 dollars per MMBtu and showing positive dynamics for the third consecutive day. The main drivers of growth were fexpectations of hot weather, expected to remain above seasonal norms until early July, forcing power plants to increase fuel consumption to support air‑conditioning demand.

On Tuesday, Japan’s Nikkei 225 (JP225) rose sharply by 0.13%, China’s FTSE China A50 closed lower by 0.81%, Hong Kong’s Hang Seng (HK50) fell by 1.40%, and Australia’s ASX 200 (AU200) closed higher by 0.04%.

The Australian dollar (AUD) consolidated above 0.70 USD, continuing its recovery after a two‑month low. This was supported by the hawkish stance of the Reserve Bank of Australia (RBA): despite keeping the base rate at 4.35% at the June meeting, Governor Michele Bullock emphasized that inflation risks remain high and demand must slow further. Although the RBA paused to assess the impact of the previous three rate hikes, Bullock did not rule out further monetary tightening. The central bank’s hawkish tone led investors to price in a 50% probability of another rate hike by the end of the year.

S&P 500 (US500) 7,511.35 -42.94 (-0.57%)

Dow Jones (US30) 51,999.67 +328.64 (+0.64%)

DAX (DE40) 24,910.41 +16.40 (+0.07%)

FTSE 100 (UK100) 10,494.21 +63.59 (+0.61%)

USD Index 99.57 -0.07 (-0.07%)

News feed for: 2026.06.17

  • Japan Trade Balance (m/m) at 02:50 (GMT+3) – JPY (LOW)
  • UK Consumer Price Index (m/m) at 09:00 (GMT+3) – GBP, UK100 (HIGH)
  • UK Producer Price Index (m/m) at 09:00 (GMT+3) – GBP, UK100 (MED)
  • Sweden Riksbank Rate Decision at 10:30 (GMT+3) – SEK (HIGH)
  • Eurozone Consumer Price Index (m/m) at 12:00 (GMT+3) – EUR (HIGH)
  • US Retail Sales (m/m) at 15:30 (GMT+3) – USD (MED)
  • US Crude Oil Reserves (w/w) at 17:30 (GMT+3) – WTI, BRENT (HIGH)
  • US Federal Funds Rate at 21:00 (GMT+3) – USD, XAU, US indices (HIGH)
  • US FOMC Economic Projections at 21:00 (GMT+3) – USD, XAU, US indices (HIGH)
  • US FOMC Statement at 21:00 (GMT+3) – USD, XAU, US indices (HIGH)
  • US FOMC Press Conference at 21:30 (GMT+3) – USD, XAU, US indices (HIGH)

By JustMarkets


This article reflects a personal opinion and should not be interpreted as an investment advice, and/or offer, and/or a persistent request for carrying out financial transactions, and/or a guarantee, and/or a forecast of future events.

Gold Surges 2% Since Week Opening Amid Geopolitical Shifts and Fed Expectations

By RoboForex Analytical Department

On Wednesday, spot gold (XAUUSD) hovered near 4,342 USD per troy ounce, logging a solid gain of over 2% since the beginning of the trading week. The precious metal continues to find strong fundamental support as global market participants increasingly price in a potential landmark peace agreement between the United States and Iran.

The geopolitical breakthrough is expected to lead to the full restoration of oil shipments via the strategic Strait of Hormuz, substantially lowering broader market anxieties regarding a renewed global inflationary spiral. Analysts anticipate that both nations will sign an interim accord in Switzerland as early as Friday. Preliminary details suggest the document encompasses major economic concessions for Iran, most notably the lifting of restrictions on crude oil exports.

In parallel to geopolitical developments, global investors remain intensely focused on the upcoming Federal Reserve monetary policy conclusion. While the market is almost fully pricing in unchanged interest rates, significant attention will be dedicated to the forward guidance and press conference delivered by the newly appointed Fed Chair, Kevin Warsh. His perspective on the future trajectory of monetary policy will be vital in setting expectations for the remainder of the year.

It is worth noting that other major central banks have already delivered their decisions this week. The Reserve Bank of Australia (RBA) opted to maintain its benchmark cash rate at 4.35%. In contrast, the Bank of Japan (BoJ) delivered a historic 25-basis-point hike, pushing its key policy rate to 1.0%—the highest level recorded since 1995.

For the gold market, the primary macroeconomic drivers continue to revolve around global central bank rate expectations, the performance of the US Dollar, and the fluid situation surrounding the US-Iran accord. Should geopolitical tensions continue to dissipate, investor focus is highly likely to pivot entirely back to the Federal Reserve’s policy roadmap and long-term global inflation projections.

XAU/USD Technical Analysis


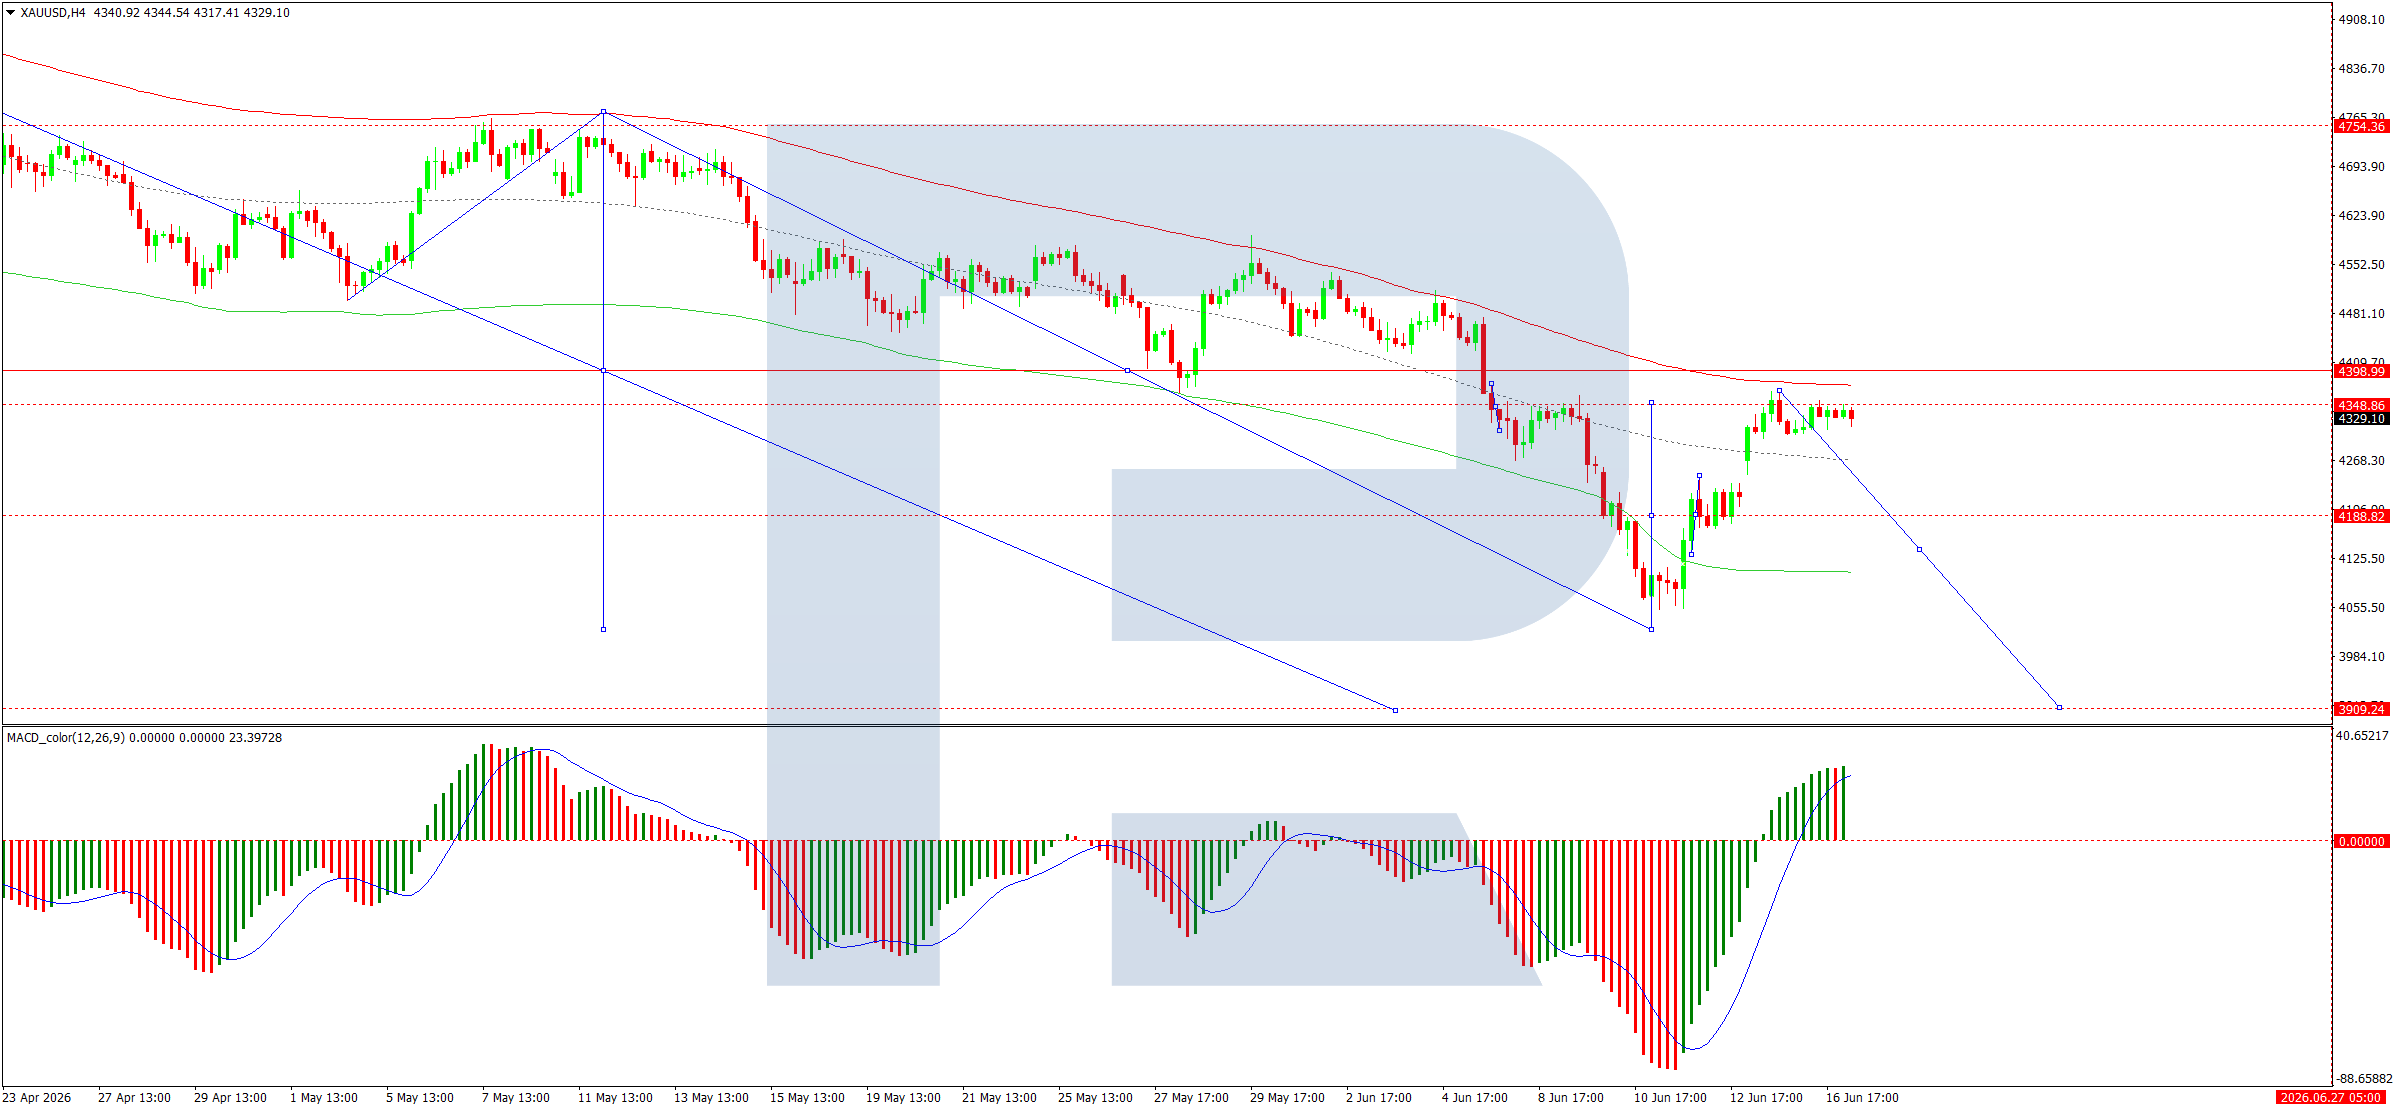
On the 4-hour chart, the XAUUSD pair has developed a distinct consolidation range centered around the 4,343 baseline level. The immediate tactical outlook projects a downside breakout from this range, targeting an initial drop toward 4,188.

Following the completion of this wave, the market may see a corrective recovery wave pointing to 4,277, before resuming its primary downtrend toward 4,088. The overarching trend continuation target sits at the psychological level of 4,000.

Technical Confirmation: The MACD indicator heavily supports this downward momentum. Its signal line is currently positioned at local highs well above the zero baseline and is pointing firmly downward, confirming a dominant bearish momentum.

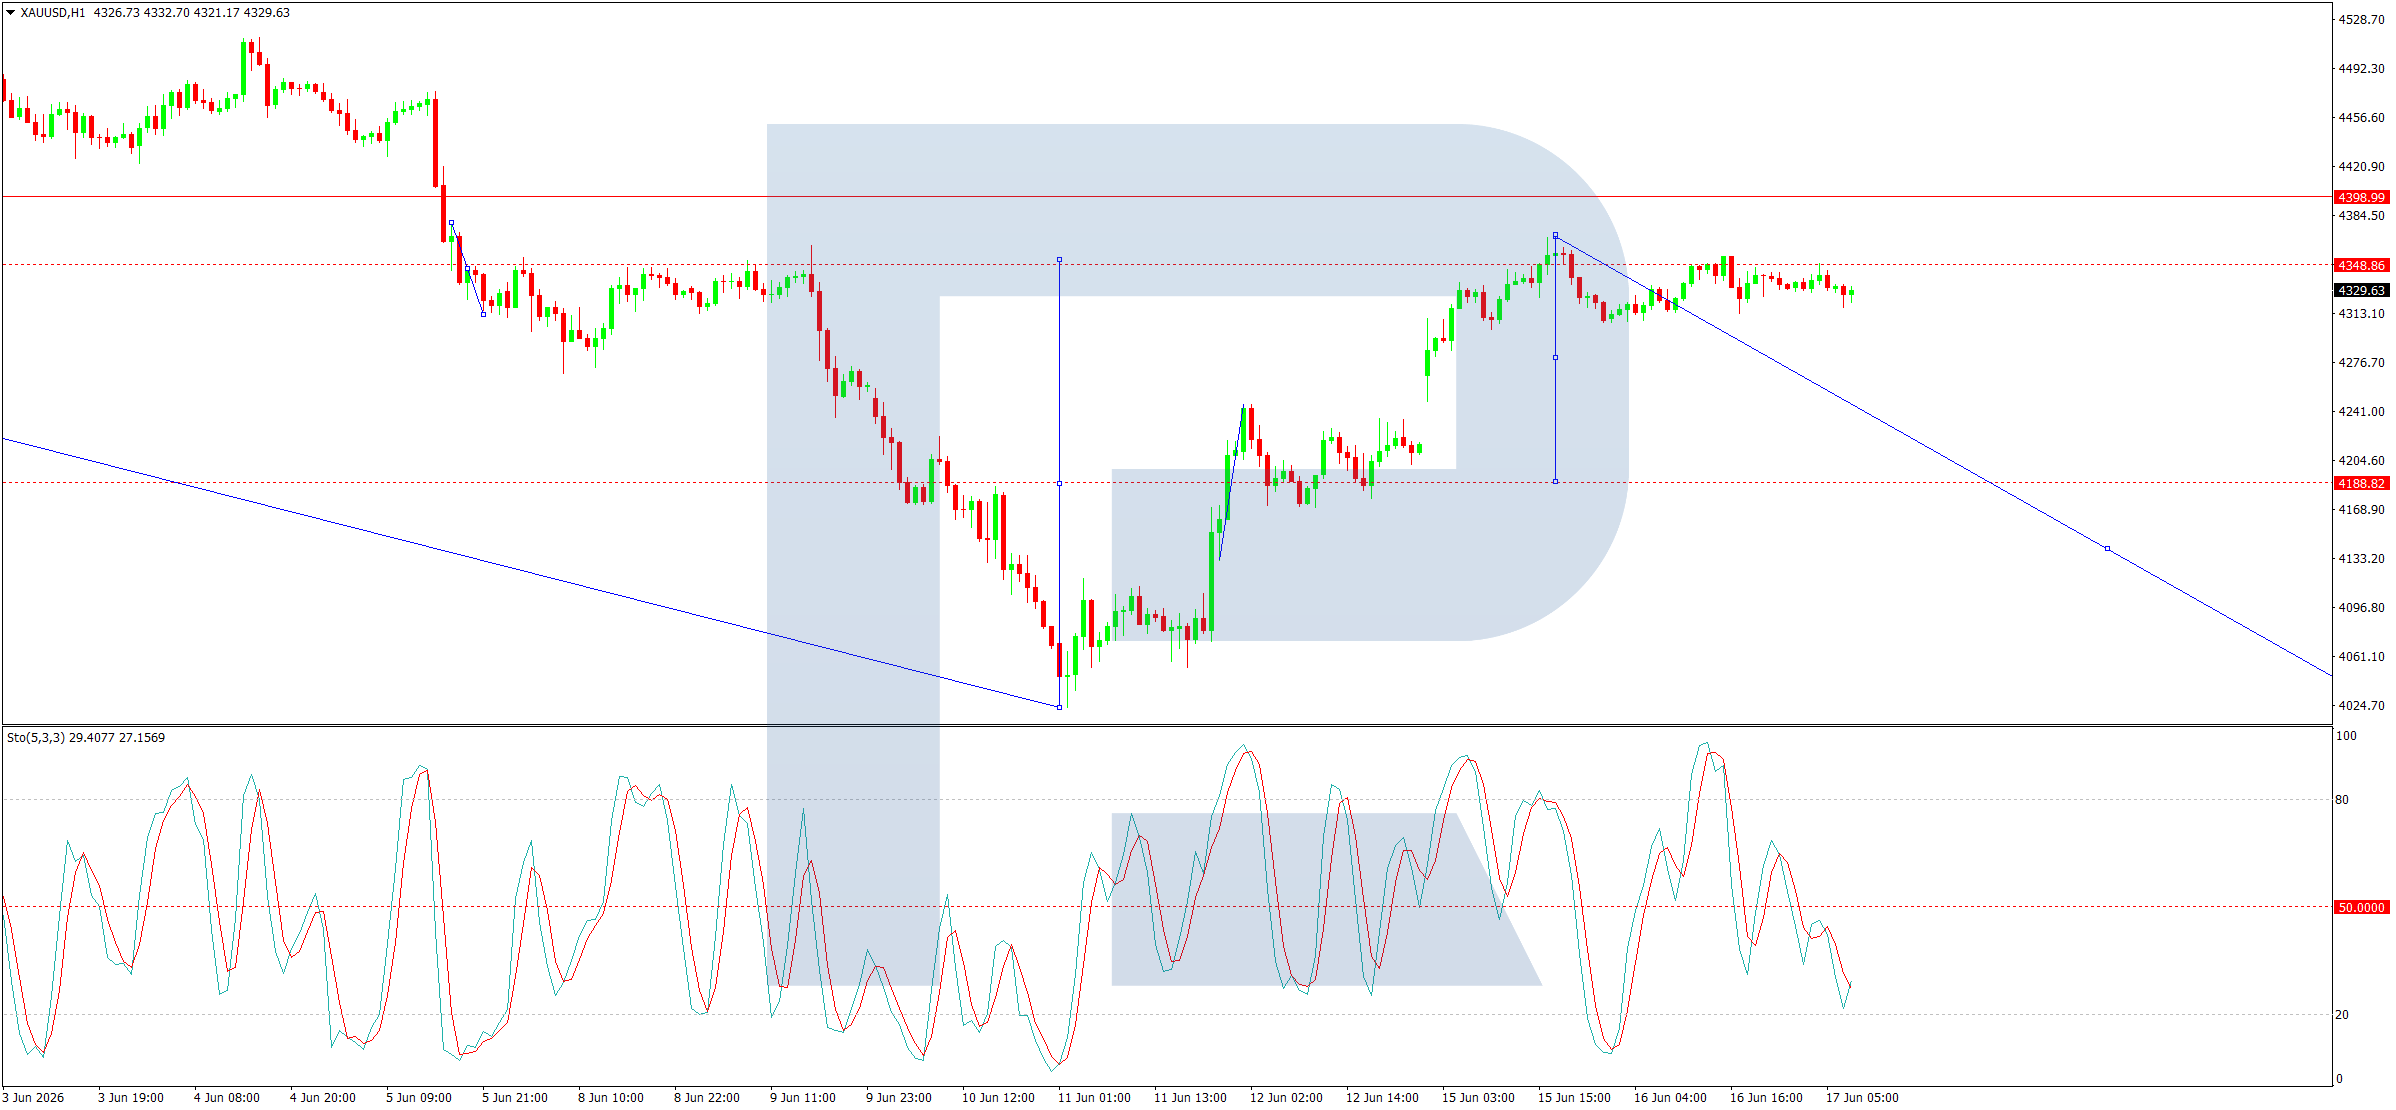
On the 1-hour chart, the market has successfully breached the support baseline at 4,348 downward, completing an initial wave of decline toward the 4,308 mark. Looking forward, the intraday bias favors a brief corrective bounce toward 4,354 to test the broken level from below.

Following this potential retest, a continuation of the bearish structure is expected to target 4,188, with a subsequent corrective growth expected back to 4,270.

Technical Confirmation: This intraday scenario is further validated by the Stochastic oscillator, where the signal line remains suppressed below the 50 median mark and continues to face selling pressure, pointing down toward the 20 oversold threshold.


Disclaimer

Any forecasts contained herein are based on the author’s particular opinion. This analysis may not be treated as trading advice. RoboForex bears no responsibility for trading results based on trading recommendations and reviews contained herein.

Your Bourse and FXPRIMUS Bring 24/7 Synthetic Indices to the Global Broker Market

Your Bourse and FXPRIMUS today announced a strategic partnership to bring Synthetic Indices, algorithmically generated always-on trading instruments, to brokers operating within the Your Bourse network. Delivered through the existing Your Bourse bridge as standard CFD symbols, the product gives brokers a fully operational 24/7 trading environment without requiring any changes to their current platform setup or client operations.

This new partnership enables brokers to launch always-on synthetic trading products through existing platform infrastructure without platform migration, white-label rebuilding, or client relationship transfer.

Trading Does Not Stop When Markets Close

Retail trading behaviour has changed. A new generation of traders, particularly across Africa, Southeast Asia, and Latin America, expects markets to be available whenever they are. Traditional brokerage products have not kept pace. FX and CFD instruments remain tied to institutional market hours, leaving brokers commercially inactive for more than 130 hours every week: every evening, all weekend, and every public holiday.

For brokers serving emerging market clients, that gap is not marginal. It is the primary trading window for many of their clients. Traders who work during market hours and want to trade evenings and weekends have to go somewhere else. Most of them find somewhere.

“For years, brokers have accepted that certain periods of the trading week naturally produce lower levels of client activity. We do not believe that has to remain the case. Synthetic Indices allow brokers to remain relevant whenever their traders are active, not only when traditional markets are open. Through this partnership with Your Bourse, brokers can launch a proven 24/7 trading environment quickly, while maintaining full ownership of their clients, data, and operations,” said George Neophytou, Head of Global Sales at FXPRIMUS.

A New Standard for Always-On Trading

Synthetic Indices are continuously tradable CFD instruments whose prices are generated by independently audited random number generation systems, operating entirely independently of external markets, economic data, or geopolitical events. They are not influenced by earnings announcements, central bank decisions, or exchange trading hours. They do not close on weekends. They do not gap on Monday morning.

The FXPRIMUS synthetic suite includes four series, each built around a distinct trading profile. The Dynamic series, available at four volatility levels, replicates real-market price volatility behaviour with consistent one-second tick intervals. The Pace series offers step-based, structured price movement across five intensity levels. The Smash and Boost series generate sharp moves at approximate tick intervals. The Bounce series delivers short bursts of high-speed movement.

Every instrument is compatible with all major retail trading platforms and supports standard order types: market orders, stop losses, take profits, pending orders, and automated trading strategies. From the trader’s perspective, they behave like any other symbol on the platform.

Turning Inactive Hours Into Revenue

The commercial case for brokers is direct. Synthetic Indices run when everything else is closed. Spread income is generated across every session, every evening, and every weekend, without increasing client acquisition spend or adding operational overhead. For brokers with significant client bases in emerging markets, the product also addresses a growing retention challenge: clients who cannot find activity on their platform at the times they are most available tend to find it elsewhere.

For introducing broker networks in Africa and Southeast Asia, the advantage is particularly tangible. Synthetic Indices can be demonstrated live at any hour: in a Sunday webinar, a Telegram community session, a WhatsApp group, or a YouTube livestream. No other instrument category offers this. In markets where IB-led distribution through social communities drives the majority of client acquisition, an always-demonstrable product represents a genuine competitive shift.

“Your Bourse has always focused on reducing the complexity involved in accessing new products and infrastructure. This partnership extends that philosophy into one of the fastest-growing areas of retail trading. A 24/7 trading product requires infrastructure that can support it beyond the traditional 24/5 market schedule. Through Your Bourse bridge technology, matching engine performance, 24/7 operations, and minimal maintenance disruption, brokers can activate a complete Synthetic Indices environment through their existing bridge setup without rebuilding their technology stack or disrupting existing operations. The commercial opportunity, particularly for brokers serving emerging market clients, is significant,” said Kate Rutkovskaya, Chief Revenue Officer at Your Bourse.

Infrastructure

The partnership is designed as a product infrastructure layer. FXPRIMUS provides the synthetic pricing feed and product ecosystem. Your Bourse provides the bridge technology, matching engine, and integration layer. Brokers activate the product through their existing infrastructure: no platform migration, no white-label rebuild, and no client account transfer.

Because Synthetic Indices are available outside the standard FX trading week, including weekends and public holidays, the supporting infrastructure must also remain available beyond the traditional 24/5 market schedule. Your Bourse supports brokers with bridge connectivity, matching engine performance, 24/7 operations, and minimal maintenance disruption, helping brokers deliver the product when traditional markets and many standard support models are inactive.

Broker partners retain full ownership of their client relationships, trading accounts, data, deposits, and commercial operations. FXPRIMUS acts solely as the synthetic pricing provider. As the FXPRIMUS product ecosystem expands, brokers may also gain access to custom synthetic indices developed for their own client base and trading environment.

Activation timelines are measured in days. Configuration of leverage, symbols, spreads, and trading parameters is handled through the existing bridge framework.

Broker Enquiries

Brokers operating through the Your Bourse ecosystem can register interest immediately. To schedule a product demonstration or discuss commercial terms, contact: [email protected]

To learn more about 24/7 synthetic indices delivered through Your Bourse bridge infrastructure, visit: https://synthetics.fxprimus.com/

Join our webinar on 2 July at 5:00 PM GMT+3 where FXPRIMUS will join the conversation on the shift toward 24/7 trading and how always-on markets are changing expectations across the brokerage industry.

The FXPrimus team will also be attending the FX Dealer Academy Community Event in Limassol on 17 June, where attendees will be able to learn more and receive access to a live synthetic indices demo account.

Register for the launch webinar → https://bit.ly/4ooPja9

Register for the FXDA Community Event → https://luma.com/4wlsbdnt

About FXPRIMUS

This product is offered by Primus Markets INTL LTD | Registered in the Republic of Vanuatu, Registration No. 014595 | Authorised and regulated by the Vanuatu Financial Services Commission (VFSC), Licence No. 14595.

This communication is directed exclusively at licensed brokers and professional counterparties. Not intended for retail investors. www.fxprimus.com

About Your Bourse

Your Bourse is a trading infrastructure provider serving the global brokerage industry. Its technology connects broker environments to liquidity providers, pricing infrastructure, and trading technology integrations across multiple jurisdictions worldwide.

Institutional investors continue to reduce their presence in metals

By JustMarkets 

The US stock indices closed with a sharp surge amid the official signing of a peace agreement between the United States and Iran. The diplomatic breakthrough and the imminent unblocking of the Strait of Hormuz sent oil prices down by 5%, instantly easing global business inflation concerns. By the end of the day, the Dow Jones Index (US30) rose by 0.92%. The S&P 500 Index (US500) gained 1.65%. The Technology Index NASDAQ (US100) closed higher by 3.06%.

The drop in energy prices triggered a powerful inflow of capital into sectors directly dependent on fuel costs. The transport sector and the travel industry became the growth leaders: United Airlines shares rose by 3.9%, Norwegian Cruise Line gained 3.7%, and Carnival Corp. strengthened by 3.2%. Elon Musk’s space giant continues to rewrite records after its Friday debut. The company’s shares jumped another 15%, consolidating around 185 dollars per share and pushing SpaceX’s market capitalization to an unprecedented 2.3 trillion dollars. The main outsider of the day was the media group Fox Corp., whose shares collapsed by 17%. Investors reacted extremely negatively to the official announcement of the acquisition of the streaming platform Roku for 22 billion dollars. The market considered the deal price significantly overvalued.

European indices closed mixed on Monday. By the end of the day, Germany’s DAX (DE40) rose by 1.05%, France’s CAC 40 (FR40) closed up by 0.40%, Spain’s IBEX 35 (ES35) gained 1.43%, while the UK’s FTSE 100 (UK100) ended the session lower by 0.39%.

The main beneficiary of the Middle East de-escalation was Europe’s real sector. Since the European region critically depends on hydrocarbon imports, the collapse in oil prices (which fell below 80 dollars per barrel on Monday) removed market fears of a prolonged energy crisis. The strongest upward dynamics were demonstrated by shares of automotive manufacturers and airlines, whose costs are directly tied to fuel prices. Investors are encouraged by the prospect of a full unblocking of the Strait of Hormuz, which will begin immediately after the memorandum is signed in Switzerland this Friday. Under the terms of the agreement, the United States will lift the naval blockade of Iranian ports, and Iran will be obliged to fully clear the strait’s waters of deployed naval mines.

The Swiss franc (CHF) showed a confident rebound, strengthening to 0.79 francs per US dollar and recovering from a two‑month low. The weakening of the US currency was caused by overall market optimism amid news of the imminent end of the Middle East crisis. The decline in global oil prices to a two‑month low (around 80 dollars per barrel) significantly simplified the task for the Swiss National Bank (SNB) ahead of its upcoming meeting. Domestic economic indicators also confirm the disinflationary trend – in May the Index surprised by falling 0.4% month‑over‑month. The decline in domestic producer prices combined with the sharp collapse in commodity prices virtually guarantees that the SNB will keep its key interest rate unchanged at its June 18 meeting.

Large institutional investors continue to reduce their presence in metals. Last Friday, long positions in gold ETFs fell to a 6.5‑month low, showing a deep pullback from the 3.5‑year high recorded at the peak of the Middle East crisis on February 27. A similar picture is seen in silver ETFs – holdings there fell to a 10.5‑month low (the peak was reached on December 23).

On Tuesday, crude oil prices (WTI) fell below 81 dollars per barrel, extending the decline after nearly a 5% drop in the previous session. Investors are cautious as they await details of the proposed peace agreement between the US and Iran, which is expected to be signed in Switzerland on Friday. Although Donald Trump stated that the deal will restore the free flow of oil from the Persian Gulf, the absence of an official memorandum text is forcing shipping companies to delay vessel departures until full clarity emerges.

On Monday, Japan’s Nikkei 225 (JP225) surged by 4.99%, China’s FTSE China A50 closed higher by 1.46%, Hong Kong’s Hang Seng (HK50) gained 0.50%, and Australia’s ASX 200 (AU200) closed up by 1.25%.

The Australian dollar fell to a two‑month low around 0.705, reacting sharply to the results of the Reserve Bank of Australia meeting. The RBA decided to hit the brakes, unanimously keeping the base interest rate at 4.35%. This step followed an aggressive series of three consecutive hikes in February, March, and May, which the regulator needed to combat the second wave of inflation triggered by the spring blockade of the Strait of Hormuz. Most economists agree that the RBA will remain at the current plateau of 4.35% at least until the end of winter (the next meeting is scheduled for August 11).

S&P 500 (US500) 7,554.29 +122.83 (+1.65%)

Dow Jones (US30) 51,671.03 +468.77 (+0.92%)

DAX (DE40) 24,894.01 +258.71 (+1.05%)

FTSE 100 (UK100) 10,430.62 -41.10 (-0.39%)

USD Index 99.69 -0.06 (-0.06%)

News feed for: 2026.06.16

  • China Industrial Production (m/m) at 05:00 (GMT+3) – CHA50, HK50 (MED)
  • China Retail Sales (m/m) at 05:00 (GMT+3) – CHA50, HK50 (MED)
  • China Unemployment Rate (m/m) at 05:00 (GMT+3) – CHA50, HK50 (MED)
  • Japan BoJ Interest Rate Decision at 06:00 (GMT+3) – JPY, JP225 (HIGH)
  • Japan BoJ Rate Statement at 06:00 (GMT+3) – JPY, JP225 (HIGH)
  • Australia RBA Interest Rate Decision at 07:30 (GMT+3) – AUD, AU200 (HIGH)
  • Australia RBA Rate Statement at 07:30 (GMT+3) – AUD, AU200 (HIGH)
  • Japan BoJ Press Conference at 07:30 (GMT+3) – JPY, JP225 (MED)
  • Australia RBA Press Conference at 08:30 (GMT+3) – AUD, AU200 (MED)
  • German ZEW Economic Sentiment (m/m) at 12:00 (GMT+3) – EUR (MED)
  • Eurozone ZEW Economic Sentiment (m/m) at 12:00 (GMT+3) – EUR (LOW)
  • US Building Permits (m/m) at 15:30 (GMT+3) – USD (MED)

By JustMarkets


This article reflects a personal opinion and should not be interpreted as an investment advice, and/or offer, and/or a persistent request for carrying out financial transactions, and/or a guarantee, and/or a forecast of future events.

USDJPY Driven by Emotions: Bank of Japan Raises Rate to Highest Level Since 1995

By RoboForex Analytical Department

The USDJPY pair declined to 160.13 on Tuesday after two highly volatile trading sessions. Investors remain focused on the Bank of Japan’s latest policy meeting.

The regulator raised its key interest rate by 25 basis points to 1.0%, the highest level since 1995. This move is intended to help contain inflation and support the national currency, which has remained under pressure for most of the year.

In recent weeks, the yen has been actively used in carry trade operations: investors borrowed funds in the low-yielding Japanese currency and invested them in higher-yielding assets. This increased pressure on the JPY despite the Bank of Japan’s gradual policy tightening and repeated currency interventions by Tokyo.

The main reason behind the yen’s weakness remains the significant interest rate gap between Japan and the US. As long as US rates remain substantially higher than Japanese rates, the dollar retains a structural advantage.

The market is also closely watching developments in the Middle East.

Investors expect the US and Iran to sign an agreement in Switzerland at the end of the week. If the deal is reached and leads to the reopening of the Strait of Hormuz, it could ease tensions in global markets and reduce demand for safe-haven assets, including the US dollar.

USDJPY Technical Analysis


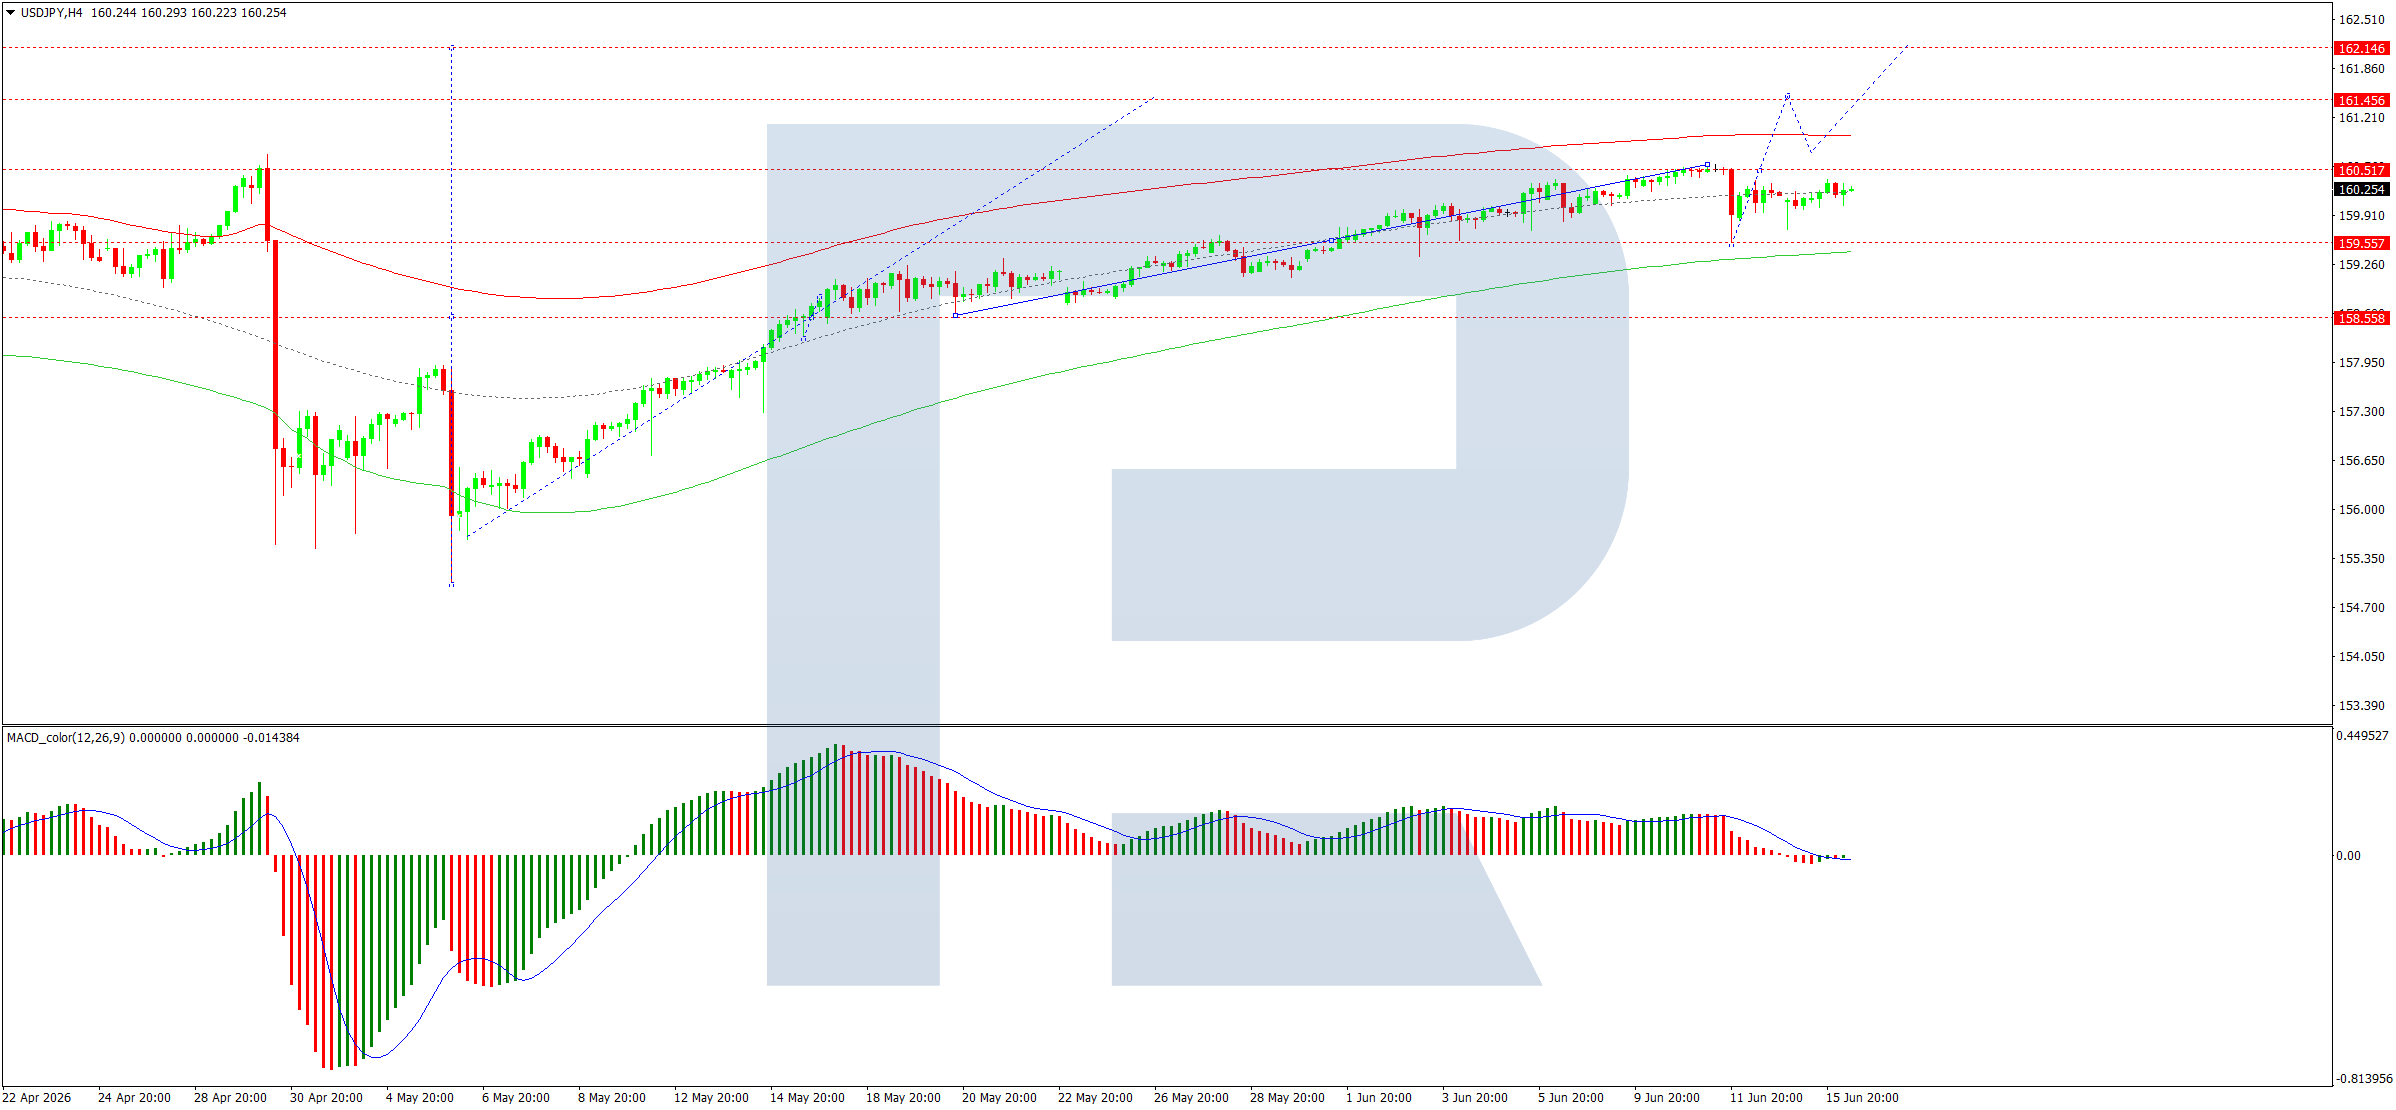
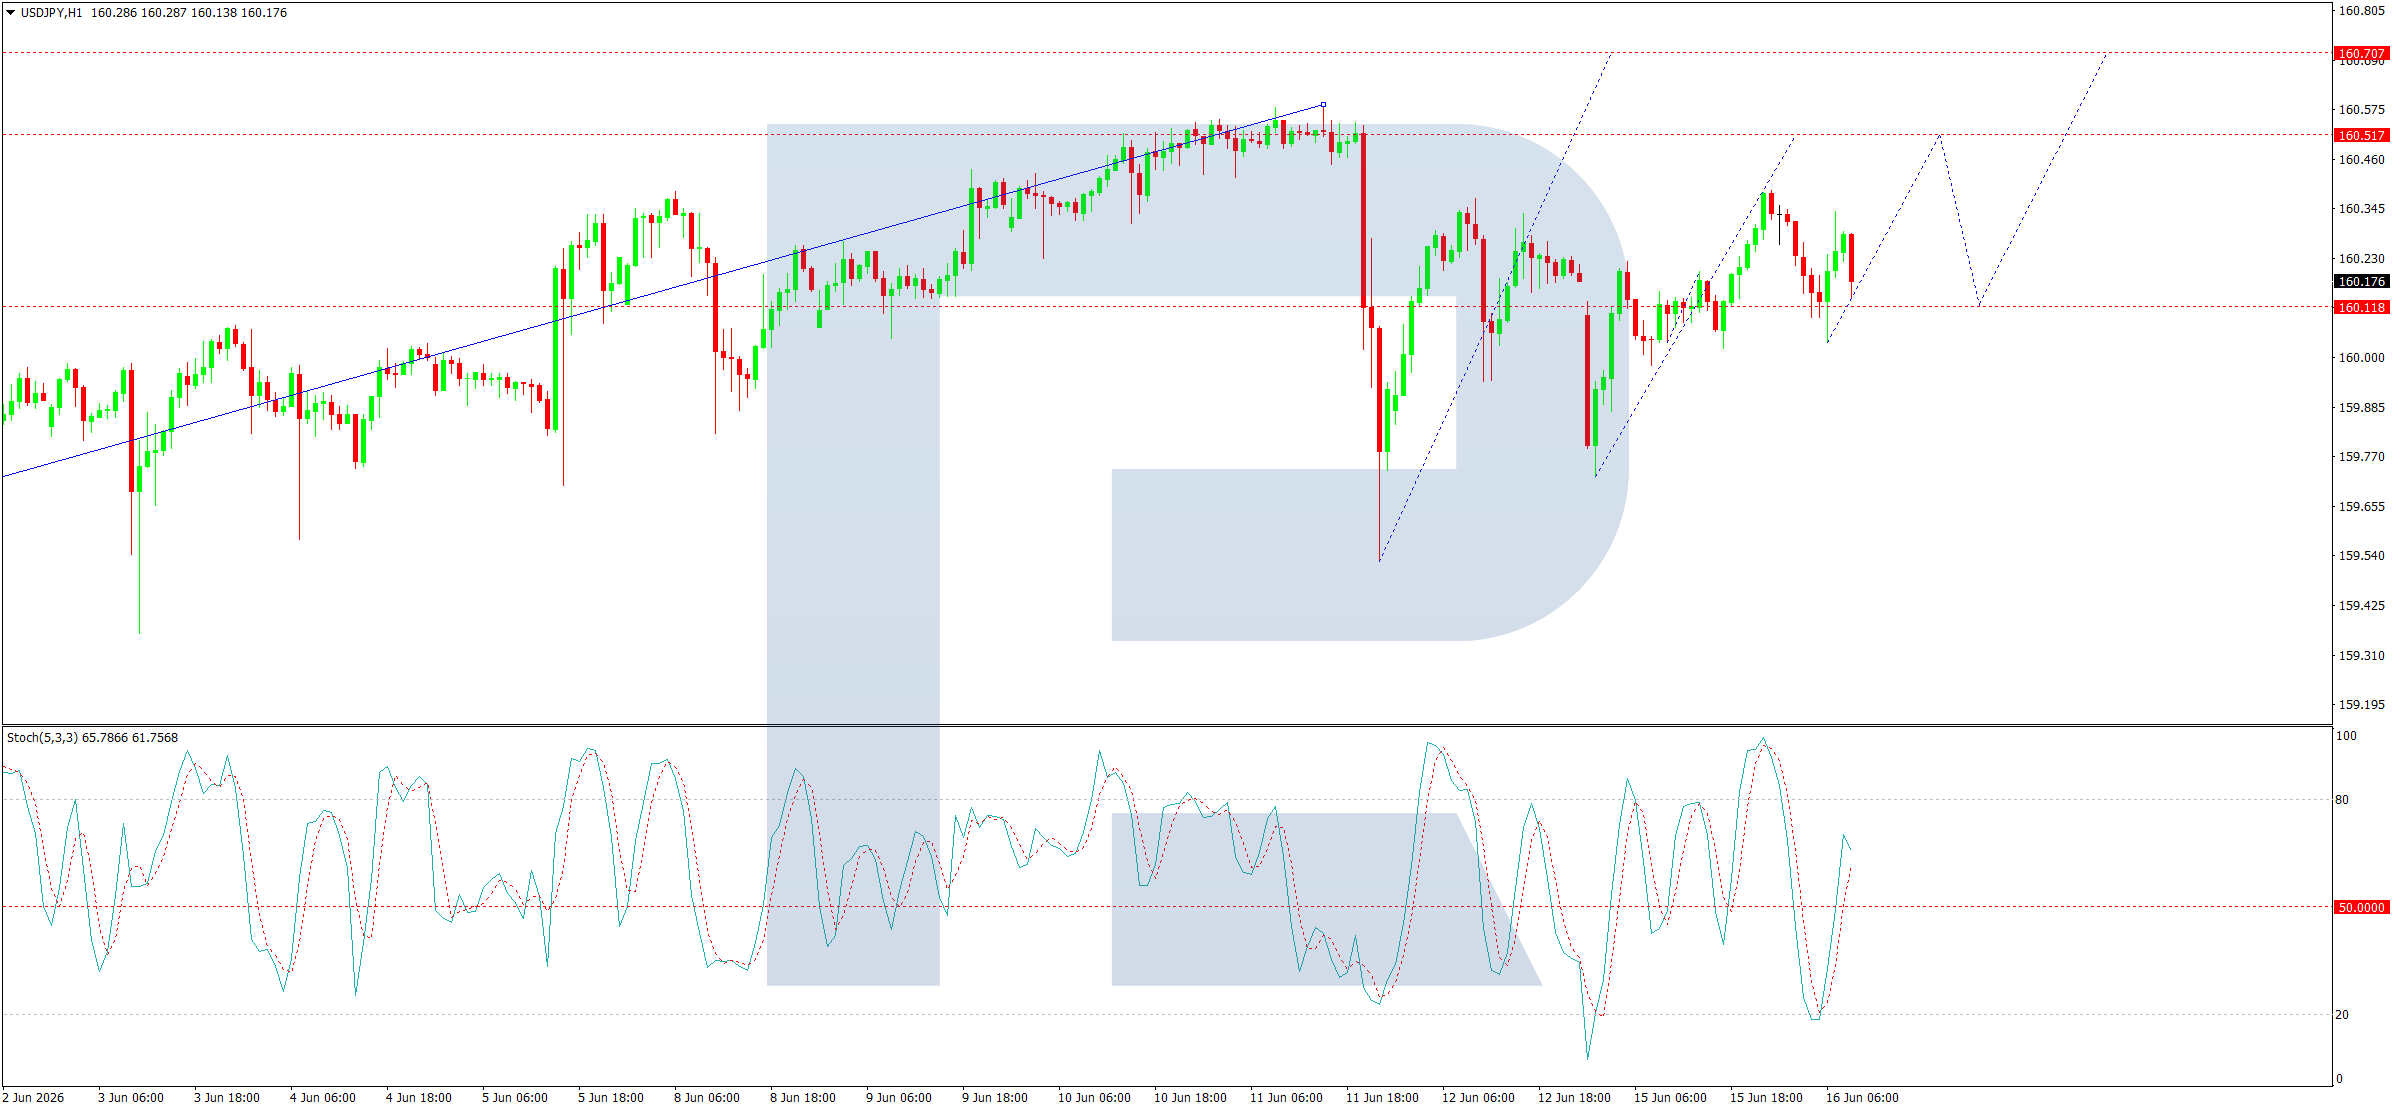
On the H4 chart, USDJPY has formed a consolidation range around 160.20. After breaking upwards, the pair is developing a growth wave structure towards 161.50. Today, we expect this target to be reached, followed by a decline towards 160.30. Technically, this scenario is confirmed by the MACD indicator: its signal line is above zero and pointing firmly upwards, reflecting potential for the continuation of the growth wave.

On the H1 chart, the market is forming a growth structure towards 160.51. After that, a correction towards 160.20 may be considered. The pair is then expected to rise towards 160.70, with the potential to continue the trend towards 161.50.

This scenario is supported by the Stochastic oscillator: its signal line is above 50 and moving firmly upwards towards 80, indicating that short-term upside potential remains intact.


Disclaimer

Any forecasts contained herein are based on the author’s particular opinion. This analysis may not be treated as trading advice. RoboForex bears no responsibility for trading results based on trading recommendations and reviews contained herein.

The United States and Iran have signed a peace agreement – oil has fallen to 80 dollars per barrel.

By JustMarkets 

On Friday, US stock indices closed in the green zone amid two powerful drivers: the historic market debut of SpaceX and persistent geopolitical optimism. By the end of the day, the Dow Jones Index (US30) rose by 0.70% (weekly result +0.40%). The S&P 500 Index (US500) gained 0.50% (weekly result -0.12%). The Technology Index NASDAQ (US100) closed higher by 0.64% (weekly result +0.52%).

The main event of the day was the triumphant debut of SpaceX on the NASDAQ exchange under the ticker SPCX. With an IPO price of 135 dollars per share, trading opened at 150 dollars. During the day, the stock surged by almost 30%, and closed at 161.11 dollars (a gain of 19.3%). This record IPO worth 75 billion dollars increased Elon Musk’s company’s capitalization to 2 trillion dollars. During the trading session, markets experienced short-term volatility due to a tough statement by Donald Trump, who warned Iran against disrupting the negotiations. However, markets quickly recovered after the publication of details of the draft peace agreement.

This week, investors’ attention will be focused on the first meeting of the US Federal Reserve under the chairmanship of Kevin Warsh. According to the general consensus of analysts, the American regulator will keep interest rates in the current range of 3.5-3.75%. The main intrigue lies in the rhetoric: whether officials will signal readiness to resume rate hikes at the end of 2026 to curb inflation, which was fueled by the spring surge in oil prices due to the blockade of the Strait of Hormuz. In parallel, the market will assess a block of important US macroeconomic data for May.

Retail sales are expected to rise by 0.5%, repeating the pace of the previous month, which, under high inflation, indicates the preservation of nominal spending at the expense of reduced savings. In contrast, industrial production is prediction to slow sharply – growth will amount to only 0.2% after a strong April jump of 0.7%. The real estate sector will also show cooling: analysts expect a decline in both housing starts and building permits amid high costs.

European indices closed higher on Friday. By the end of the day, Germany’s DAX (DE40) rose by 1.76% (weekly result +0.77%), France’s CAC 40 (FR40) closed up 1.83% (weekly result +2.67%), Spain’s IBEX 35 (ES35) gained 2.59% (weekly result +3.05%), and the UK’s FTSE 100 (UK100) closed higher by 1.63% (weekly result +0.99%). In Europe, the focus of global financial markets this week is on the United Kingdom, Switzerland, Norway, and Sweden. According to the consensus outlook, the Bank of England will keep the base interest rate at 3.75%, although investors hope to receive hints from the Committee regarding the overall trajectory for the rest of the year. The central banks of Sweden (Riksbank), Switzerland (SNB), and Norway (Norges Bank) are expected to keep their current interest rates unchanged, opting for a wait‑and‑see approach. In terms of macroeconomic statistics, Germany is expected to show a moderate improvement in the ZEW economic sentiment Index for June. This will mark the second month of recovery after a deep April decline to a three‑year low, although the indicator will likely remain in negative territory.

Crude oil prices collapsed by more than 5%, plunging to 80 dollars per barrel and hitting a two‑month low. The massive sell‑off was triggered by the official announcement of the long‑awaited peace agreement between the United States and Iran. US President Donald Trump confirmed that the agreement provides for the immediate lifting of the American naval blockade of Iranian ports. This will allow safe navigation through the Strait of Hormuz to be fully restored by the end of the current week. In addition to reopening the strait, the framework agreement obliges Tehran to completely dismantle its nuclear program. In return, Iran receives a package of large‑scale economic incentives and legalization of its oil exports. Iran’s Deputy Foreign Minister Kazem Gharibabadi officially confirmed that a compromise had been reached.

On Friday, Japan’s Nikkei 225 (JP225) rose by 2.81% (weekly result +0.11%), China’s FTSE China A50 closed higher by 1.50% (weekly result +1.64%), Hong Kong’s Hang Seng (HK50) gained 1.93% (weekly result +0.55%), and Australia’s ASX 200 (AU200) closed up 1.98% (weekly result +1.14%). This week, the Asia‑Pacific region expects a dense flow of economic news.

Japan: The key event will be the Bank of Japan meeting (June 15-16). Against the backdrop of persistent inflation and a weak yen, the regulator is expected to raise the base rate by 25 basis points – to 1.0%. If confirmed, the rate will return to its highest level since 1995. Traders will also assess May data on inflation, trade, and machinery orders.

China: Investors will analyze a comprehensive block of May macroeconomic data: retail sales, industrial production (analysts expectation an acceleration to 4.6% due to IT exports), unemployment rate, fixed‑asset investment, and housing prices.

Australia: The Reserve Bank will likely pause and keep the refinancing rate at 4.35% after the May quarter‑point hike.

Other countries: Singapore, Thailand, and Malaysia will publish trade balances, New Zealand will report Q1 GDP, and the central banks of Indonesia, Taiwan, and the Philippines will announce rate decisions.

S&P 500 (US500) 7,431.46 +37.16 (+0.50%)

Dow Jones (US30) 51,202.26 +353.51 (+0.70%)

DAX (DE40) 24,635.30 +425.59 (+1.76%)

FTSE 100 (UK100) 10,471.72 +167.84 (+1.63%)

USD Index 99.81 -0.05 (-0.05%)

News feed for: 2026.06.15

  • Switzerland Producer Price Index (m/m) at 09:30 (GMT+3) – CHF (LOW)
  • Eurozone ECB President Lagarde Speaks at 10:15 (GMT+3) – EUR (LOW)
  • Eurozone Industrial Production (m/m) at 12:00 (GMT+3) – EUR (LOW)
  • Eurozone Trade Balance (m/m) at 12:00 (GMT+3) – EUR (MED)
  • US Industrial Production (m/m) at 16:15 (GMT+3) – USD (MED)

By JustMarkets


This article reflects a personal opinion and should not be interpreted as an investment advice, and/or offer, and/or a persistent request for carrying out financial transactions, and/or a guarantee, and/or a forecast of future events.

EURUSD Ahead of the New Week: Expecting High Volatility

By RoboForex Analysis Department

The EURUSD pair is starting Monday’s trading session near 1.1468.

This week, global financial markets will closely monitor two pivotal drivers: the prospects of a US-Iran nuclear deal and the upcoming Federal Reserve meeting. Any signs of progress in the negotiations could strip the geopolitical premium out of oil prices, subsequently weakening safe-haven demand for the US Dollar.

Concurrently, the market is bracing for the first Fed meeting chaired by Kevin Warsh, which is expected to set the tone for interest rate expectations heading into the second half of the year.

This meeting is critical for EURUSD. Just last week, robust US inflation and labor market data bolstered the Greenback, reinforcing expectations that the Fed will maintain its hawkish stance. Meanwhile, investors will continue to digest the impact of the ECB’s recent rate hike, looking for further guidance from European policymakers.

Additional direction will come from US macroeconomic releases, including retail sales and industrial production, which will provide further clarity on the health of the US economy and the trajectory of its monetary policy.

EURUSD Technical Analysis

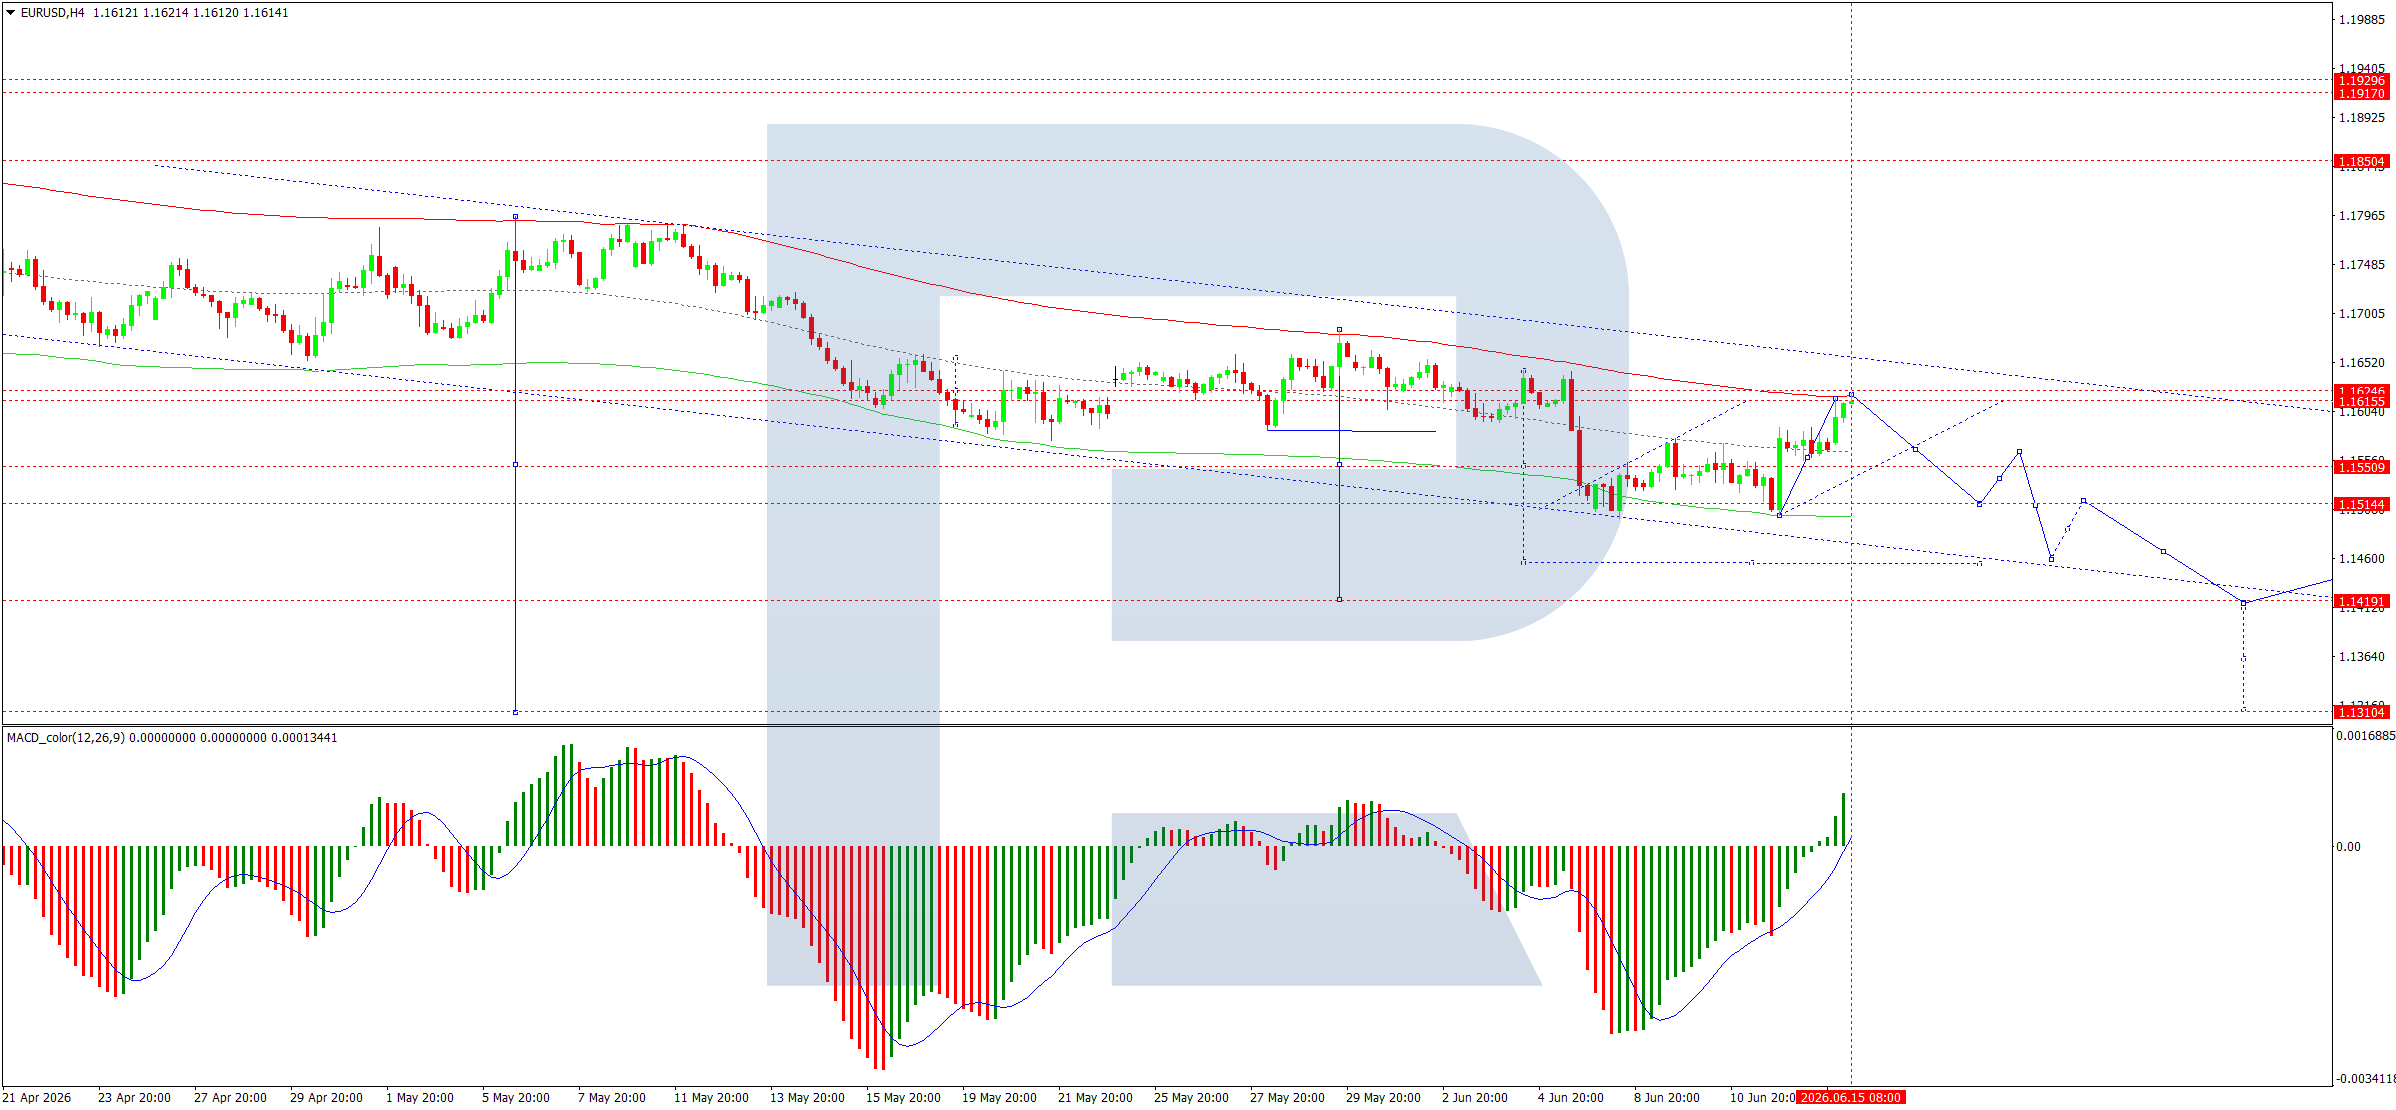
On the 4-hour chart, the EURUSD pair has formed a consolidation range around 1.1575, briefly testing the downside toward 1.1550.

Upside Scenario: A breakout above this range could trigger a corrective wave toward 1.1612, followed by a subsequent decline back to 1.1500.

Downside Scenario: A clean break below the consolidation range will open the door for a downward wave targeting 1.1444.

Technical Confirmation: The MACD indicator supports the bearish outlook. Its signal line remains above the zero mark but is pointing sharply downward, reflecting persistent bearish momentum and potential for trend continuation.

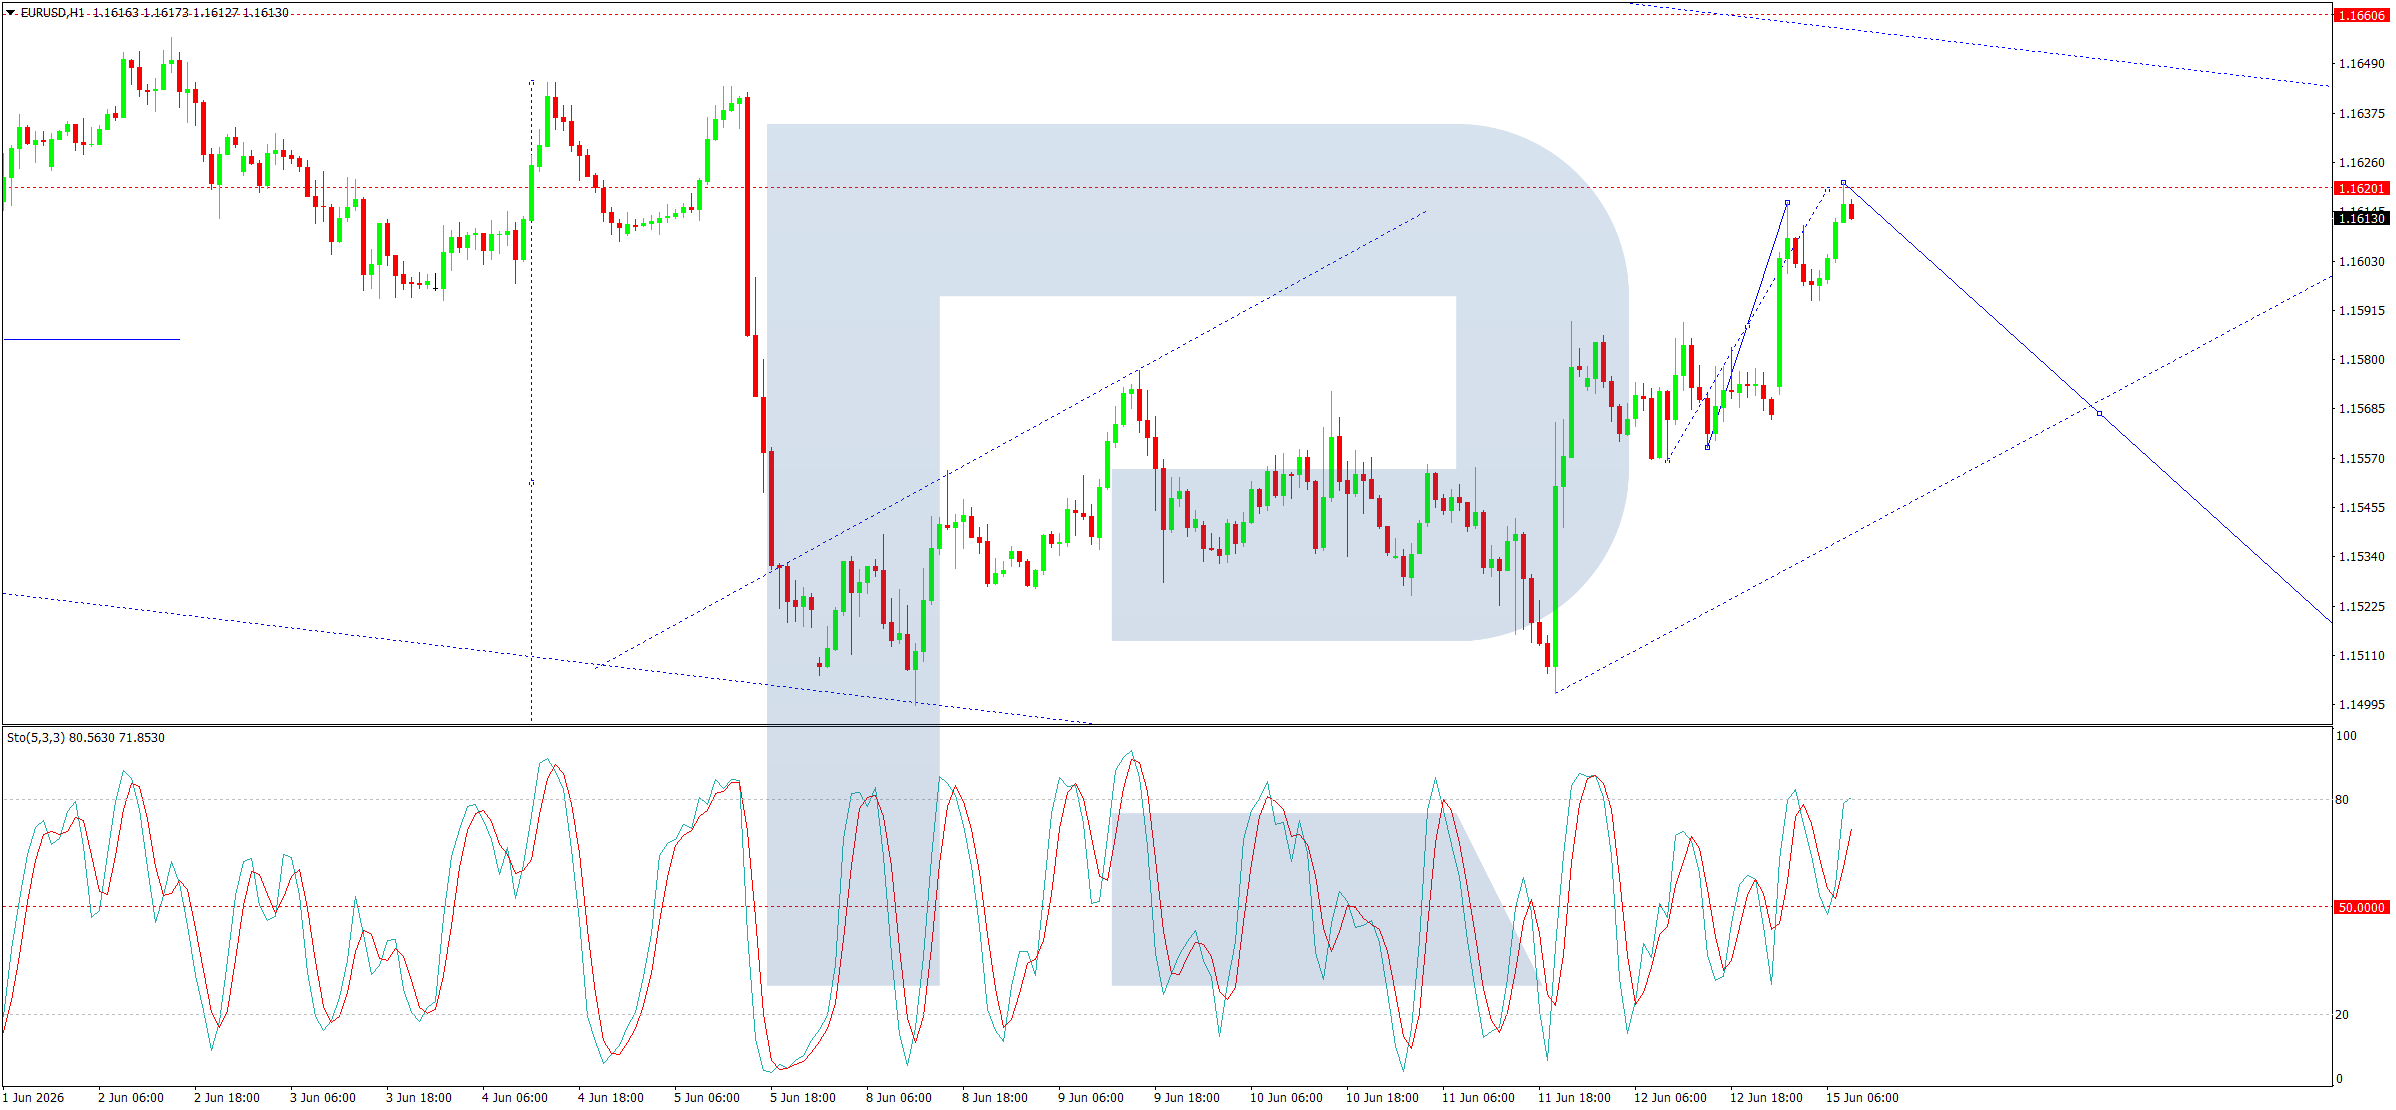
On the 1-hour chart, the market has completed an upward wave toward 1.1612 and is currently consolidating just below this level.

The immediate outlook suggests an expansion of this consolidation range—downward to 1.1500 and upward to 1.1550—before a broader decline resumes toward 1.1444.

Technical Confirmation: This scenario is backed by the Stochastic oscillator, where the signal line has crossed below the 80 level and is heading straight down toward 20, signaling oversold conditions ahead.


Disclaimer

Any forecasts contained herein are based on the author’s particular opinion. This analysis may not be treated as trading advice. RoboForex bears no responsibility for trading results based on trading recommendations and reviews contained herein.

Large Currency Speculator Roundup: Mexican Peso Bets rise as Euro, CAD Bets drop

By InvestMacro 

Speculators OI FX Futures COT Chart

Here are the latest charts and statistics for the Commitment of Traders (COT) data published by the Commodities Futures Trading Commission (CFTC).

The latest COT data is updated through Tuesday June 9th and shows a quick view of how large market participants (for-profit speculators and commercial traders) were positioned in the futures markets. All currency positions are in direct relation to the US dollar where, for example, a bet for the euro is a bet that the euro will rise versus the dollar while a bet against the euro will be a bet that the euro will decline versus the dollar.

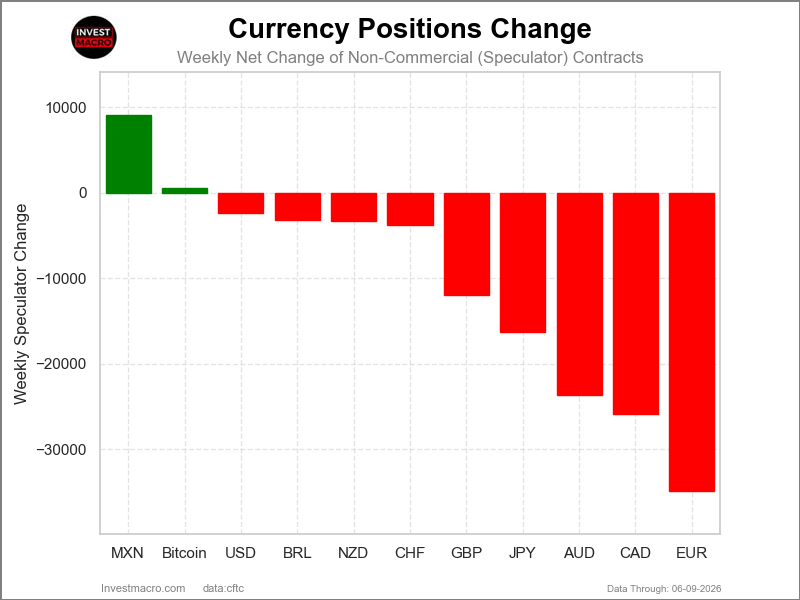
Weekly Speculator Changes led by Mexican Peso & Bitcoin
Speculators Nets FX Futures COT Chart
The COT currency market speculator bets were lower this week as two out of the eleven currency markets we cover had higher positioning while the other nine markets had lower speculator contracts.

Leading the gains for the currency markets was the Mexican Peso (9,144 contracts) and with the Bitcoin (560 contracts) also showing positive weeks.

The currencies seeing declines in speculator bets on the week were the EuroFX (-34,934 contracts), the Canadian Dollar (-25,888 contracts), the Australian Dollar (-23,652 contracts), the Japanese Yen (-16,251 contracts), the British Pound (-11,995 contracts), the Swiss Franc (-3,756 contracts), the New Zealand Dollar (-3,325 contracts), the Brazilian Real (-3,134 contracts) and with the US Dollar Index (-2,374 contracts) also registering lower bets on the week.

Currency Speculator Roundup: Mexican Peso Bets rise as Euro, CAD Bets drop

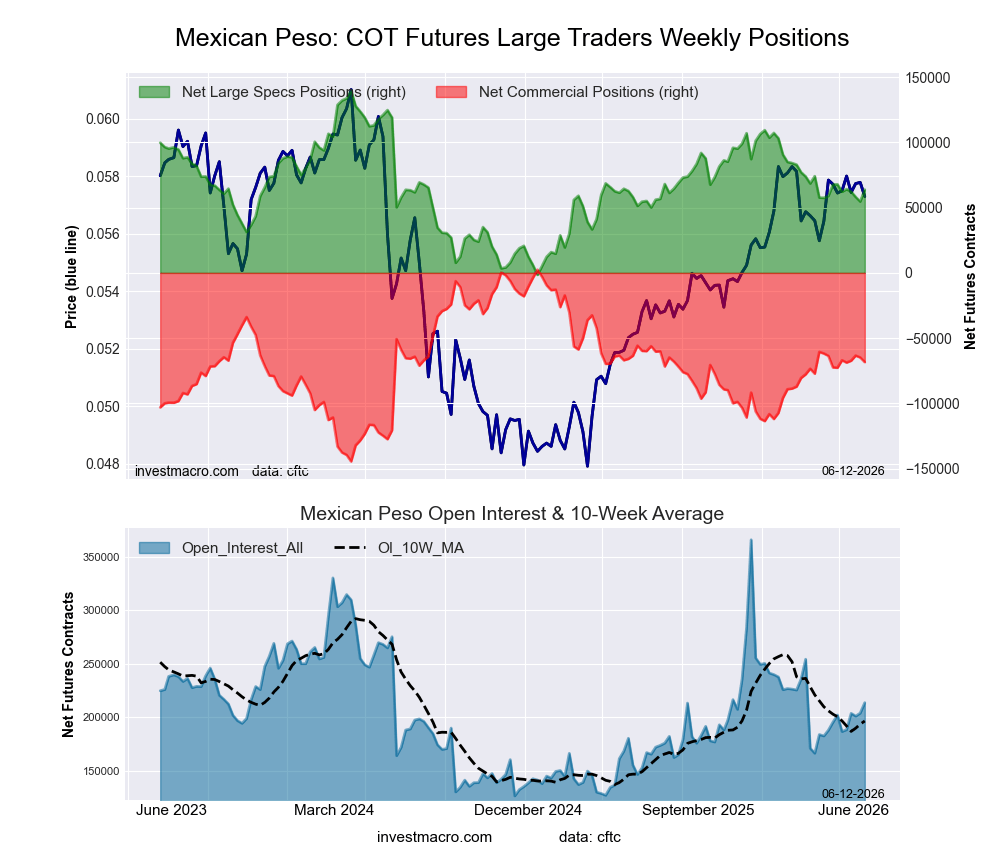
Highlighting the major Currencies market futures positioning this week was the Mexican peso, which was the highest weekly gainer. The Mexican peso position rose by over 9,000 weekly contracts this week and is currently the most bullish of the Currencies right now according to net speculator position. The overall position is now at a standing of 63,801 net contracts and the peso position has been overall in a bullish level for 72 consecutive weeks. Recently, the Bank of Mexico cut its interest rate by 25 basis points to a new level of 6.50% with analysts speculating that this could end the easing cycle which began over a year ago and the next path for interest rates is uncertain. In the Forex markets, the Mexican peso has been on a strong uptrend since February 2025 with the MXN is up by over 22% since the lowest levels of 2025 against the US dollar.

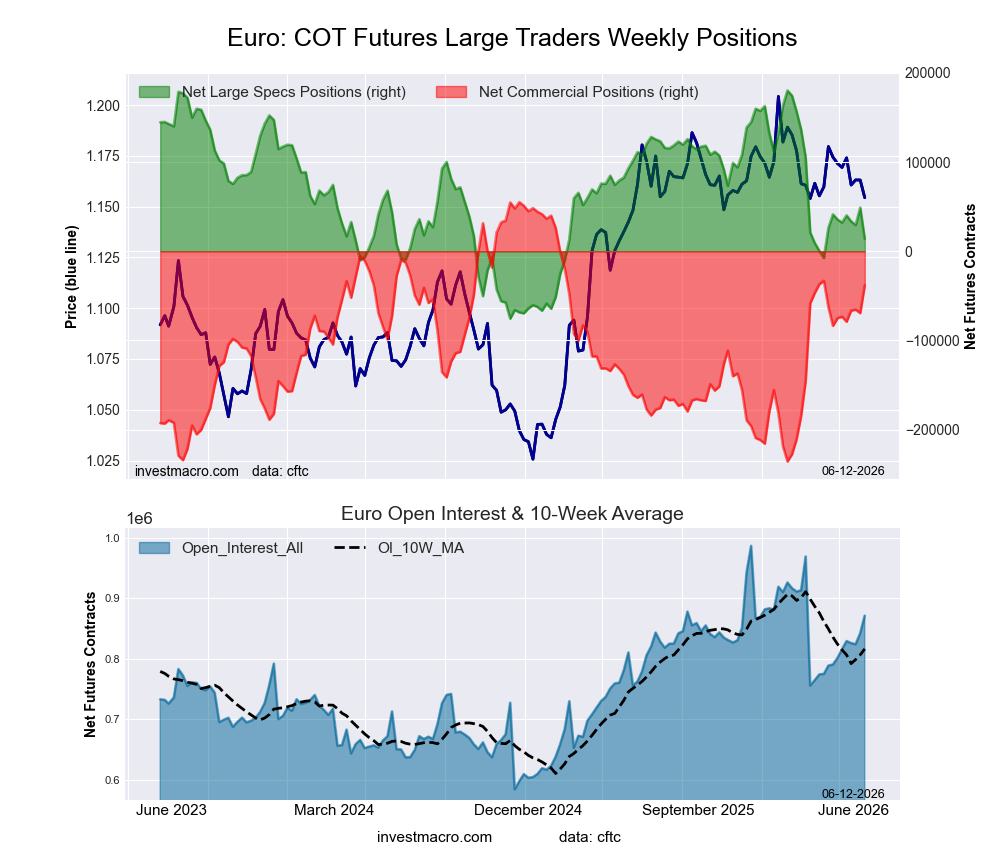
Next up, the Euro speculator position dropped by over -34,000 contracts this week, marking the most bearish weekly change in the past 12 weeks. Overall, the euro speculator position has now fallen for three out of the past four weeks and has fallen to the lowest standing since April. The current level of net speculator positions is at 13,932 contracts and is essentially a neutral-to-small bullish level in the big scheme of things. The European Central Bank, this week (on Thursday June 11th), increased their interest rate by 25 basis points to a total level of 2.25% and marked the first rate increase in almost three years. Despite the weakness in speculative bets for the week, the euro price in the Forex markets continues to trade in a sideways range between 1.1500 and 1.1950, with this week’s close for the euro against the US dollar at 1.1617.

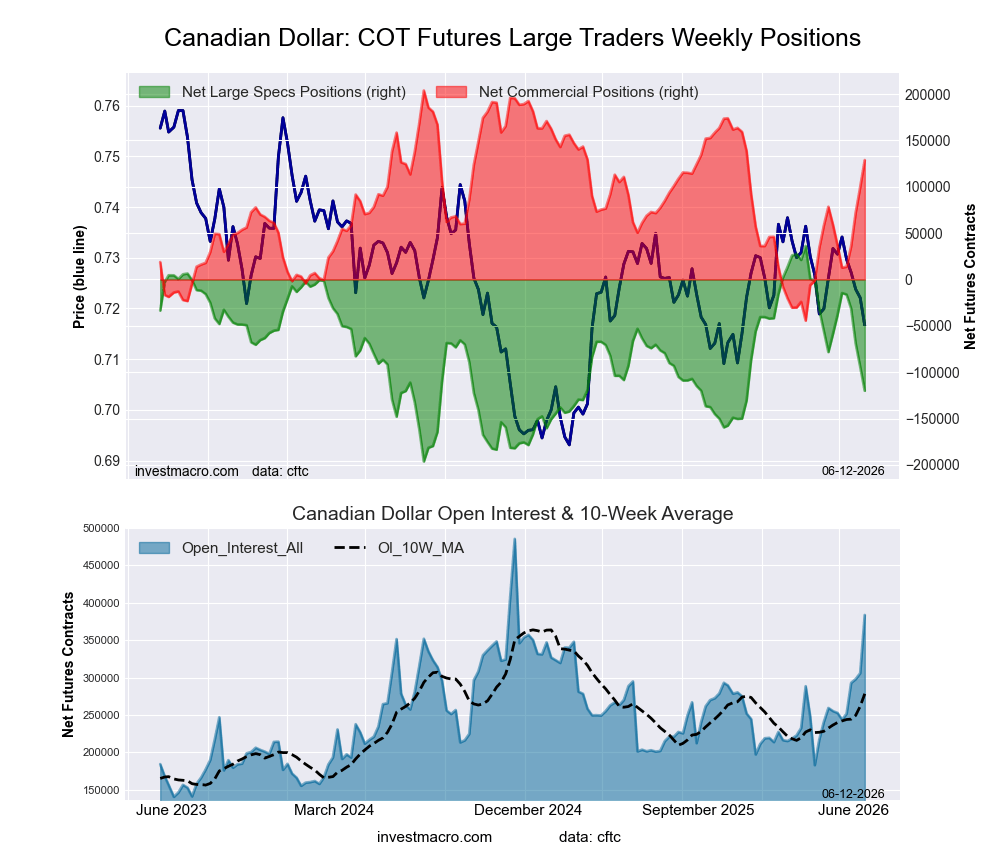
The Canadian dollar speculator position dropped sharply and has now fallen for five consecutive weeks. The Canadian dollar positioning has now fallen by -105,340 net contracts in just the past five weeks and is now at a net position standing of -119,999 contracts. This marks the lowest or most bearish level for the Canadian dollar contracts since December 9th, a span of 26 weeks. The Bank of Canada this week held its interest rate steady at 2.25%, with uncertainty which way policy could go in the near future as inflation due to the Iran war is an issue. In the Forex markets, the Canadian dollar against the US dollar saw a slight uptick this week after falling in four out of the previous five weeks that saw prices drop to the downside out of its previous ascending triangle pattern. The Canadian dollar was helped out and bounced off of resistance at the 0.7150 level, which is where support lies currently and could mark a level of down-trending action if this level is broken.

The US Dollar Index saw weekly speculator bets decline by over -2,000 contracts this week following two weeks of gains. The current US Dollar Index positioning is very much in a neutral-to-small-bullish level with an overall net speculator standing of just 1,384 contracts. The DX speculator positioning has been in this small bullish situation now for 13 consecutive weeks with only 1 small dip into a small bearish position in that time-frame. Before that, the DX positioning had been in an overall bearish level for 38 out of the previous 39 weeks through March 10th. The US Dollar Index price this week tested the upper range of its sideways channel that the currency has been in for quite some time. This channel has a low level of 96.50 with an upper resistance level of 100.00. This week, the US Dollar Index price tested the 100.00 level and was rejected lower with a close at 99.49. A breakout above 100 could see a play towards 102.50 in the near future.

Brazilian Real and Mexican Peso lead Currency market price performances

The leading gains for the major Currency markets this week saw the Brazilian Real up by 2.38% over the past five days. The Mexican Peso was next with a gain over 1% with a 1.25% rise.

The New Zealand Dollar was higher by 0.64%, followed by the British Pound Sterling, which rose by 0.50%. Next up, the Euro was higher by 0.41%, while Bitcoin was marginally higher by 0.32%. The Australian Dollar was virtually unchanged with an uptick of 0.09%, followed by the Japanese Yen, which edged higher by 0.05%, and the Swiss Franc, which saw an uptick by 0.03%.

On the downside, the Canadian Dollar was lower by -0.32%. The US Dollar Index was the biggest decliner on the week with a -0.49% decline.


Currencies Data:
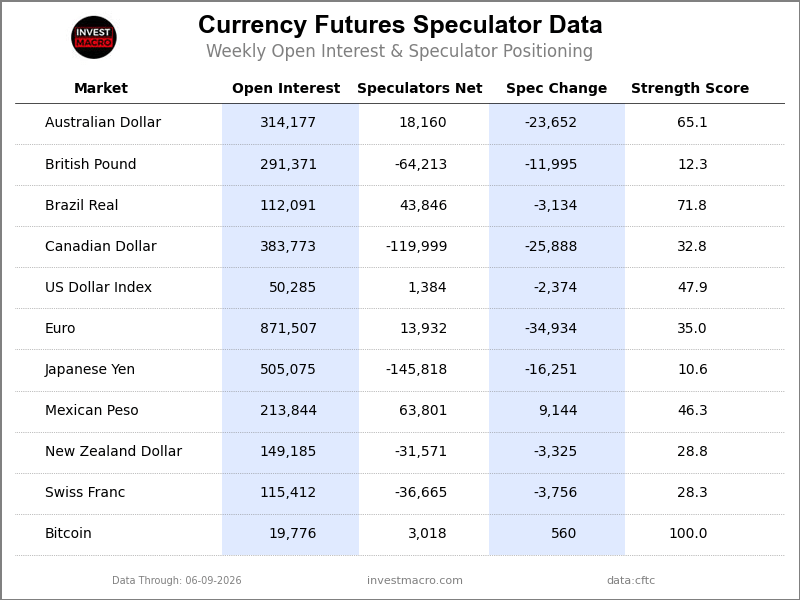
Speculators FX Futures COT Data Table
Legend: Open Interest | Speculators Current Net Position | Weekly Specs Change | Specs Strength Score compared to last 3-Years (0-100 range)


Strength Scores led by Bitcoin & Brazilian Real
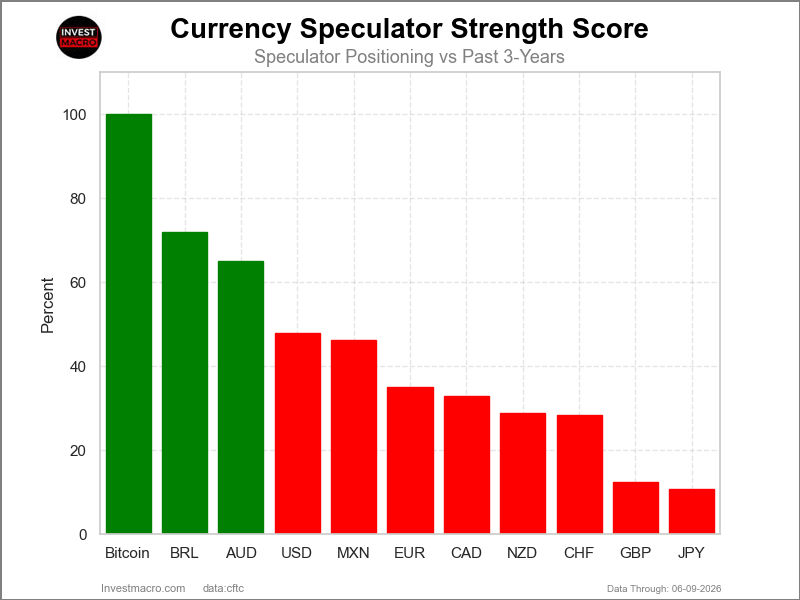
Speculators Strength Scores FX Futures COT Chart
COT Strength Scores (a normalized measure of Speculator positions over a 3-Year range, from 0 to 100 where above 80 is Extreme-Bullish and below 20 is Extreme-Bearish) showed that the Bitcoin (100 percent) and the Brazilian Real (72 percent) lead the currency markets this week. The Australian Dollar (65 percent) comes in as the next highest in the weekly strength scores.

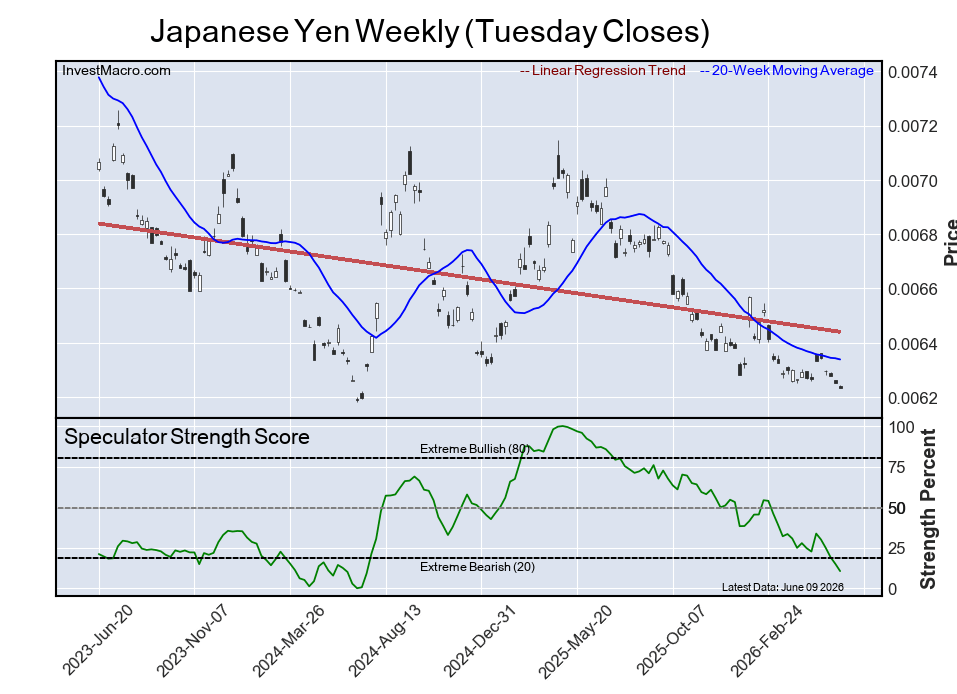
On the downside, the Japanese Yen (11 percent) and the British Pound (12 percent) come in at the lowest strength levels currently and are in Extreme-Bearish territory (below 20 percent). The next lowest strength scores are the Swiss Franc (28 percent) and the New Zealand Dollar (29 percent).

3-Year Strength Statistics:
US Dollar Index (47.9 percent) vs US Dollar Index previous week (54.3 percent)
EuroFX (35.0 percent) vs EuroFX previous week (48.6 percent)
British Pound Sterling (12.3 percent) vs British Pound Sterling previous week (17.4 percent)
Japanese Yen (10.6 percent) vs Japanese Yen previous week (15.0 percent)
Swiss Franc (28.3 percent) vs Swiss Franc previous week (36.4 percent)
Canadian Dollar (32.8 percent) vs Canadian Dollar previous week (44.0 percent)
Australian Dollar (65.1 percent) vs Australian Dollar previous week (77.3 percent)
New Zealand Dollar (28.8 percent) vs New Zealand Dollar previous week (32.6 percent)
Mexican Peso (46.3 percent) vs Mexican Peso previous week (39.8 percent)
Brazilian Real (71.8 percent) vs Brazilian Real previous week (74.1 percent)
Bitcoin (100.0 percent) vs Bitcoin previous week (89.8 percent)


New Zealand Dollar & Bitcoin top the 6-Week Strength Trends
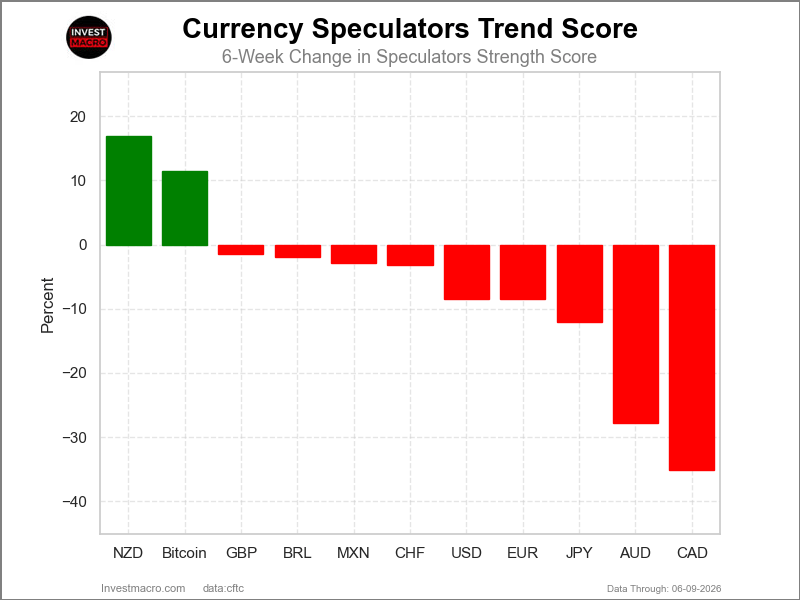
Speculators Trends FX Futures COT Chart
COT Strength Score Trends (or move index, calculates the 6-week changes in strength scores) showed that the New Zealand Dollar (17 percent) and Bitcoin (11 percent) lead the past six weeks trends for the currencies.

The Canadian Dollar (-35 percent) leads the downside trend scores currently with the Australian Dollar (-28 percent), Japanese Yen (-12 percent) and the EuroFX (-9 percent) following next with lower trend scores.

3-Year Strength Trends:
US Dollar Index (-8.4 percent) vs US Dollar Index previous week (-3.3 percent)
EuroFX (-8.5 percent) vs EuroFX previous week (2.9 percent)
British Pound Sterling (-1.5 percent) vs British Pound Sterling previous week (-0.1 percent)
Japanese Yen (-12.0 percent) vs Japanese Yen previous week (-9.7 percent)
Swiss Franc (-3.1 percent) vs Swiss Franc previous week (0.8 percent)
Canadian Dollar (-35.1 percent) vs Canadian Dollar previous week (-15.2 percent)
Australian Dollar (-27.8 percent) vs Australian Dollar previous week (-11.9 percent)
New Zealand Dollar (16.9 percent) vs New Zealand Dollar previous week (23.1 percent)
Mexican Peso (-2.8 percent) vs Mexican Peso previous week (-9.2 percent)
Brazilian Real (-1.9 percent) vs Brazilian Real previous week (2.5 percent)
Bitcoin (11.4 percent) vs Bitcoin previous week (7.0 percent)


Individual COT Forex Markets:

US Dollar Index Futures:
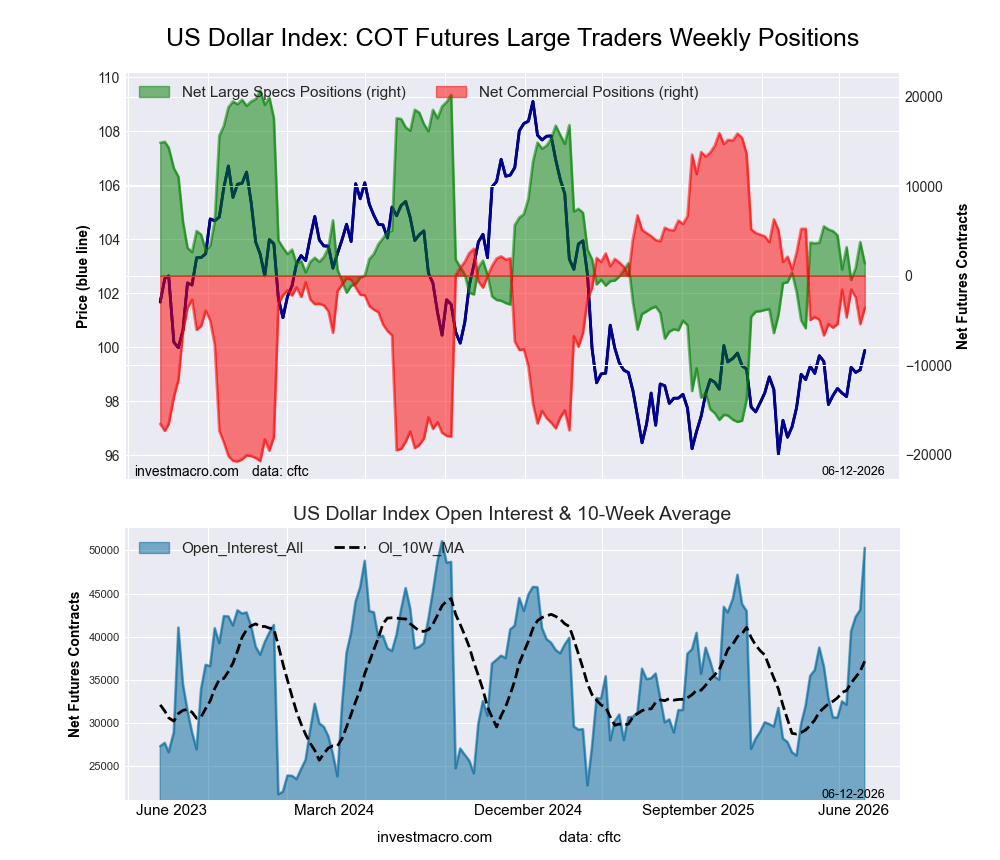
US Dollar Index Forex Futures COT ChartPositioning Notes:

  • US Dollar Index large speculator standing this week came in at a net position of 1,384 contracts in the data reported through Tuesday.
  • Weekly Speculator position decrease of -2,374 contracts from the previous week which had a total of 3,758 net contracts.
  • This week’s current strength score (range over the past 3 years, measured from 0 to 100) shows the speculators are currently Bearish with a score of 47.9 percent.
  • The Commercials are Bearish with a score of 46.8 percent.
  • The Small Traders (not shown in chart) are Bullish-Extreme with a score of 96.4 percent.

Price Trend-Following Model: Uptrend

Our weekly trend-following model classifies the current market price position as: Uptrend.

US DOLLAR INDEX StatisticsSPECULATORSCOMMERCIALSSMALL TRADERS
– Percent of Open Interest Longs:55.532.08.1
– Percent of Open Interest Shorts:52.739.23.7
– Net Position:1,384-3,5992,215
– Gross Longs:27,90816,0924,059
– Gross Shorts:26,52419,6911,844
– Long to Short Ratio:1.1 to 10.8 to 12.2 to 1
NET POSITION TREND:
– Strength Index Score (3 Year Range Pct):47.946.896.4
– Strength Index Reading (3 Year Range):BearishBearishBullish-Extreme
NET POSITION MOVEMENT INDEX:
– 6-Week Change in Strength Index:-8.44.928.6


Euro Currency Futures:

Euro Currency Futures COT ChartPositioning Notes:

  • Euro Currency large speculator standing this week came in at a net position of 13,932 contracts in the data reported through Tuesday.
  • Weekly Speculator position decrease of -34,934 contracts from the previous week which had a total of 48,866 net contracts.
  • This week’s current strength score (range over the past 3 years, measured from 0 to 100) shows the speculators are currently Bearish with a score of 35.0 percent.
  • The Commercials are Bullish with a score of 68.0 percent.
  • The Small Traders (not shown in chart) are Bearish with a score of 25.5 percent.

Price Trend-Following Model: Downtrend

Our weekly trend-following model classifies the current market price position as: Downtrend.

EURO Currency StatisticsSPECULATORSCOMMERCIALSSMALL TRADERS
– Percent of Open Interest Longs:25.258.710.4
– Percent of Open Interest Shorts:23.663.07.6
– Net Position:13,932-38,08524,153
– Gross Longs:219,564511,35990,399
– Gross Shorts:205,632549,44466,246
– Long to Short Ratio:1.1 to 10.9 to 11.4 to 1
NET POSITION TREND:
– Strength Index Score (3 Year Range Pct):35.068.025.5
– Strength Index Reading (3 Year Range):BearishBullishBearish
NET POSITION MOVEMENT INDEX:
– 6-Week Change in Strength Index:-8.512.7-32.2


British Pound Sterling Futures:

British Pound Sterling Futures COT ChartPositioning Notes:

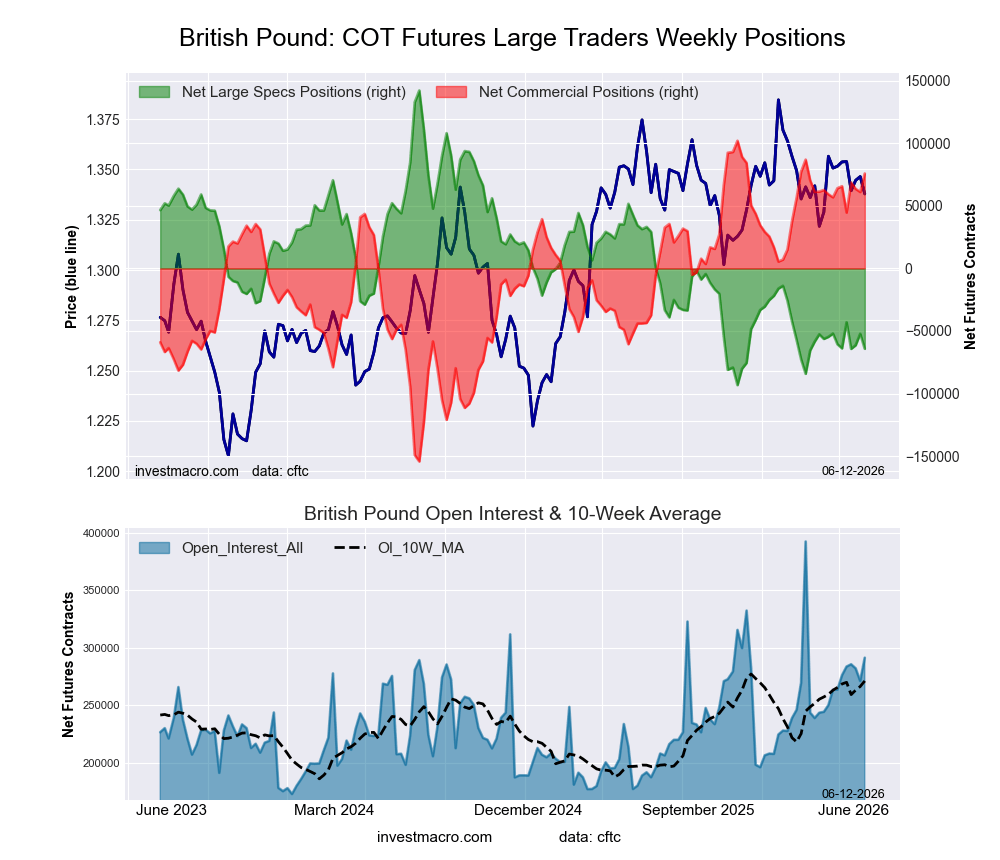
  • British Pound Sterling large speculator standing this week came in at a net position of -64,213 contracts in the data reported through Tuesday.
  • Weekly Speculator position reduction of -11,995 contracts from the previous week which had a total of -52,218 net contracts.
  • This week’s current strength score (range over the past 3 years, measured from 0 to 100) shows the speculators are currently Bearish-Extreme with a score of 12.3 percent.
  • The Commercials are Bullish-Extreme with a score of 89.8 percent.
  • The Small Traders (not shown in chart) are Bearish with a score of 23.0 percent.

Price Trend-Following Model: Downtrend

Our weekly trend-following model classifies the current market price position as: Downtrend.

BRITISH POUND StatisticsSPECULATORSCOMMERCIALSSMALL TRADERS
– Percent of Open Interest Longs:15.774.88.3
– Percent of Open Interest Shorts:37.748.812.3
– Net Position:-64,21375,870-11,657
– Gross Longs:45,743218,02524,172
– Gross Shorts:109,956142,15535,829
– Long to Short Ratio:0.4 to 11.5 to 10.7 to 1
NET POSITION TREND:
– Strength Index Score (3 Year Range Pct):12.389.823.0
– Strength Index Reading (3 Year Range):Bearish-ExtremeBullish-ExtremeBearish
NET POSITION MOVEMENT INDEX:
– 6-Week Change in Strength Index:-1.54.6-21.2


Japanese Yen Futures:

Japanese Yen Forex Futures COT ChartPositioning Notes:

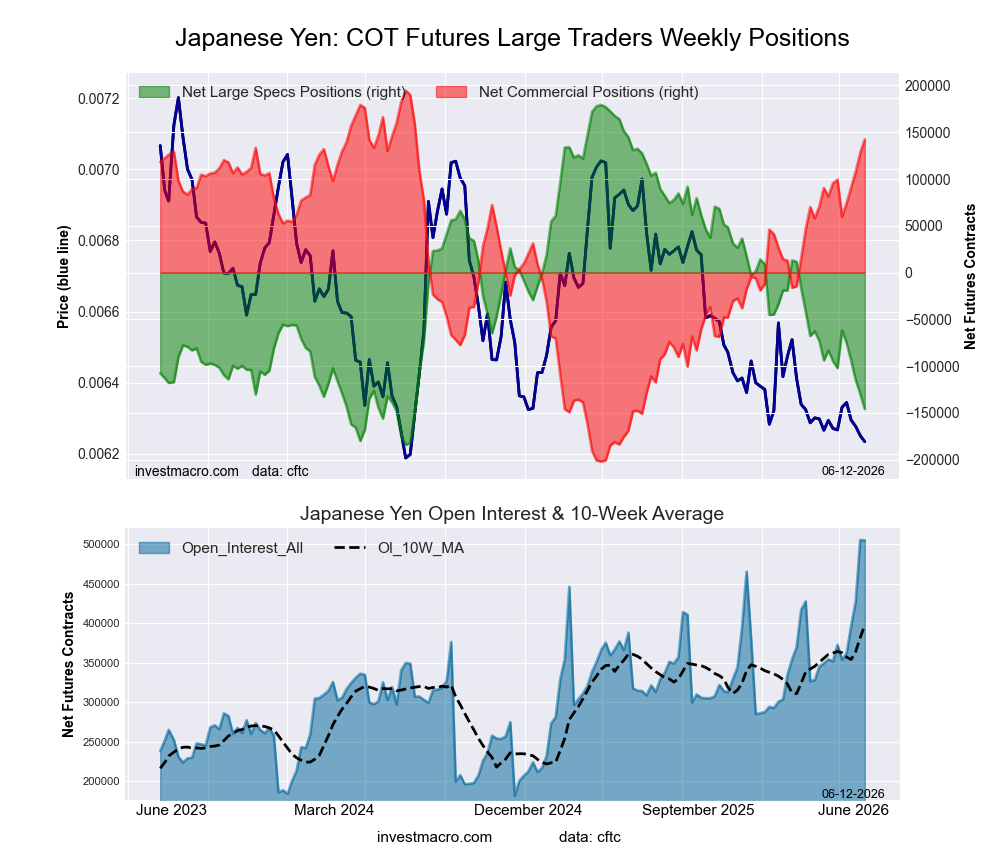
  • Japanese Yen large speculator standing this week came in at a net position of -145,818 contracts in the data reported through Tuesday.
  • Weekly Speculator position fall of -16,251 contracts from the previous week which had a total of -129,567 net contracts.
  • This week’s current strength score (range over the past 3 years, measured from 0 to 100) shows the speculators are currently Bearish-Extreme with a score of 10.6 percent.
  • The Commercials are Bullish-Extreme with a score of 86.8 percent.
  • The Small Traders (not shown in chart) are Bearish with a score of 42.4 percent.

Price Trend-Following Model: Downtrend

Our weekly trend-following model classifies the current market price position as: Downtrend.

JAPANESE YEN StatisticsSPECULATORSCOMMERCIALSSMALL TRADERS
– Percent of Open Interest Longs:24.162.09.2
– Percent of Open Interest Shorts:52.933.98.5
– Net Position:-145,818142,3693,449
– Gross Longs:121,520313,35146,489
– Gross Shorts:267,338170,98243,040
– Long to Short Ratio:0.5 to 11.8 to 11.1 to 1
NET POSITION TREND:
– Strength Index Score (3 Year Range Pct):10.686.842.4
– Strength Index Reading (3 Year Range):Bearish-ExtremeBullish-ExtremeBearish
NET POSITION MOVEMENT INDEX:
– 6-Week Change in Strength Index:-12.010.91.8


Swiss Franc Futures:

Swiss Franc Forex Futures COT ChartPositioning Notes:

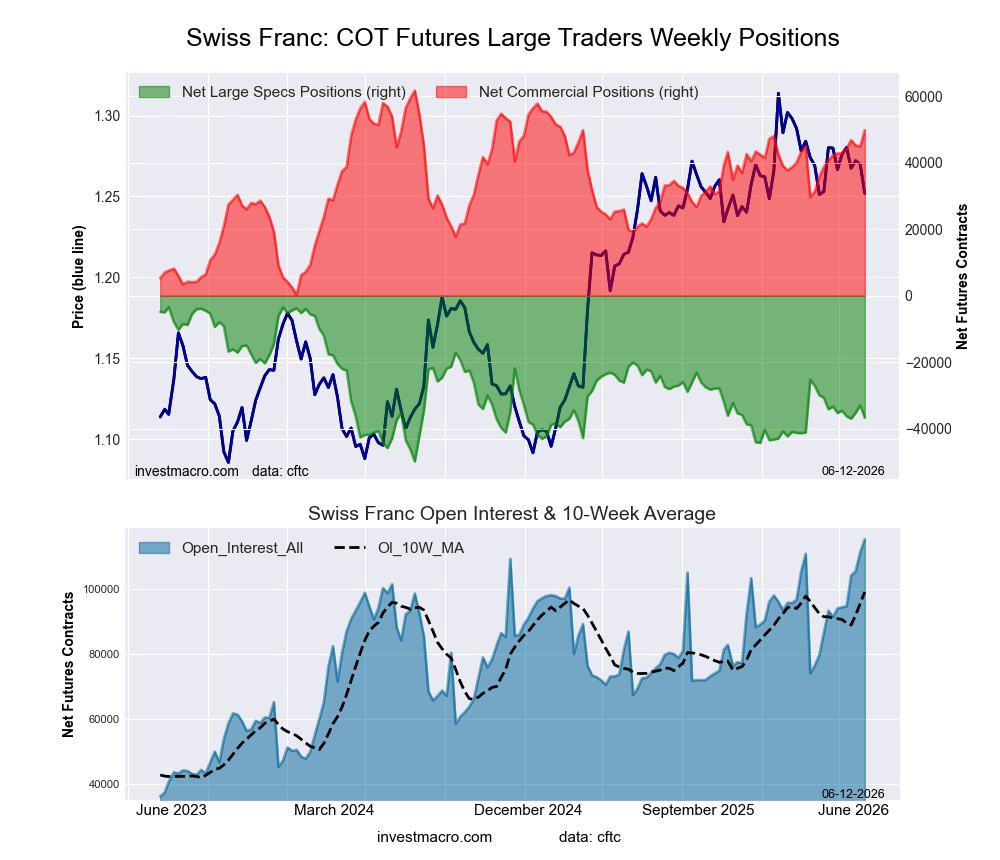
  • Swiss Franc large speculator standing this week came in at a net position of -36,665 contracts in the data reported through Tuesday.
  • Weekly Speculator position reduction of -3,756 contracts from the previous week which had a total of -32,909 net contracts.
  • This week’s current strength score (range over the past 3 years, measured from 0 to 100) shows the speculators are currently Bearish with a score of 28.3 percent.
  • The Commercials are Bullish-Extreme with a score of 80.6 percent.
  • The Small Traders (not shown in chart) are Bearish with a score of 23.3 percent.

Price Trend-Following Model: Strong Downtrend

Our weekly trend-following model classifies the current market price position as: Strong Downtrend.

SWISS FRANC StatisticsSPECULATORSCOMMERCIALSSMALL TRADERS
– Percent of Open Interest Longs:6.482.09.9
– Percent of Open Interest Shorts:38.138.921.2
– Net Position:-36,66549,741-13,076
– Gross Longs:7,33594,61211,370
– Gross Shorts:44,00044,87124,446
– Long to Short Ratio:0.2 to 12.1 to 10.5 to 1
NET POSITION TREND:
– Strength Index Score (3 Year Range Pct):28.380.623.3
– Strength Index Reading (3 Year Range):BearishBullish-ExtremeBearish
NET POSITION MOVEMENT INDEX:
– 6-Week Change in Strength Index:-3.111.4-23.6


Canadian Dollar Futures:

Canadian Dollar Forex Futures COT ChartPositioning Notes:

  • Canadian Dollar large speculator standing this week came in at a net position of -119,999 contracts in the data reported through Tuesday.
  • Weekly Speculator position reduction of -25,888 contracts from the previous week which had a total of -94,111 net contracts.
  • This week’s current strength score (range over the past 3 years, measured from 0 to 100) shows the speculators are currently Bearish with a score of 32.8 percent.
  • The Commercials are Bullish with a score of 69.8 percent.
  • The Small Traders (not shown in chart) are Bearish with a score of 20.7 percent.

Price Trend-Following Model: Strong Downtrend

Our weekly trend-following model classifies the current market price position as: Strong Downtrend.

CANADIAN DOLLAR StatisticsSPECULATORSCOMMERCIALSSMALL TRADERS
– Percent of Open Interest Longs:9.978.48.2
– Percent of Open Interest Shorts:41.244.810.5
– Net Position:-119,999128,812-8,813
– Gross Longs:37,944300,85631,377
– Gross Shorts:157,943172,04440,190
– Long to Short Ratio:0.2 to 11.7 to 10.8 to 1
NET POSITION TREND:
– Strength Index Score (3 Year Range Pct):32.869.820.7
– Strength Index Reading (3 Year Range):BearishBullishBearish
NET POSITION MOVEMENT INDEX:
– 6-Week Change in Strength Index:-35.136.9-28.3


Australian Dollar Futures:

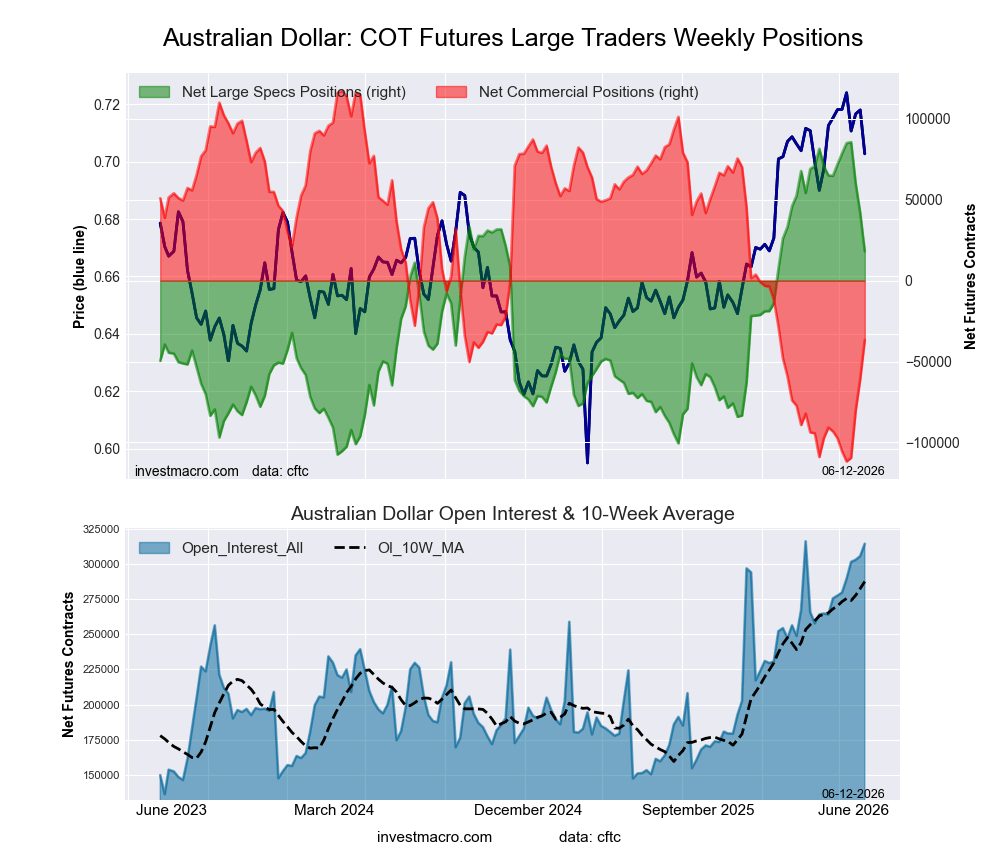
Australian Dollar Forex Futures COT ChartPositioning Notes:

  • Australian Dollar large speculator standing this week came in at a net position of 18,160 contracts in the data reported through Tuesday.
  • Weekly Speculator position reduction of -23,652 contracts from the previous week which had a total of 41,812 net contracts.
  • This week’s current strength score (range over the past 3 years, measured from 0 to 100) shows the speculators are currently Bullish with a score of 65.1 percent.
  • The Commercials are Bearish with a score of 32.8 percent.
  • The Small Traders (not shown in chart) are Bullish with a score of 79.0 percent.

Price Trend-Following Model: Weak Uptrend

Our weekly trend-following model classifies the current market price position as: Weak Uptrend.

AUSTRALIAN DOLLAR StatisticsSPECULATORSCOMMERCIALSSMALL TRADERS
– Percent of Open Interest Longs:29.654.912.3
– Percent of Open Interest Shorts:23.866.66.4
– Net Position:18,160-36,66918,509
– Gross Longs:92,995172,45138,751
– Gross Shorts:74,835209,12020,242
– Long to Short Ratio:1.2 to 10.8 to 11.9 to 1
NET POSITION TREND:
– Strength Index Score (3 Year Range Pct):65.132.879.0
– Strength Index Reading (3 Year Range):BullishBearishBullish
NET POSITION MOVEMENT INDEX:
– 6-Week Change in Strength Index:-27.826.5-14.9


New Zealand Dollar Futures:

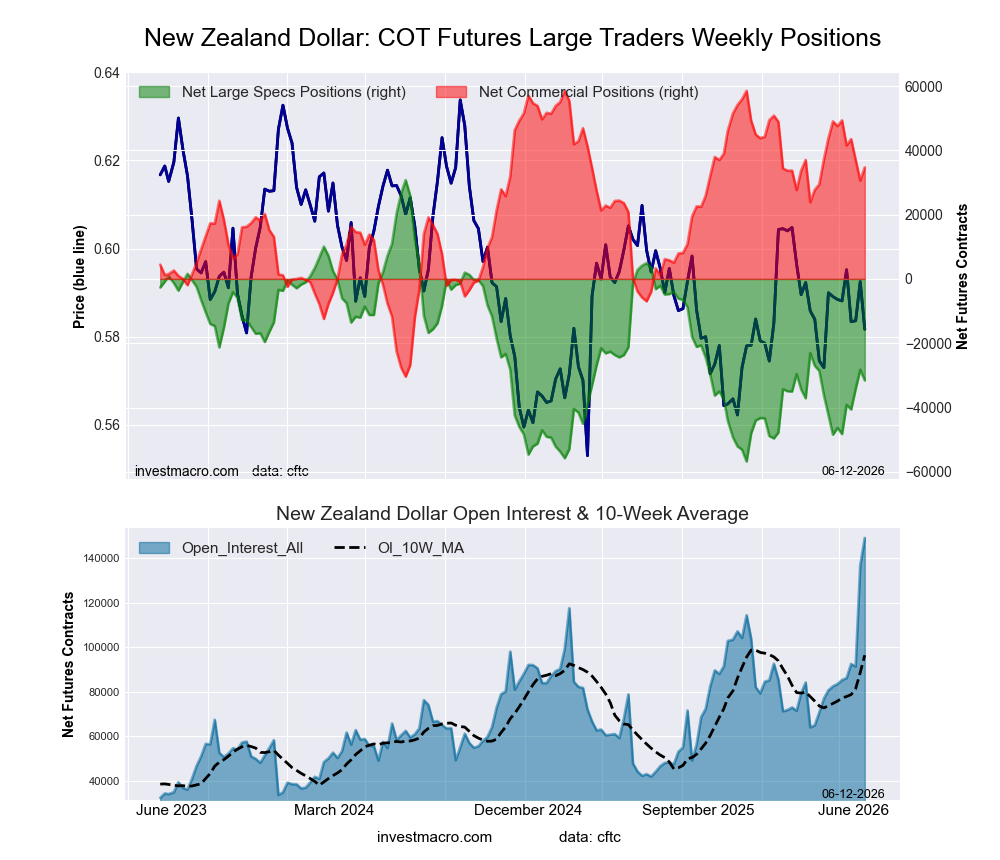
New Zealand Dollar Forex Futures COT ChartPositioning Notes:

  • New Zealand Dollar large speculator standing this week came in at a net position of -31,571 contracts in the data reported through Tuesday.
  • Weekly Speculator position fall of -3,325 contracts from the previous week which had a total of -28,246 net contracts.
  • This week’s current strength score (range over the past 3 years, measured from 0 to 100) shows the speculators are currently Bearish with a score of 28.8 percent.
  • The Commercials are Bullish with a score of 73.1 percent.
  • The Small Traders (not shown in chart) are Bearish-Extreme with a score of 9.1 percent.

Price Trend-Following Model: Downtrend

Our weekly trend-following model classifies the current market price position as: Downtrend.

NEW ZEALAND DOLLAR StatisticsSPECULATORSCOMMERCIALSSMALL TRADERS
– Percent of Open Interest Longs:7.983.41.9
– Percent of Open Interest Shorts:29.060.24.0
– Net Position:-31,57134,705-3,134
– Gross Longs:11,764124,4822,830
– Gross Shorts:43,33589,7775,964
– Long to Short Ratio:0.3 to 11.4 to 10.5 to 1
NET POSITION TREND:
– Strength Index Score (3 Year Range Pct):28.873.19.1
– Strength Index Reading (3 Year Range):BearishBullishBearish-Extreme
NET POSITION MOVEMENT INDEX:
– 6-Week Change in Strength Index:16.9-14.4-25.5


Mexican Peso Futures:

Mexican Peso Futures COT ChartPositioning Notes:

  • Mexican Peso large speculator standing this week came in at a net position of 63,801 contracts in the data reported through Tuesday.
  • Weekly Speculator position boost of 9,144 contracts from the previous week which had a total of 54,657 net contracts.
  • This week’s current strength score (range over the past 3 years, measured from 0 to 100) shows the speculators are currently Bearish with a score of 46.3 percent.
  • The Commercials are Bullish with a score of 51.8 percent.
  • The Small Traders (not shown in chart) are Bullish with a score of 60.6 percent.

Price Trend-Following Model: Strong Uptrend

Our weekly trend-following model classifies the current market price position as: Strong Uptrend.

MEXICAN PESO StatisticsSPECULATORSCOMMERCIALSSMALL TRADERS
– Percent of Open Interest Longs:46.945.33.8
– Percent of Open Interest Shorts:17.077.31.7
– Net Position:63,801-68,3514,550
– Gross Longs:100,19996,9598,190
– Gross Shorts:36,398165,3103,640
– Long to Short Ratio:2.8 to 10.6 to 12.2 to 1
NET POSITION TREND:
– Strength Index Score (3 Year Range Pct):46.351.860.6
– Strength Index Reading (3 Year Range):BearishBullishBullish
NET POSITION MOVEMENT INDEX:
– 6-Week Change in Strength Index:-2.83.0-2.3


Brazilian Real Futures:

Brazil Real Futures COT ChartPositioning Notes:

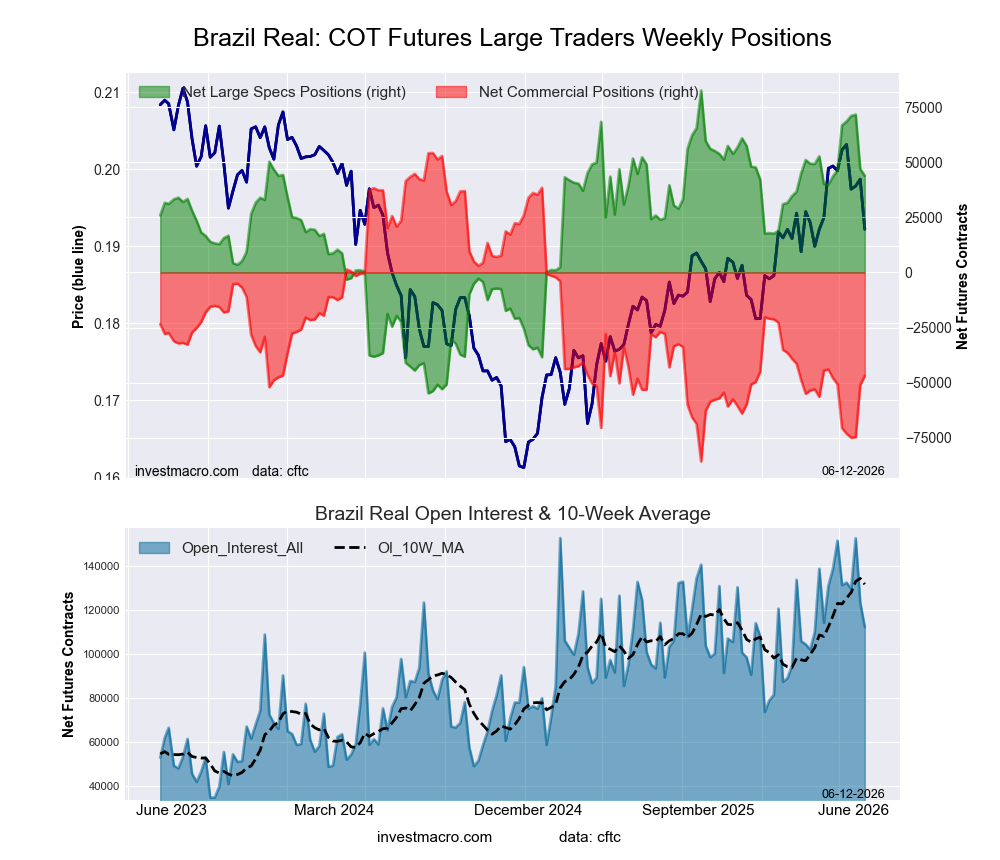
  • Brazilian Real large speculator standing this week came in at a net position of 43,846 contracts in the data reported through Tuesday.
  • Weekly Speculator position fall of -3,134 contracts from the previous week which had a total of 46,980 net contracts.
  • This week’s current strength score (range over the past 3 years, measured from 0 to 100) shows the speculators are currently Bullish with a score of 71.8 percent.
  • The Commercials are Bearish with a score of 27.7 percent.
  • The Small Traders (not shown in chart) are Bearish with a score of 38.3 percent.

Price Trend-Following Model: Uptrend

Our weekly trend-following model classifies the current market price position as: Uptrend.

BRAZIL REAL StatisticsSPECULATORSCOMMERCIALSSMALL TRADERS
– Percent of Open Interest Longs:73.022.24.0
– Percent of Open Interest Shorts:33.964.01.2
– Net Position:43,846-46,9463,100
– Gross Longs:81,81424,8454,463
– Gross Shorts:37,96871,7911,363
– Long to Short Ratio:2.2 to 10.3 to 13.3 to 1
NET POSITION TREND:
– Strength Index Score (3 Year Range Pct):71.827.738.3
– Strength Index Reading (3 Year Range):BullishBearishBearish
NET POSITION MOVEMENT INDEX:
– 6-Week Change in Strength Index:-1.92.7-7.1


Bitcoin Futures:

Bitcoin Crypto Futures COT ChartPositioning Notes:

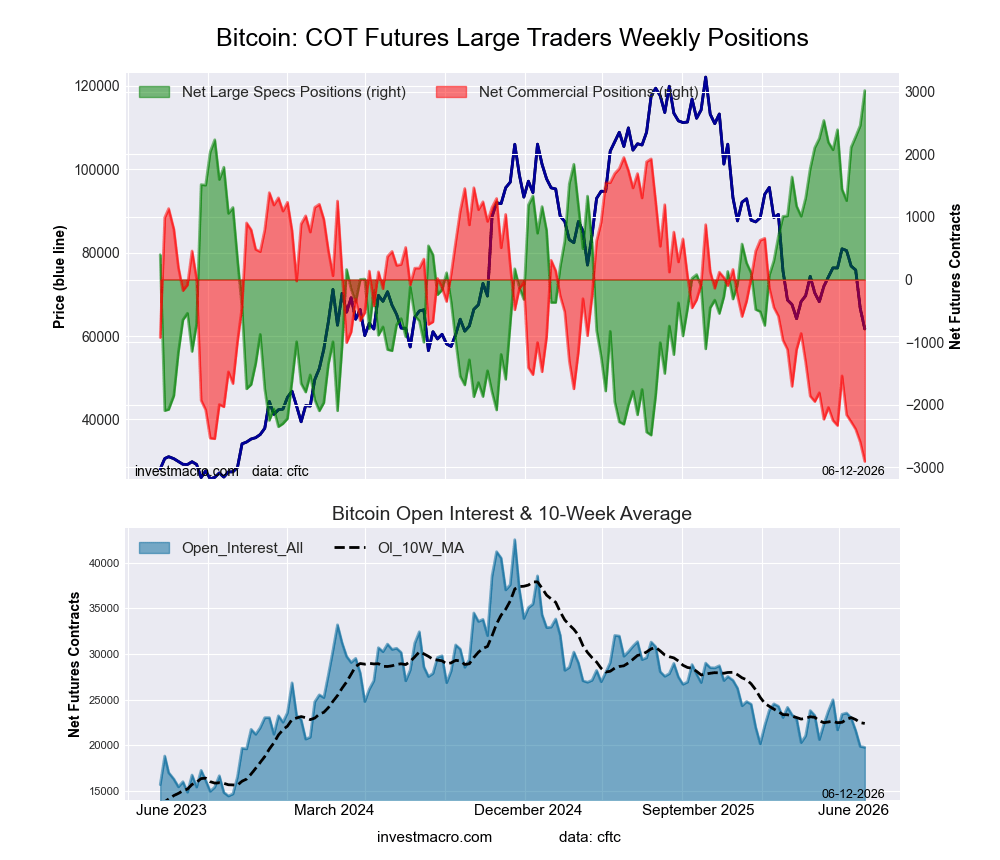
  • Bitcoin large speculator standing this week came in at a net position of 3,018 contracts in the data reported through Tuesday.
  • Weekly Speculator position rise of 560 contracts from the previous week which had a total of 2,458 net contracts.
  • This week’s current strength score (range over the past 3 years, measured from 0 to 100) shows the speculators are currently Bullish-Extreme with a score of 100.0 percent.
  • The Commercials are Bearish-Extreme with a score of 0.0 percent.
  • The Small Traders (not shown in chart) are Bearish with a score of 31.5 percent.

Price Trend-Following Model: Downtrend

Our weekly trend-following model classifies the current market price position as: Downtrend.

BITCOIN StatisticsSPECULATORSCOMMERCIALSSMALL TRADERS
– Percent of Open Interest Longs:86.90.55.1
– Percent of Open Interest Shorts:71.615.25.7
– Net Position:3,018-2,906-112
– Gross Longs:17,1781061,009
– Gross Shorts:14,1603,0121,121
– Long to Short Ratio:1.2 to 10.0 to 10.9 to 1
NET POSITION TREND:
– Strength Index Score (3 Year Range Pct):100.00.031.5
– Strength Index Reading (3 Year Range):Bullish-ExtremeBearish-ExtremeBearish
NET POSITION MOVEMENT INDEX:
– 6-Week Change in Strength Index:11.4-11.8-2.7


Article By InvestMacroReceive our weekly COT Reports by Email

*COT Report: The COT data, released weekly to the public each Friday, is updated through the most recent Tuesday (data is 3 days old) and shows a quick view of how large speculators or non-commercials (for-profit traders) were positioned in the futures markets.

The CFTC categorizes trader positions according to commercial hedgers (traders who use futures contracts for hedging as part of the business), non-commercials (large traders who speculate to realize trading profits) and nonreportable traders (usually small traders/speculators) as well as their open interest (contracts open in the market at time of reporting).See CFTC criteria here.

All information and opinions on this website and contained in this article are for general informational purposes only and do not constitute investment advice.


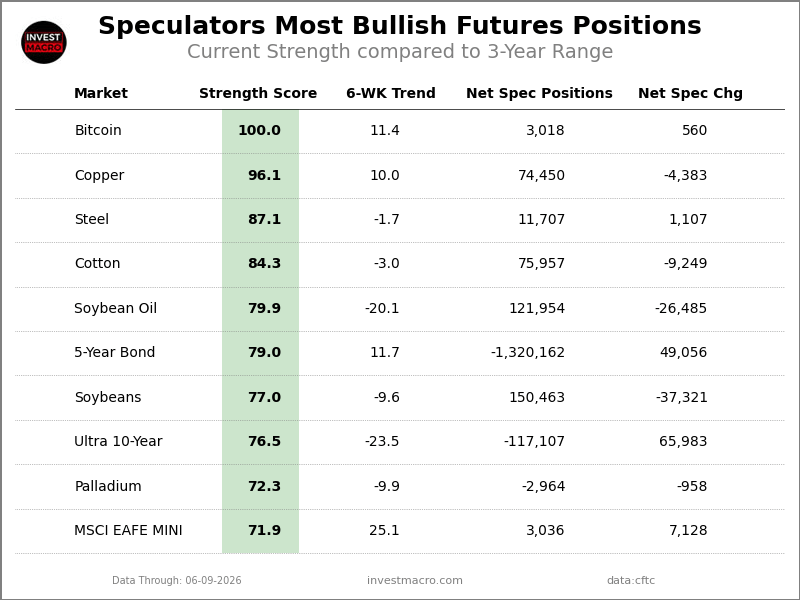
Speculator Extremes: Bitcoin, Copper & Steel lead weekly Bullish Positions

By InvestMacro 

The latest update for the weekly Commitment of Traders (COT) report was released by the Commodity Futures Trading Commission (CFTC) on Friday for data ending on Tuesday June 9th.

This weekly Extreme Positions report highlights the Most Bullish and Most Bearish Positions for the speculator category and is a current snapshot of how speculators were positioned as of Tuesday. Extreme positioning in these markets can foreshadow strong moves in the underlying market.

To signify an extreme position, we use the Strength Index (also known as the COT Index) of each instrument, a common method of measuring COT data. The Strength Index is simply a comparison of current trader positions against the range of positions over the previous 3 years. We use over 80 percent as extremely bullish and under 20 percent as extremely bearish (Compare Strength Index scores across all markets in the data table or cot leaders table).

The 6-WK Trend score is the change in the Strength Index over the past 6 weeks and signals how strong and which way the Strength Index is going.


Extreme Bullish Speculator Table


Here Are This Week’s Most Bullish Speculator Positions:

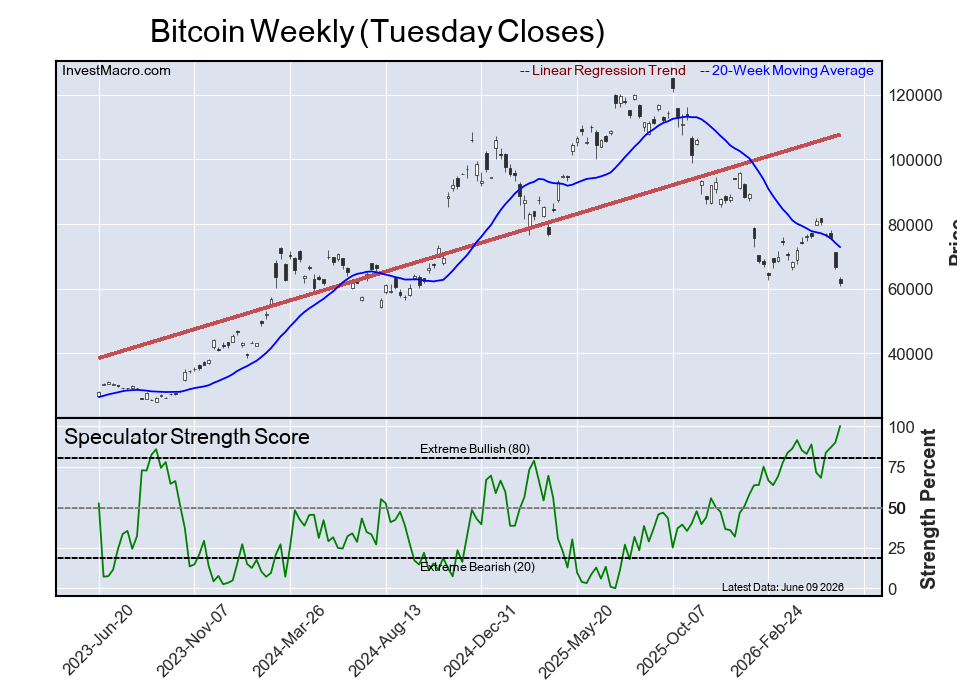
Bitcoin

Extreme Bullish Leader
The Bitcoin speculator position comes in as the most bullish extreme standing this week as the Bitcoin speculator level is currently at a 100 percent score of its 3-year range.

The six-week trend for the percent strength score totaled a boost of 11 percentage points this week. The overall net speculator position was a total of 3,018 net contracts this week with an advance of 560 contract in the weekly speculator bets.

The Bitcoin speculator positioning is often seen as a hedging position as many times when Bitcoin drops speculator bets go up and vice versa.


Speculators or Non-Commercials Notes:

Speculators, classified as non-commercial traders by the CFTC, are made up of large commodity funds, hedge funds and other significant for-profit participants. The Specs are generally regarded as trend-followers in their behavior towards price action – net speculator bets and prices tend to go in the same directions. These traders often look to buy when prices are rising and sell when prices are falling. To illustrate this point, many times speculator contracts can be found at their most extremes (bullish or bearish) when prices are also close to their highest or lowest levels.

These extreme levels can be dangerous for the large speculators as the trade is most crowded, there is less trading ammunition still sitting on the sidelines to push the trend further and prices have moved a significant distance. When the trend becomes exhausted, some speculators take profits while others look to also exit positions when prices fail to continue in the same direction. This process usually plays out over many months to years and can ultimately create a reverse effect where prices start to fall and speculators start a process of selling when prices are falling.


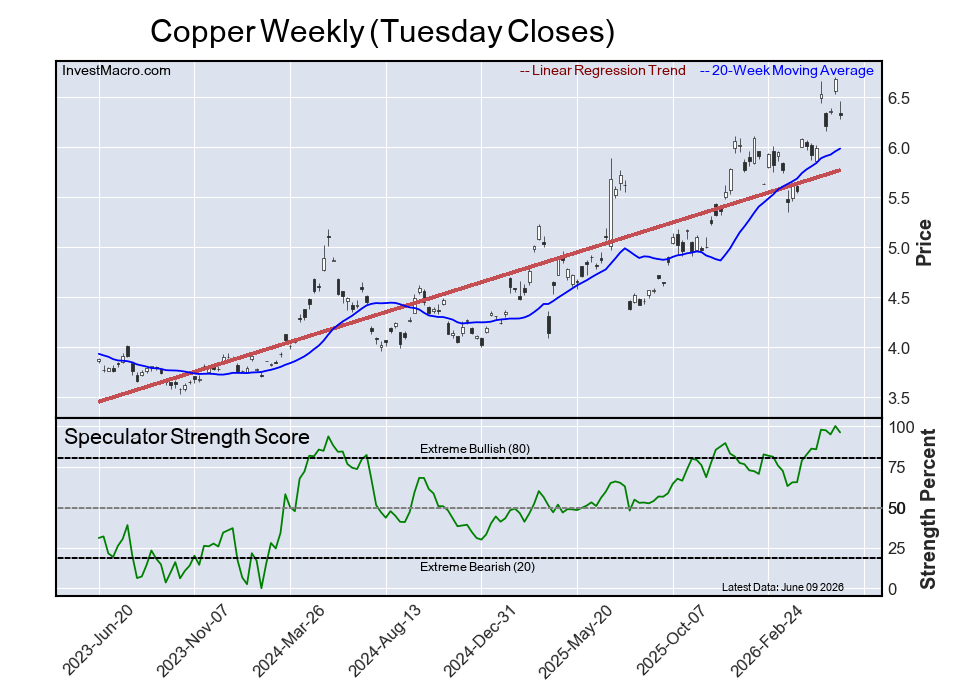
Copper

Extreme Bullish Leader
The Copper speculator position comes next in the extreme standings this week as the Copper speculator level is now at a 96 percent score of its 3-year range.

The six-week trend for the percent strength score was a rise higher by 10 percentage points this week. The speculator position registered 74,450 net contracts this week with a decline of -4,383 contracts in speculator bets.


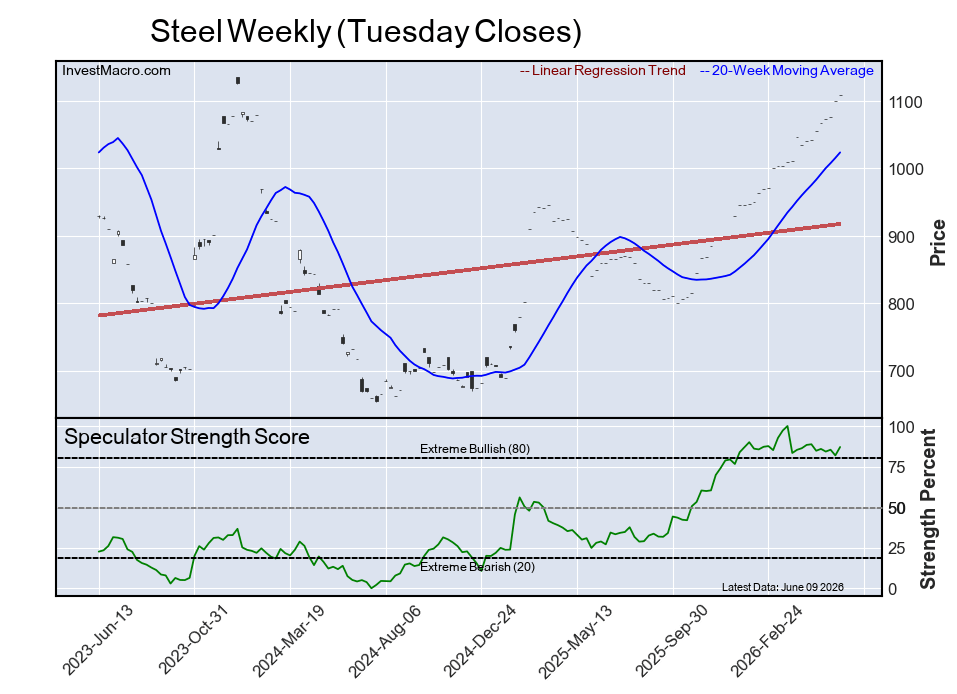
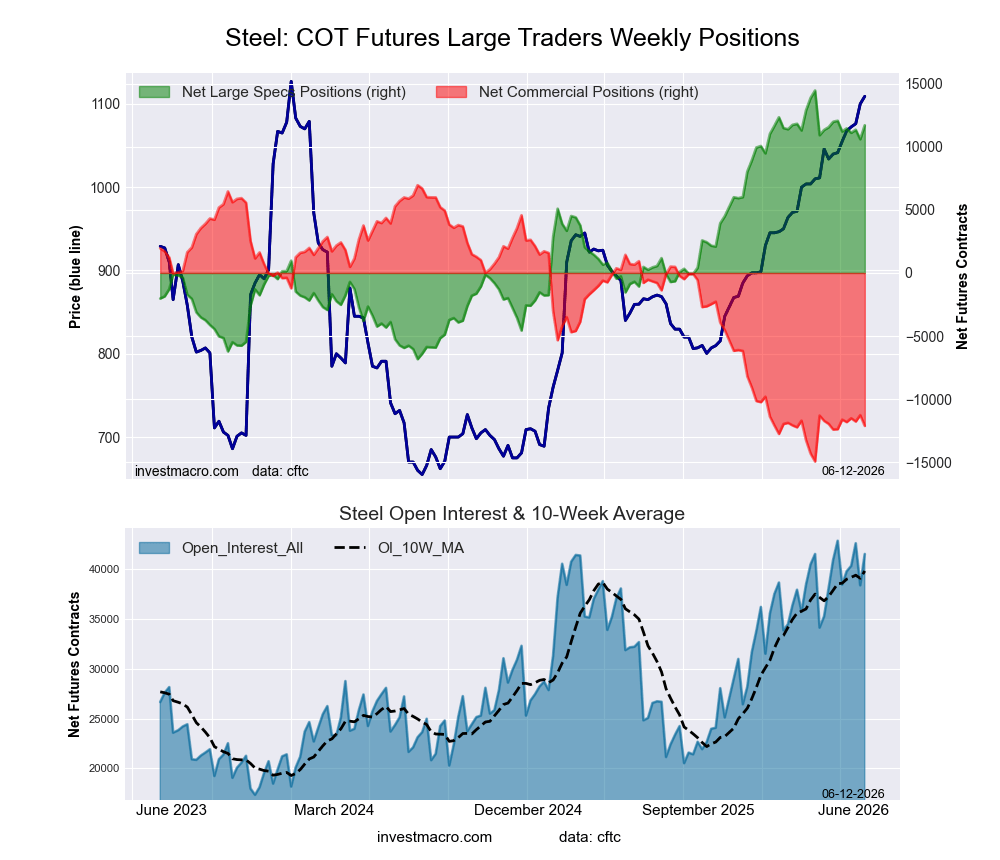
Steel

Extreme Bullish Leader
The Steel speculator position comes in third this week in the extreme standings with the Steel speculator level residing at an 87 percent score of its 3-year range.

The six-week trend for the speculator strength score came in at a decrease of -2 percentage points this week. The overall speculator position was 11,707 net contracts this week with a gain of 1,107 contracts in the weekly speculator bets.


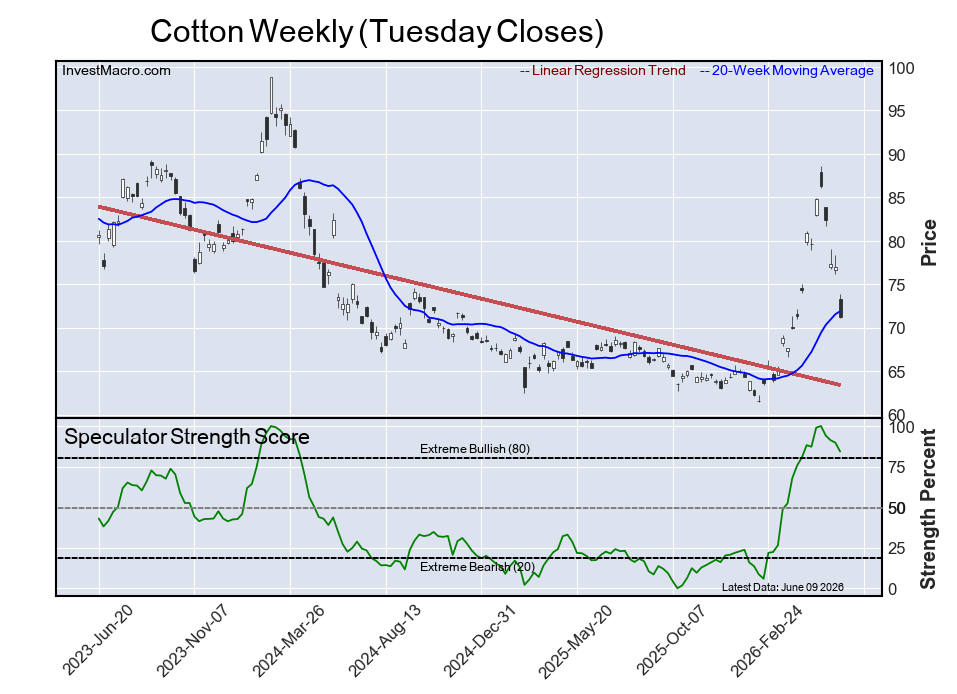
Cotton

Extreme Bullish Leader
The Cotton speculator position comes up number four in the extreme standings this week. The Cotton speculator level is at a 84 percent score of its 3-year range.

The six-week trend for the speculator strength score totaled a decline of -3 percentage points this week and the overall speculator position was 75,957 net contracts this week with a decline of -9,249 contracts in the speculator bets.


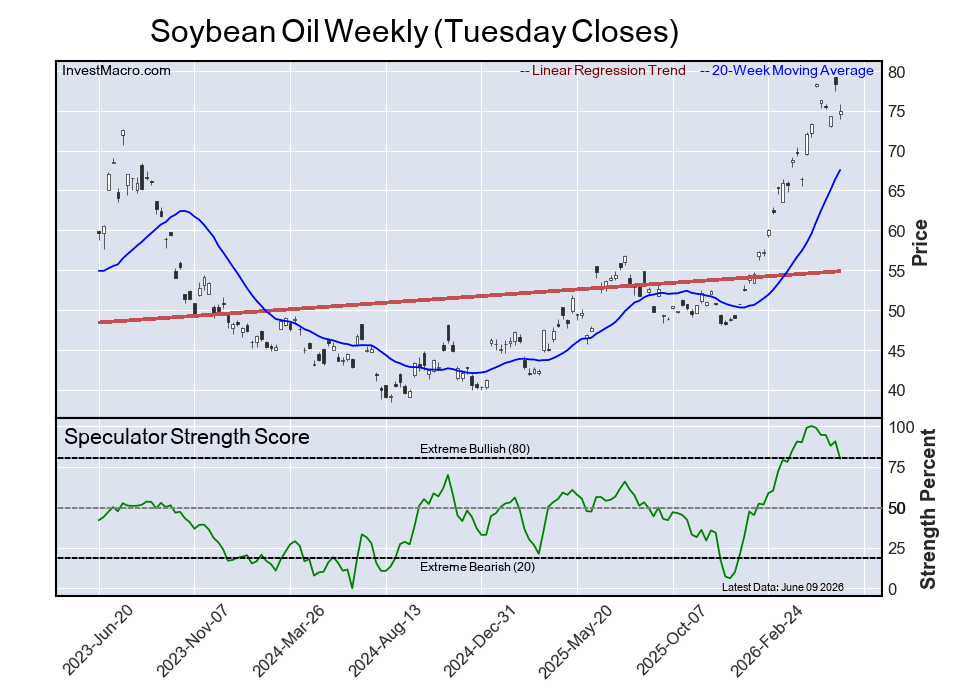
Soybean Oil

Extreme Bullish Leader
The Soybean Oil speculator position rounds out the top five in this week’s bullish extreme standings as the Soybean Oil speculator level sits at a 80 percent score of its 3-year range. The six-week trend for the speculator strength score was a decline of -20 percentage points this week.

The speculator position was 121,954 net contracts this week with a fall of -26,485 contracts in the weekly speculator bets.


The Most Bearish Speculator Positions of the Week:

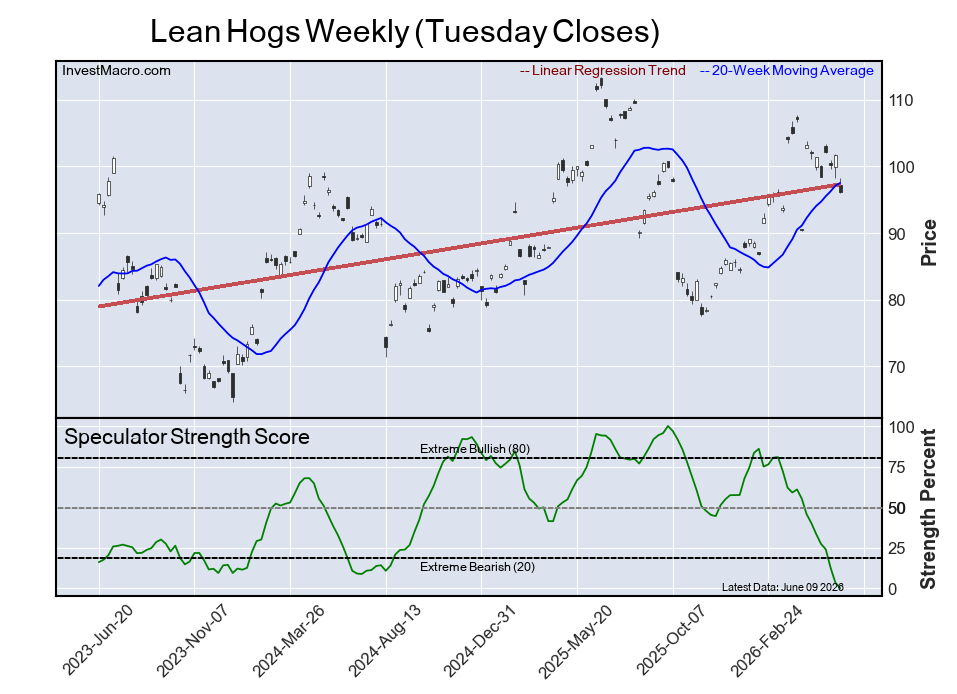
Lean Hogs

Extreme Bearish Leader
The Lean Hogs speculator position comes in tied as the most bearish extreme standing this week as the Lean Hogs speculator level is at a 0 percent or minimum score of its 3-year range.

The six-week trend for the speculator strength score was a decline by -40 percentage points this week while the overall speculator position was -42,121 net contracts this week with a decrease of -5,067 contracts in the speculator bets.


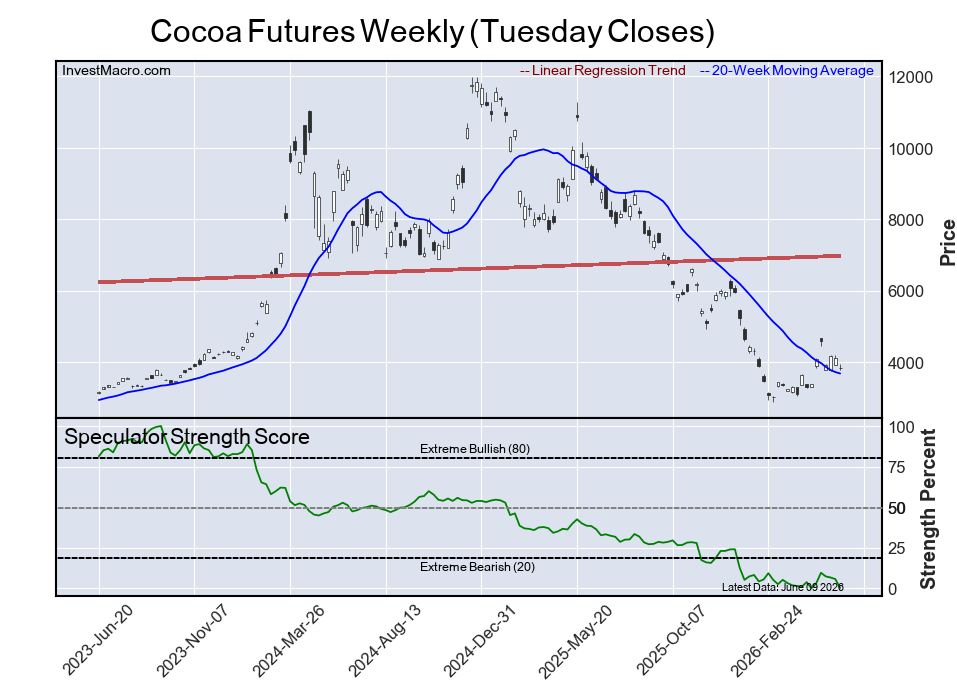
Cocoa Futures

Extreme Bearish Leader
The Cocoa Futures speculator position comes in next and tied for the most bearish extreme standing on the week with the Cocoa speculator level is at 0 percent score of its 3-year range.

The six-week trend for the speculator strength score showed no change this week while the speculator position was -23,497 net contracts this week with a retreat of -6,185 contracts in the weekly speculator bets.


3-Month Secured Overnight Financing Rate

Extreme Bearish Leader
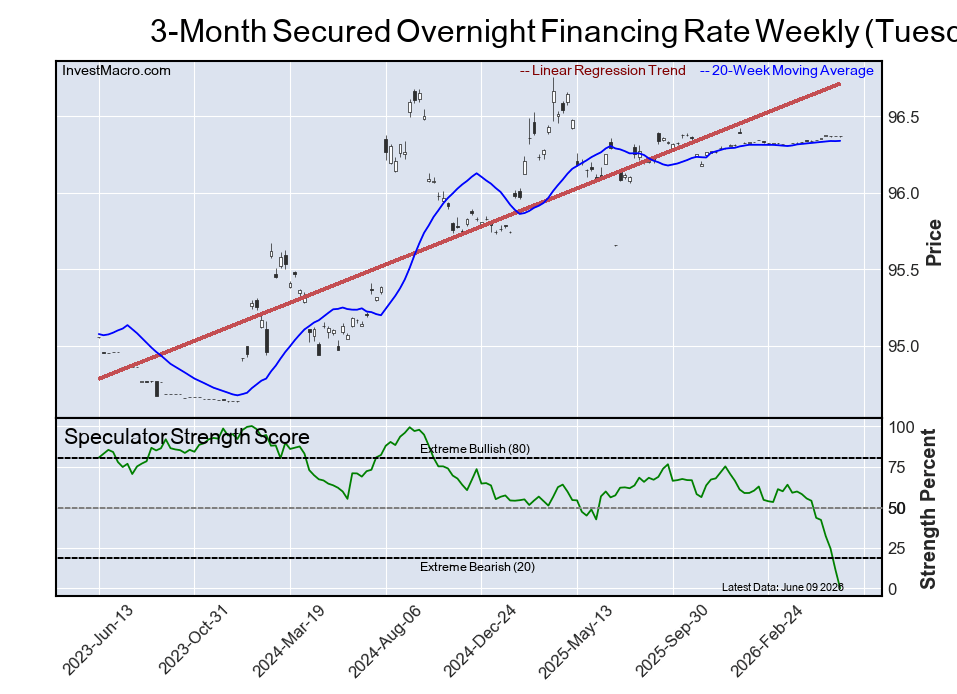
The 3-Month Secured Overnight Financing Rate speculator position comes in also tied as most bearish extreme standing of the week. The SOFR 3-Months speculator level resides at a 0 percent score of its 3-year range.

The six-week trend for the speculator strength score was a reduction of -54 percentage points this week and the overall speculator position was -2,534,063 net contracts this week with a reduction of -385,462 contracts in the speculator bets.


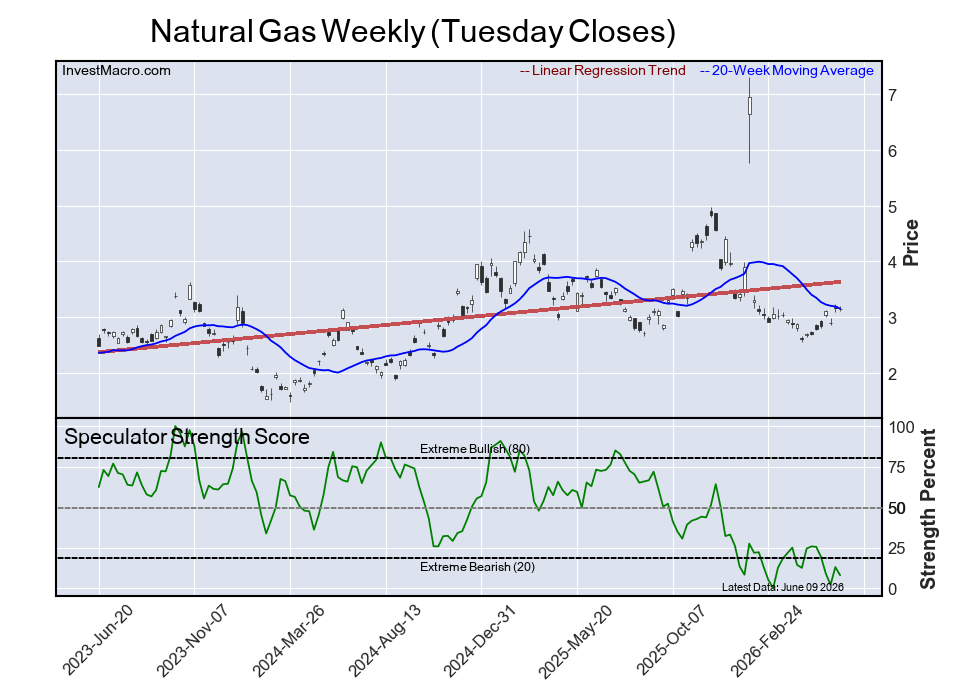
Natural Gas

Extreme Bearish Leader
The Natural Gas speculator position comes in as this week’s fourth most bearish extreme standing as the Natural Gas speculator level is at an 8 percent score of its 3-year range.

The six-week trend for the speculator strength score was a fall by -18 percentage points this week. The speculator position was -193,957 net contracts this week with a drop of -7,842 contracts in the weekly speculator bets.


Japanese Yen

Extreme Bearish Leader
Next, the Japanese Yen speculator position comes in as the fifth most bearish extreme standing for this week. The JPY speculator level is at a 11 percent score of its 3-year range.

The six-week trend for the speculator strength score was a drop of -12 percentage points this week and the speculator position was -145,818 net contracts this week with a decline of -16,251 contracts in the weekly speculator bets.


Article By InvestMacroReceive our weekly COT Reports by Email

*COT Report: The COT data, released weekly to the public each Friday, is updated through the most recent Tuesday (data is 3 days old) and shows a quick view of how large speculators or non-commercials (for-profit traders) were positioned in the futures markets.

The CFTC categorizes trader positions according to commercial hedgers (traders who use futures contracts for hedging as part of the business), non-commercials (large traders who speculate to realize trading profits) and nonreportable traders (usually small traders/speculators) as well as their open interest (contracts open in the market at time of reporting).See CFTC criteria here.

All information and opinions on this website and contained in this article are for general informational purposes only and do not constitute investment advice.
COT Metals Charts: Speculator Bets led by Steel

By InvestMacro 

Metals Open Interest COT Chart
Here are the latest charts and statistics for the Commitment of Traders (COT) data published by the Commodities Futures Trading Commission (CFTC).

The latest COT data is updated through Tuesday June 9th and shows a quick view of how large traders (for-profit speculators and commercial entities) were positioned in the futures markets.

Weekly Speculator Changes led by Steel

Metals Net Positions COT Chart
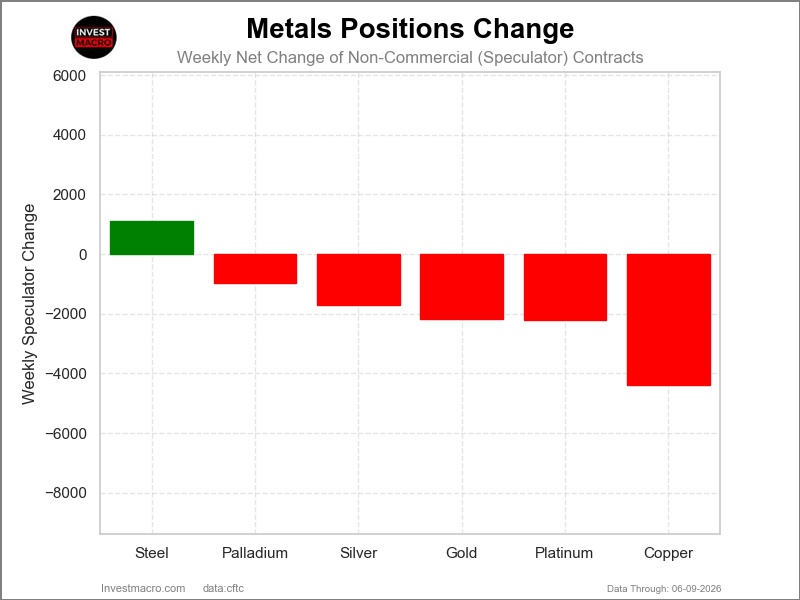
The COT metals markets speculator bets were overall lower this week as just one out of the six metals markets we cover had higher positioning while the other five markets had lower speculator contracts.

Leading the gains for the metals was Steel with a modest rise by 1,107 weekly contracts.

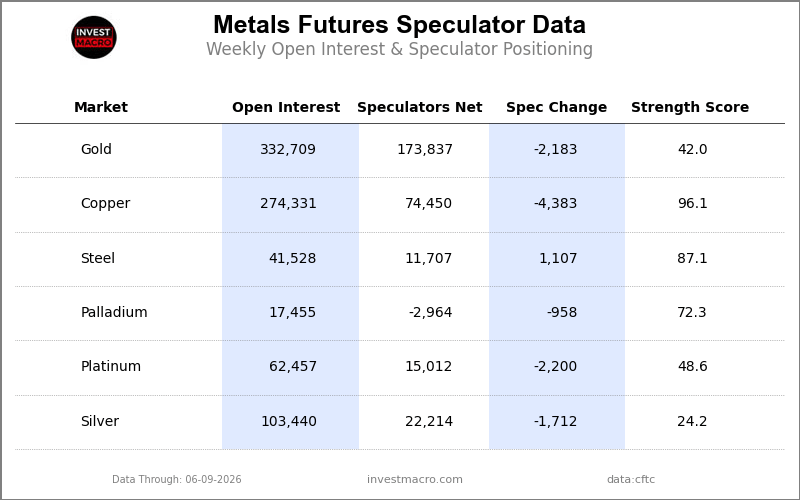
The markets with declines in speculator bets for the week were Copper (-4,383 contracts), Platinum (-2,200 contracts), Gold (-2,183 contracts), Silver (-1,712 contracts) and with Palladium (-958 contracts) also registering lower bets on the week.

Palladium and Copper lead Metals markets price changes

Leading the Metals markets this week in price performance was Palladium, which saw a rise by 4.57%. Copper came in next with a 3.18% gain. Steel rose by 0.64%, and Silver rounded out the gainers with a 0.37% rise.

On the downside, Gold fell by -2.39%, and Platinum showed the biggest decline on the week with a -2.77% drop.


Metals Data:

Metals Table COT Chart
Legend: Weekly Speculators Change | Speculators Current Net Position | Speculators Strength Score compared to last 3-Years (0-100 range)


Strength Scores led by Copper & Steel

Metals Strength Scores COT Chart
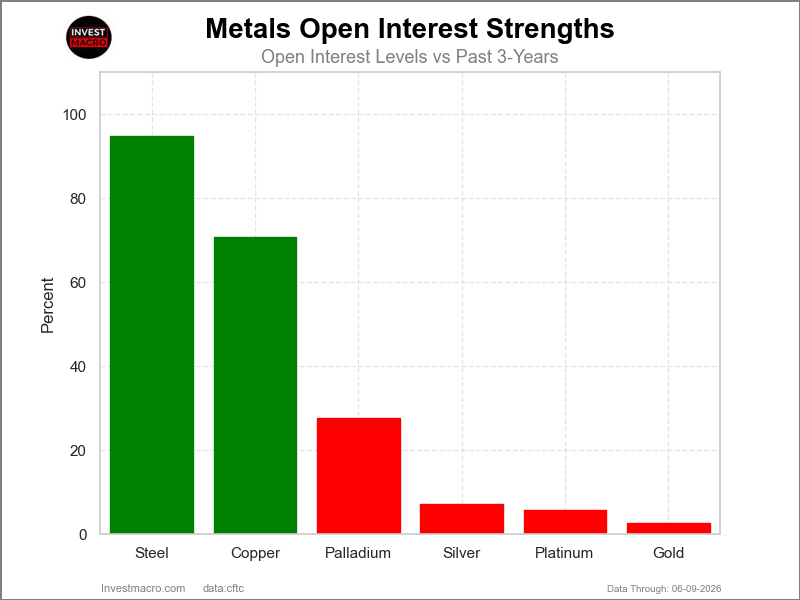
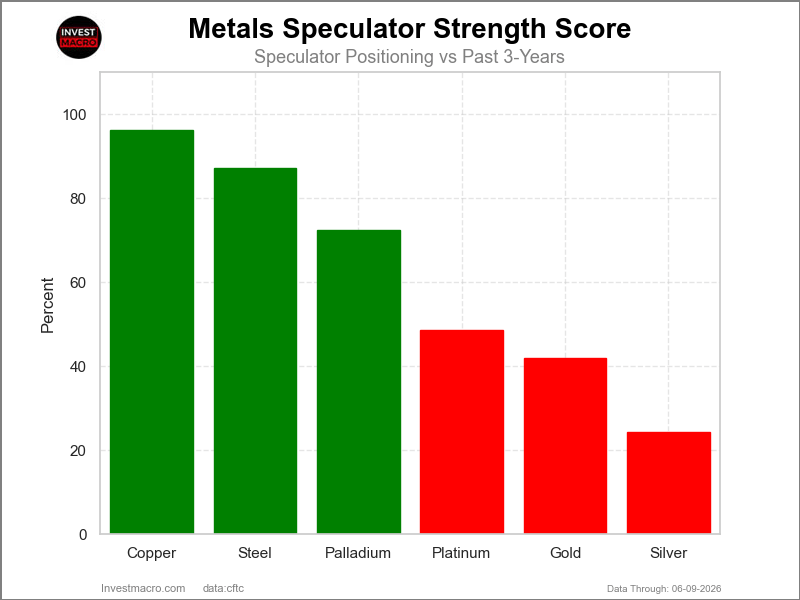
COT Strength Scores (a normalized measure of Speculator positions over a 3-Year range, from 0 to 100 where above 80 is Extreme-Bullish and below 20 is Extreme-Bearish) showed that Copper (96 percent) and Steel (87 percent) lead the metals markets this week. Palladium (72 percent) comes in as the next highest in the weekly strength scores.

On the downside, Silver (24 percent) comes in at the lowest strength level currently and the next lowest strength score was Gold (42 percent).

Strength Statistics:
Gold (42.0 percent) vs Gold previous week (42.9 percent)
Silver (24.2 percent) vs Silver previous week (27.1 percent)
Copper (96.1 percent) vs Copper previous week (100.0 percent)
Platinum (48.6 percent) vs Platinum previous week (54.1 percent)
Palladium (72.3 percent) vs Palladium previous week (78.7 percent)
Steel (87.1 percent) vs Steel previous week (81.9 percent)


Copper & Gold top the 6-Week Strength Trends

Metals Trends COT Chart
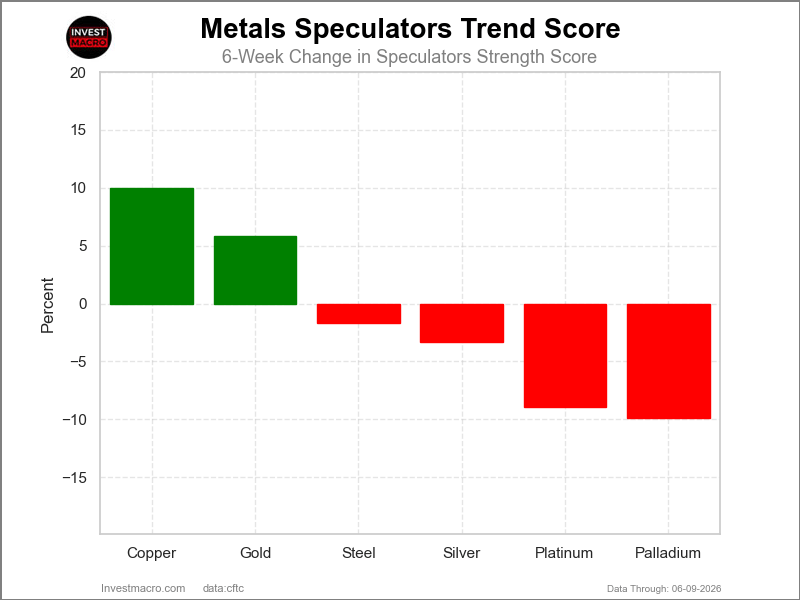
COT Strength Score Trends (or move index, calculates the 6-week changes in strength scores) showed that Copper (10 percent) and Gold (6 percent) lead the past six weeks trends for metals.

Palladium (-10 percent) leads the downside trend scores currently with Platinum (-9 percent) as the next market with lower trend scores.

Move Statistics:
Gold (5.8 percent) vs Gold previous week (4.9 percent)
Silver (-3.3 percent) vs Silver previous week (0.3 percent)
Copper (10.0 percent) vs Copper previous week (17.6 percent)
Platinum (-8.9 percent) vs Platinum previous week (-8.3 percent)
Palladium (-9.9 percent) vs Palladium previous week (-6.7 percent)
Steel (-1.7 percent) vs Steel previous week (-6.5 percent)


Individual Markets:

Gold Comex Futures Futures:

Gold Futures COT ChartPositioning Notes:

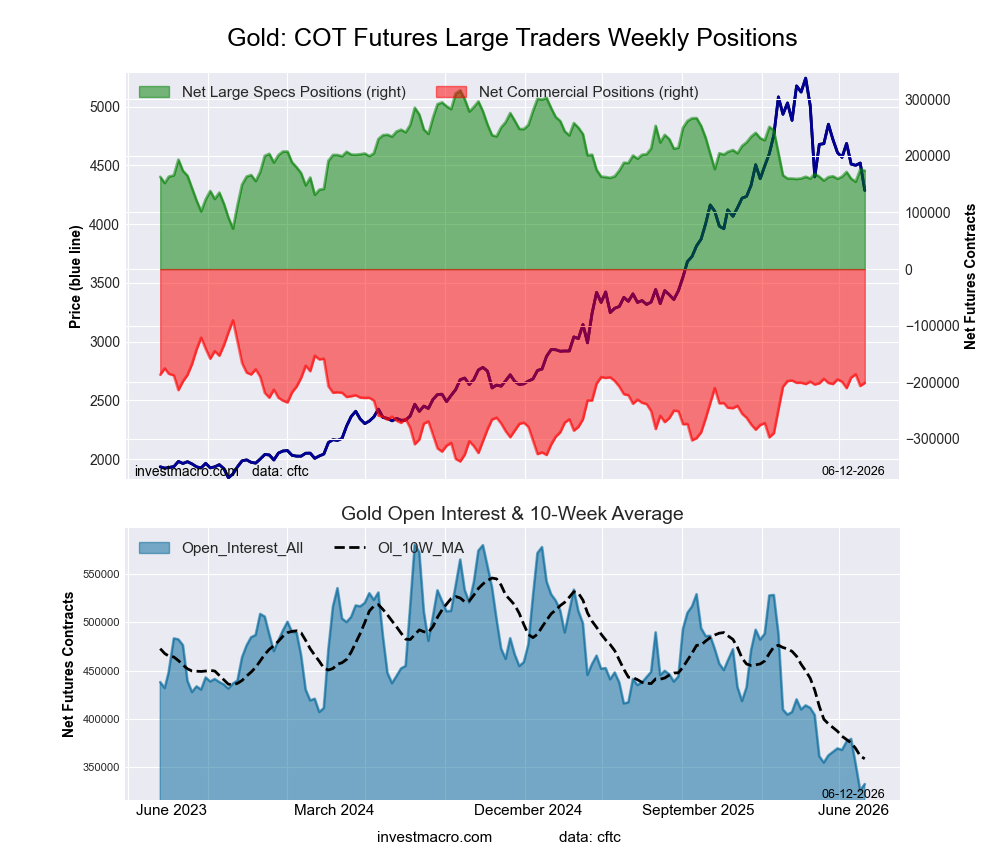
  • Gold Comex Futures large speculator standing this week came in at a net position of 173,837 contracts in the data reported through Tuesday.
  • Weekly Speculator position reduction of -2,183 contracts from the previous week which had a total of 176,020 net contracts.
  • This week’s current strength score (range over the past 3 years, measured from 0 to 100) shows the speculators are currently Bearish with a score of 42.0 percent.
  • The Commercials are Bullish with a score of 55.6 percent.
  • The Small Traders (not shown in chart) are Bearish with a score of 45.5 percent.

Price Trend-Following Model: Strong Downtrend

Our weekly trend-following model classifies the current market price position as: Strong Downtrend.

Gold Futures StatisticsSPECULATORSCOMMERCIALSSMALL TRADERS
– Percent of Open Interest Longs:62.517.712.9
– Percent of Open Interest Shorts:10.378.24.7
– Net Position:173,837-201,03627,199
– Gross Longs:207,98458,98642,891
– Gross Shorts:34,147260,02215,692
– Long to Short Ratio:6.1 to 10.2 to 12.7 to 1
NET POSITION TREND:
– Strength Index Score (3 Year Range Pct):42.055.645.5
– Strength Index Reading (3 Year Range):BearishBullishBearish
NET POSITION MOVEMENT INDEX:
– 6-Week Change in Strength Index:5.8-2.5-23.5


Silver Comex Futures Futures:

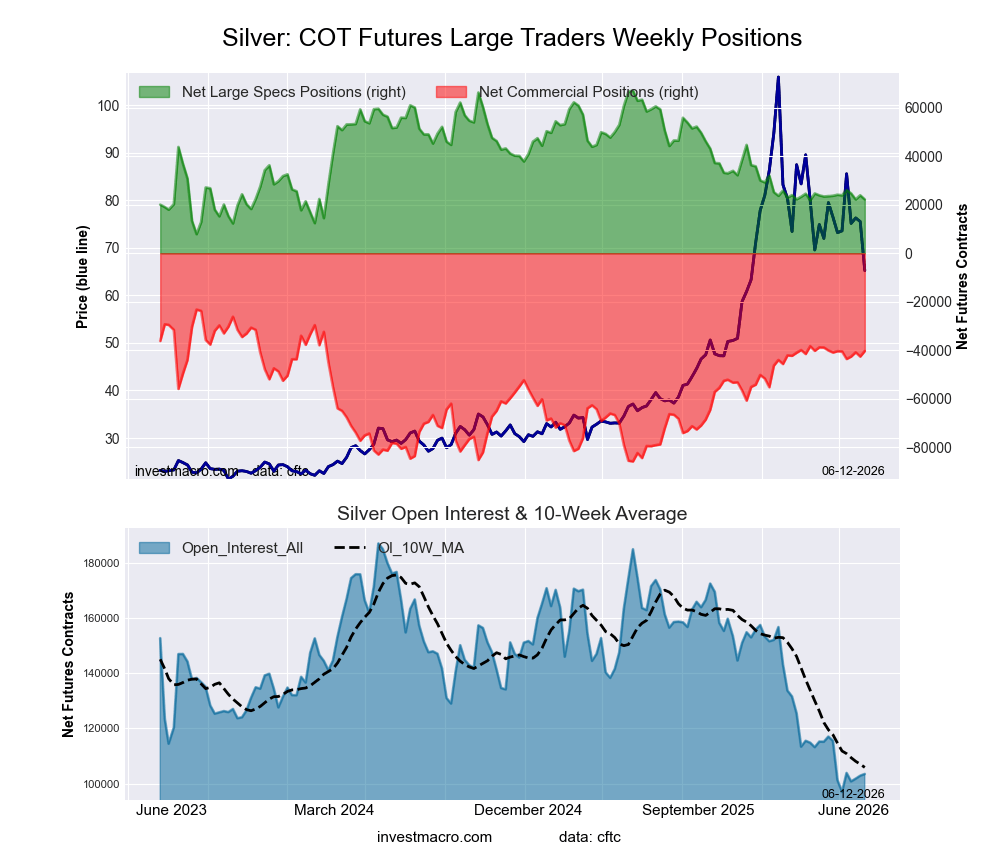
Silver Futures COT ChartPositioning Notes:

  • Silver Comex Futures large speculator standing this week came in at a net position of 22,214 contracts in the data reported through Tuesday.
  • Weekly Speculator position lowering of -1,712 contracts from the previous week which had a total of 23,926 net contracts.
  • This week’s current strength score (range over the past 3 years, measured from 0 to 100) shows the speculators are currently Bearish with a score of 24.2 percent.
  • The Commercials are Bullish with a score of 72.7 percent.
  • The Small Traders (not shown in chart) are Bullish with a score of 52.7 percent.

Price Trend-Following Model: Strong Downtrend

Our weekly trend-following model classifies the current market price position as: Strong Downtrend.

Silver Futures StatisticsSPECULATORSCOMMERCIALSSMALL TRADERS
– Percent of Open Interest Longs:31.425.826.8
– Percent of Open Interest Shorts:9.964.89.2
– Net Position:22,214-40,36818,154
– Gross Longs:32,48726,66027,673
– Gross Shorts:10,27367,0289,519
– Long to Short Ratio:3.2 to 10.4 to 12.9 to 1
NET POSITION TREND:
– Strength Index Score (3 Year Range Pct):24.272.752.7
– Strength Index Reading (3 Year Range):BearishBullishBullish
NET POSITION MOVEMENT INDEX:
– 6-Week Change in Strength Index:-3.30.110.3


Copper Grade #1 Futures Futures:

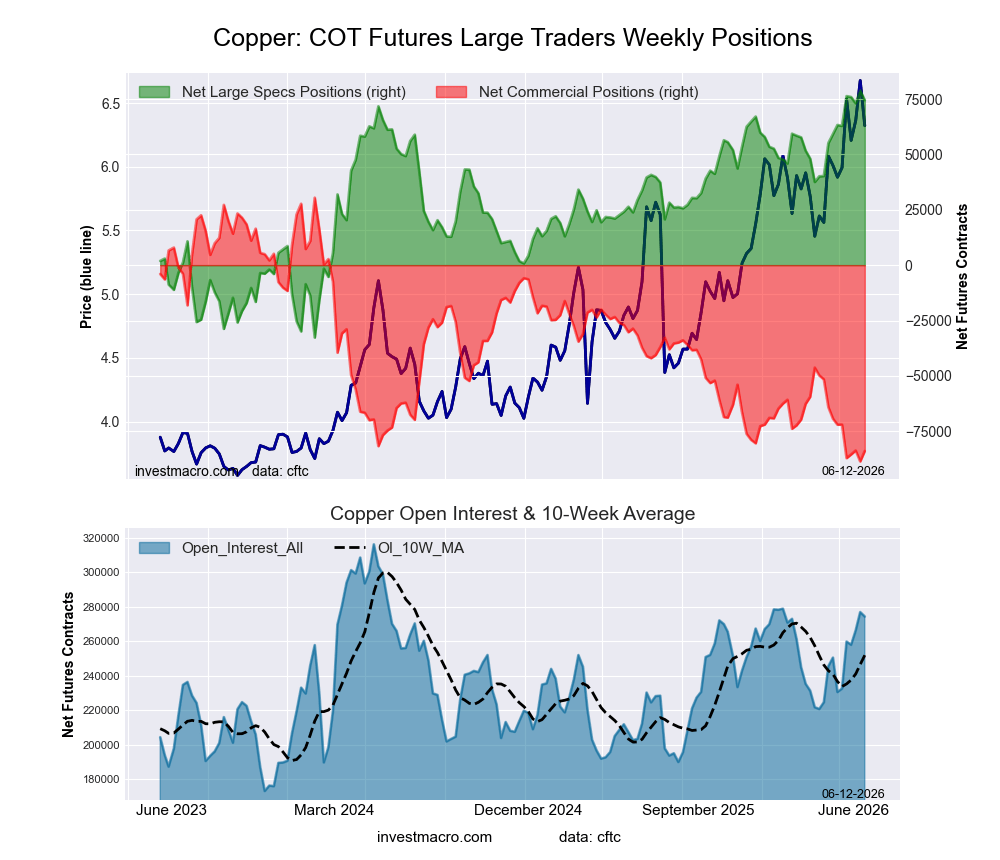
Copper Futures COT ChartPositioning Notes:

  • Copper Grade #1 Futures large speculator standing this week came in at a net position of 74,450 contracts in the data reported through Tuesday.
  • Weekly Speculator position fall of -4,383 contracts from the previous week which had a total of 78,833 net contracts.
  • This week’s current strength score (range over the past 3 years, measured from 0 to 100) shows the speculators are currently Bullish-Extreme with a score of 96.1 percent.
  • The Commercials are Bearish-Extreme with a score of 4.0 percent.
  • The Small Traders (not shown in chart) are Bullish with a score of 63.3 percent.

Price Trend-Following Model: Strong Uptrend

Our weekly trend-following model classifies the current market price position as: Strong Uptrend.

Copper Futures StatisticsSPECULATORSCOMMERCIALSSMALL TRADERS
– Percent of Open Interest Longs:39.431.47.3
– Percent of Open Interest Shorts:12.262.03.9
– Net Position:74,450-83,9359,485
– Gross Longs:108,03586,21120,089
– Gross Shorts:33,585170,14610,604
– Long to Short Ratio:3.2 to 10.5 to 11.9 to 1
NET POSITION TREND:
– Strength Index Score (3 Year Range Pct):96.14.063.3
– Strength Index Reading (3 Year Range):Bullish-ExtremeBearish-ExtremeBullish
NET POSITION MOVEMENT INDEX:
– 6-Week Change in Strength Index:10.0-10.03.8


Platinum Futures Futures:

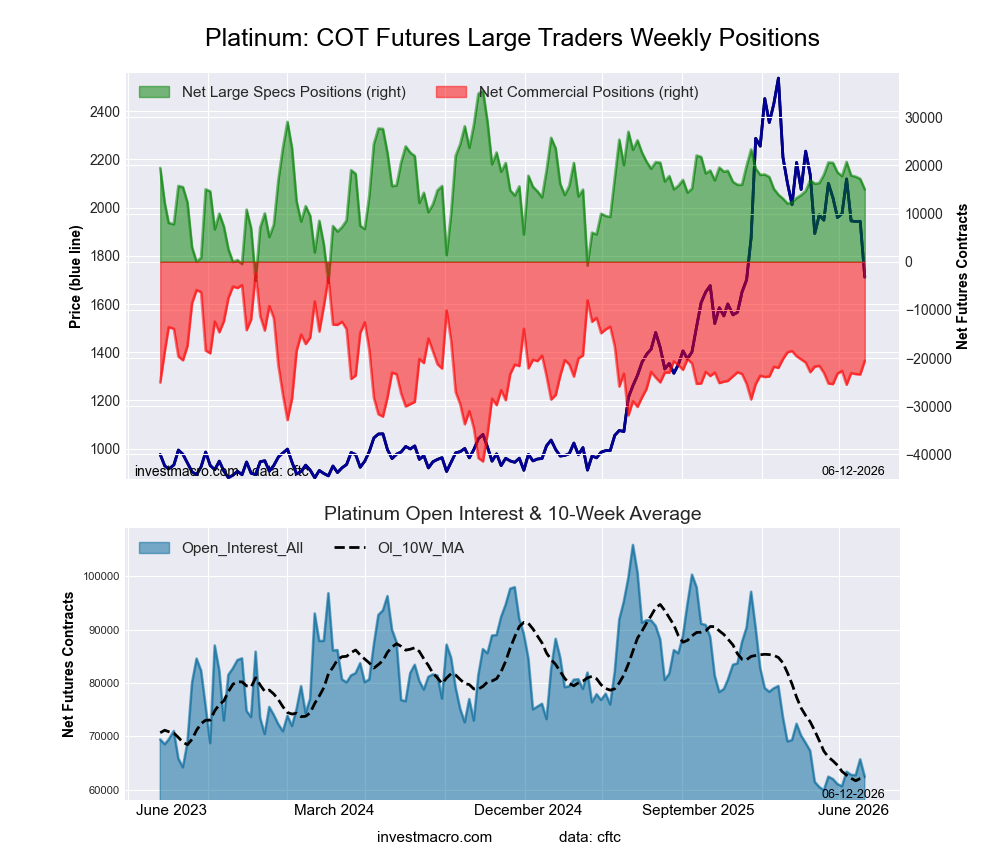
Platinum Futures COT ChartPositioning Notes:

  • Platinum Futures large speculator standing this week came in at a net position of 15,012 contracts in the data reported through Tuesday.
  • Weekly Speculator position decline of -2,200 contracts from the previous week which had a total of 17,212 net contracts.
  • This week’s current strength score (range over the past 3 years, measured from 0 to 100) shows the speculators are currently Bearish with a score of 48.6 percent.
  • The Commercials are Bullish with a score of 53.5 percent.
  • The Small Traders (not shown in chart) are Bullish with a score of 62.4 percent.

Price Trend-Following Model: Downtrend

Our weekly trend-following model classifies the current market price position as: Downtrend.

Platinum Futures StatisticsSPECULATORSCOMMERCIALSSMALL TRADERS
– Percent of Open Interest Longs:39.732.714.5
– Percent of Open Interest Shorts:15.765.75.7
– Net Position:15,012-20,5525,540
– Gross Longs:24,82620,4529,080
– Gross Shorts:9,81441,0043,540
– Long to Short Ratio:2.5 to 10.5 to 12.6 to 1
NET POSITION TREND:
– Strength Index Score (3 Year Range Pct):48.653.562.4
– Strength Index Reading (3 Year Range):BearishBullishBullish
NET POSITION MOVEMENT INDEX:
– 6-Week Change in Strength Index:-8.96.810.2


Palladium Futures Futures:

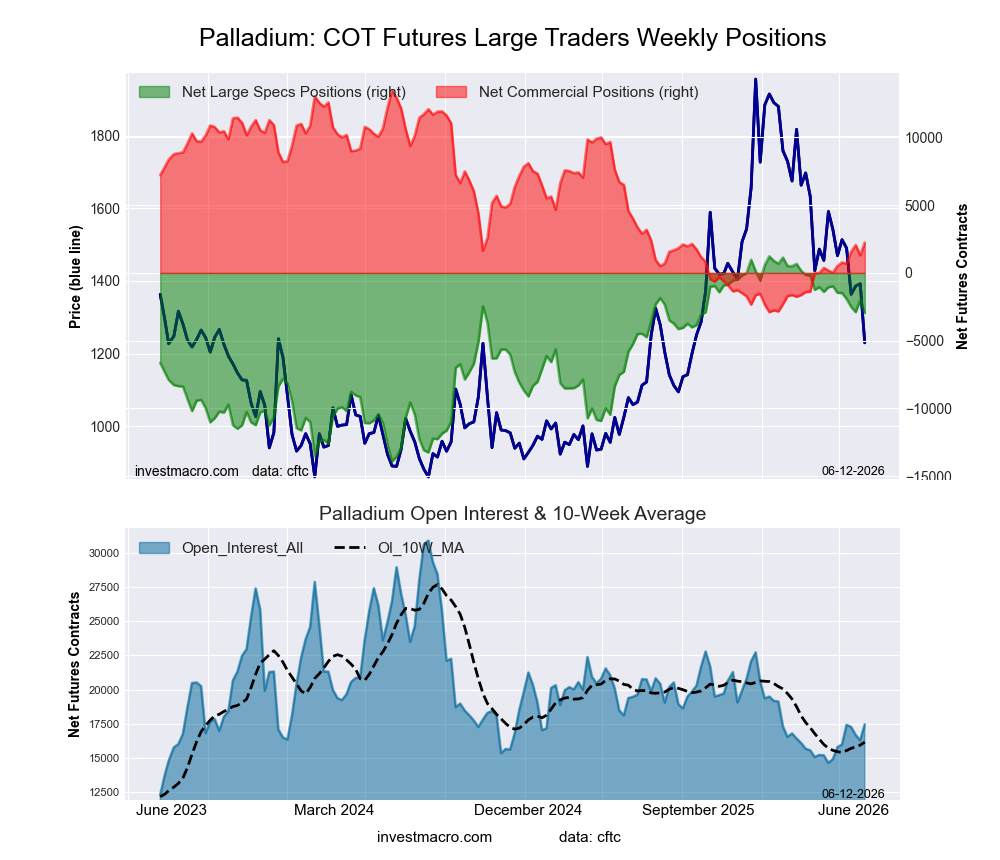
Palladium Futures COT ChartPositioning Notes:

  • Palladium Futures large speculator standing this week came in at a net position of -2,964 contracts in the data reported through Tuesday.
  • Weekly Speculator position lowering of -958 contracts from the previous week which had a total of -2,006 net contracts.
  • This week’s current strength score (range over the past 3 years, measured from 0 to 100) shows the speculators are currently Bullish with a score of 72.3 percent.
  • The Commercials are Bearish with a score of 31.3 percent.
  • The Small Traders (not shown in chart) are Bearish with a score of 45.1 percent.

Price Trend-Following Model: Downtrend

Our weekly trend-following model classifies the current market price position as: Downtrend.

Palladium Futures StatisticsSPECULATORSCOMMERCIALSSMALL TRADERS
– Percent of Open Interest Longs:43.139.614.0
– Percent of Open Interest Shorts:60.026.89.9
– Net Position:-2,9642,236728
– Gross Longs:7,5166,9092,449
– Gross Shorts:10,4804,6731,721
– Long to Short Ratio:0.7 to 11.5 to 11.4 to 1
NET POSITION TREND:
– Strength Index Score (3 Year Range Pct):72.331.345.1
– Strength Index Reading (3 Year Range):BullishBearishBearish
NET POSITION MOVEMENT INDEX:
– 6-Week Change in Strength Index:-9.910.5-7.5


Steel Futures Futures:

Steel Futures COT ChartPositioning Notes:

  • Steel Futures large speculator standing this week came in at a net position of 11,707 contracts in the data reported through Tuesday.
  • Weekly Speculator position rise of 1,107 contracts from the previous week which had a total of 10,600 net contracts.
  • This week’s current strength score (range over the past 3 years, measured from 0 to 100) shows the speculators are currently Bullish-Extreme with a score of 87.1 percent.
  • The Commercials are Bearish-Extreme with a score of 12.9 percent.
  • The Small Traders (not shown in chart) are Bullish with a score of 73.4 percent.

Price Trend-Following Model: Strong Uptrend

Our weekly trend-following model classifies the current market price position as: Strong Uptrend.

Steel Futures StatisticsSPECULATORSCOMMERCIALSSMALL TRADERS
– Percent of Open Interest Longs:32.662.91.2
– Percent of Open Interest Shorts:4.592.10.2
– Net Position:11,707-12,126419
– Gross Longs:13,55726,118511
– Gross Shorts:1,85038,24492
– Long to Short Ratio:7.3 to 10.7 to 15.6 to 1
NET POSITION TREND:
– Strength Index Score (3 Year Range Pct):87.112.973.4
– Strength Index Reading (3 Year Range):Bullish-ExtremeBearish-ExtremeBullish
NET POSITION MOVEMENT INDEX:
– 6-Week Change in Strength Index:-1.71.29.8


Article By InvestMacroReceive our weekly COT Reports by Email

*COT Report: The COT data, released weekly to the public each Friday, is updated through the most recent Tuesday (data is 3 days old) and shows a quick view of how large speculators or non-commercials (for-profit traders) were positioned in the futures markets.

The CFTC categorizes trader positions according to commercial hedgers (traders who use futures contracts for hedging as part of the business), non-commercials (large traders who speculate to realize trading profits) and nonreportable traders (usually small traders/speculators) as well as their open interest (contracts open in the market at time of reporting).See CFTC criteria here.

All information and opinions on this website and contained in this article are for general informational purposes only and do not constitute investment advice.