
By RoboForex Analysis Department
The EURUSD pair is starting Monday’s trading session near 1.1468.
This week, global financial markets will closely monitor two pivotal drivers: the prospects of a US-Iran nuclear deal and the upcoming Federal Reserve meeting. Any signs of progress in the negotiations could strip the geopolitical premium out of oil prices, subsequently weakening safe-haven demand for the US Dollar.
Concurrently, the market is bracing for the first Fed meeting chaired by Kevin Warsh, which is expected to set the tone for interest rate expectations heading into the second half of the year.
This meeting is critical for EURUSD. Just last week, robust US inflation and labor market data bolstered the Greenback, reinforcing expectations that the Fed will maintain its hawkish stance. Meanwhile, investors will continue to digest the impact of the ECB’s recent rate hike, looking for further guidance from European policymakers.
Additional direction will come from US macroeconomic releases, including retail sales and industrial production, which will provide further clarity on the health of the US economy and the trajectory of its monetary policy.
Free Reports:
 Download Our Metatrader 4 Indicators – Put Our Free MetaTrader 4 Custom Indicators on your charts when you join our Weekly Newsletter
 Get our Weekly Commitment of Traders Reports - See where the biggest traders (Hedge Funds and Commercial Hedgers) are positioned in the futures markets on a weekly basis.
EURUSD Technical Analysis
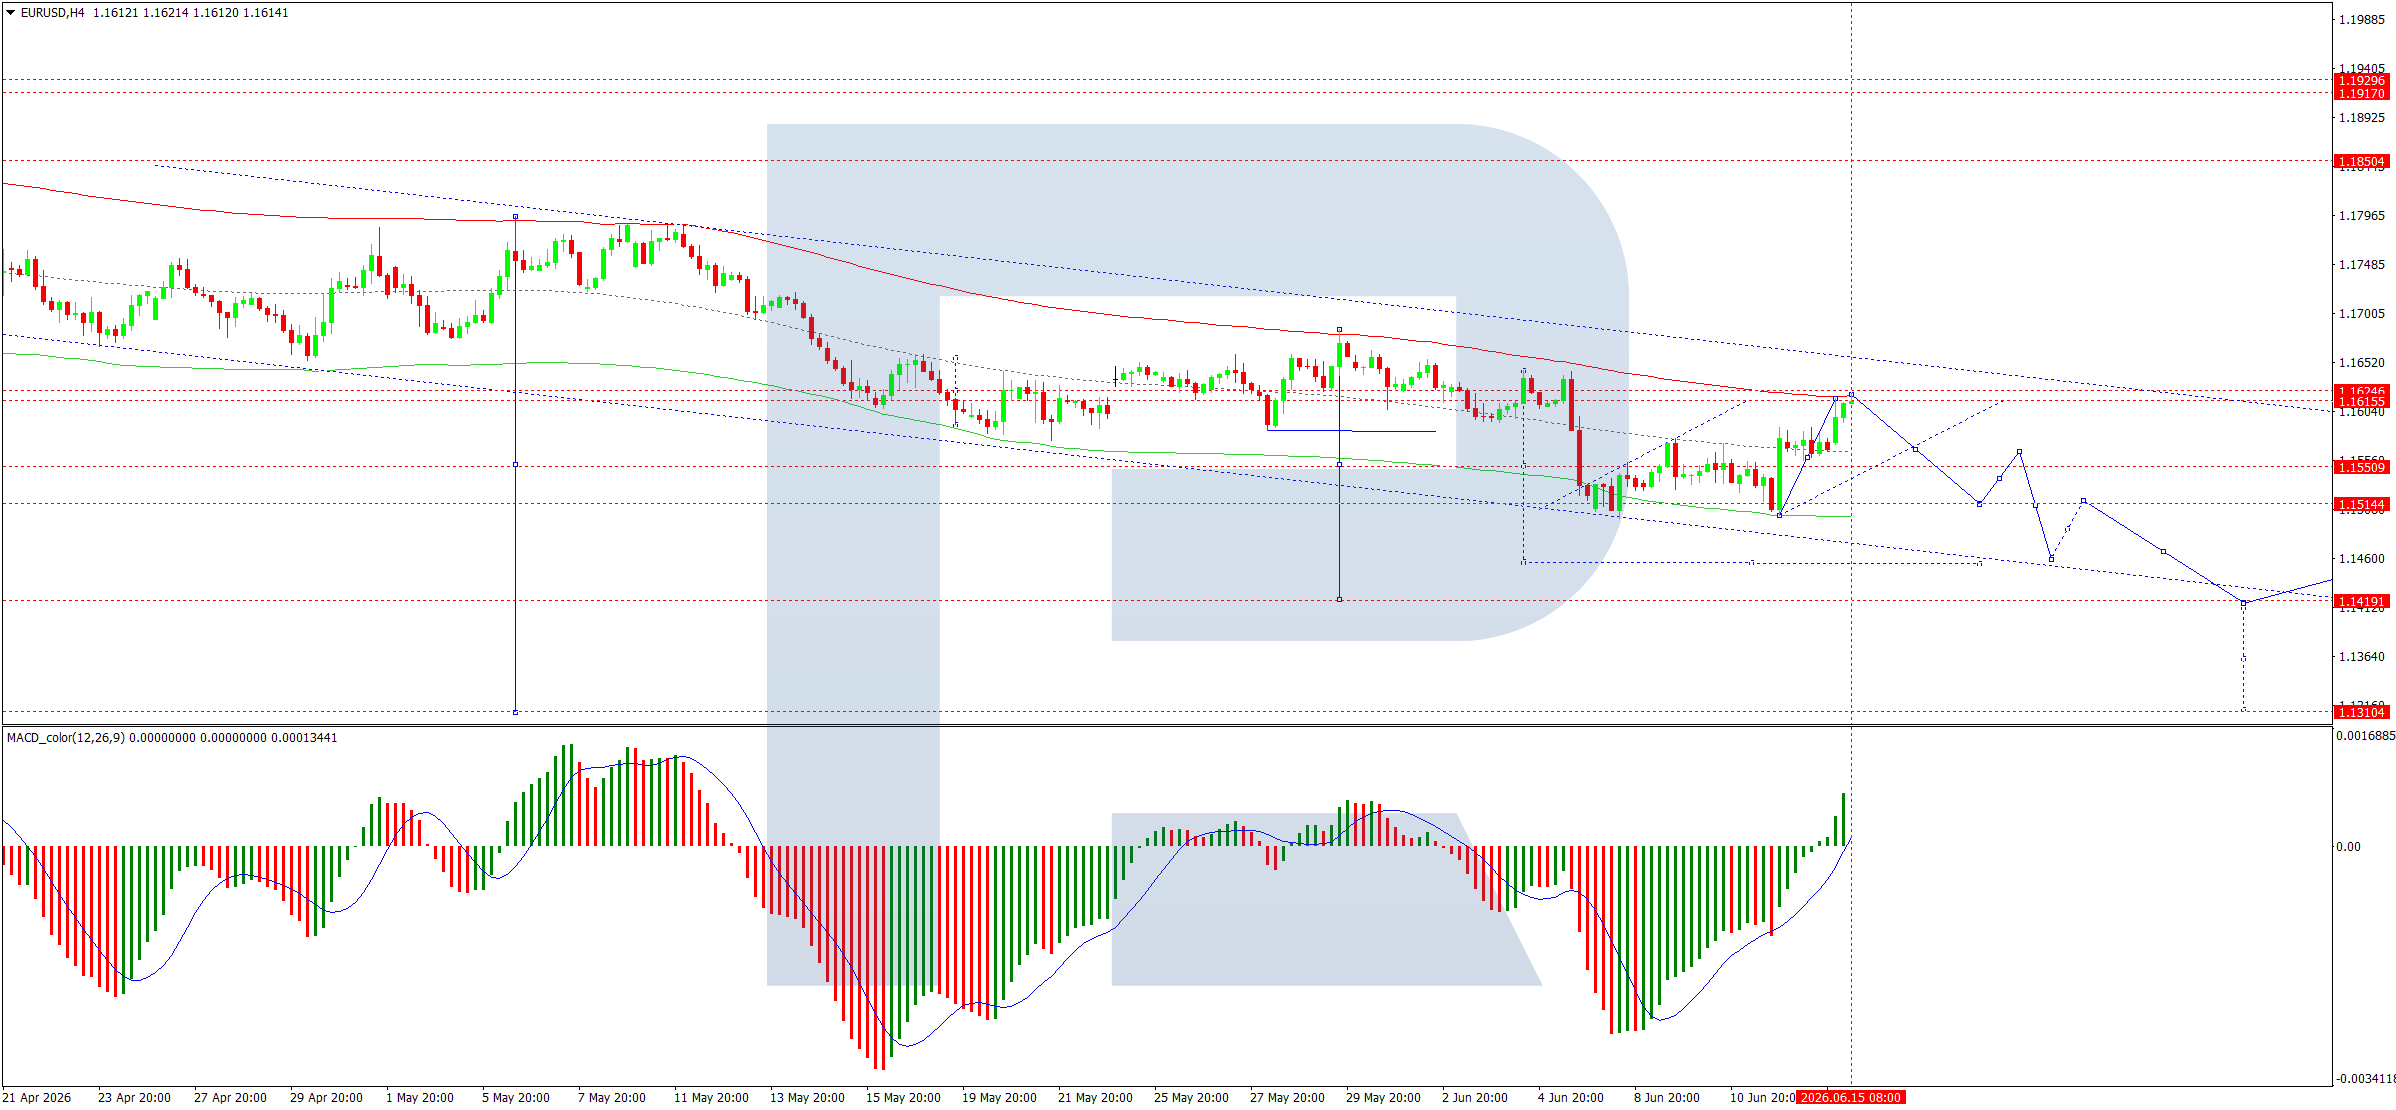
On the 4-hour chart, the EURUSD pair has formed a consolidation range around 1.1575, briefly testing the downside toward 1.1550.
Upside Scenario: A breakout above this range could trigger a corrective wave toward 1.1612, followed by a subsequent decline back to 1.1500.
Downside Scenario: A clean break below the consolidation range will open the door for a downward wave targeting 1.1444.
Technical Confirmation: The MACD indicator supports the bearish outlook. Its signal line remains above the zero mark but is pointing sharply downward, reflecting persistent bearish momentum and potential for trend continuation.
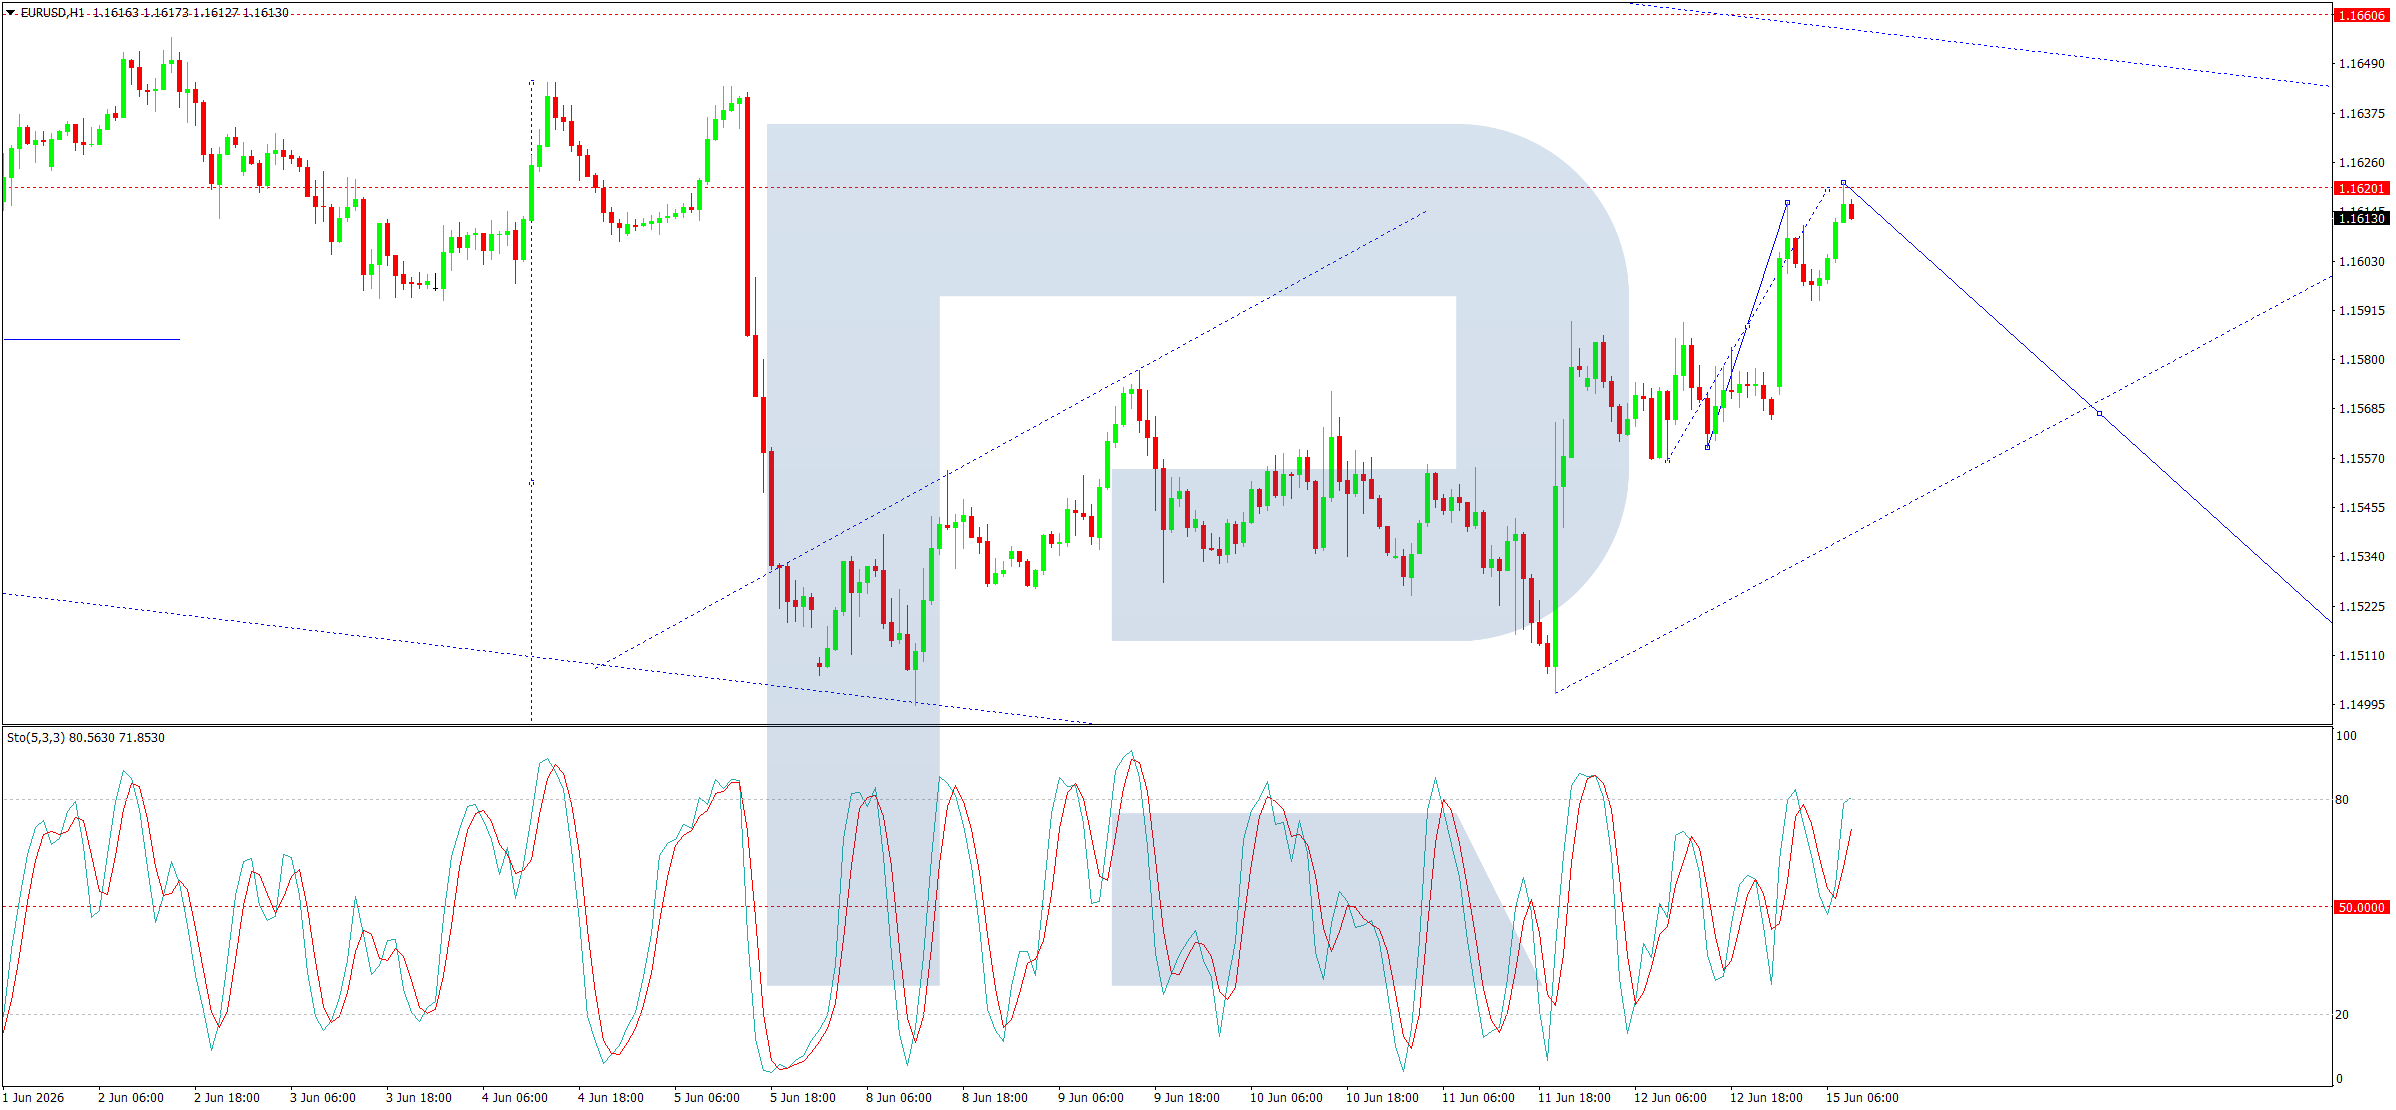
On the 1-hour chart, the market has completed an upward wave toward 1.1612 and is currently consolidating just below this level.
The immediate outlook suggests an expansion of this consolidation range—downward to 1.1500 and upward to 1.1550—before a broader decline resumes toward 1.1444.
Technical Confirmation: This scenario is backed by the Stochastic oscillator, where the signal line has crossed below the 80 level and is heading straight down toward 20, signaling oversold conditions ahead.
Disclaimer
Any forecasts contained herein are based on the author’s particular opinion. This analysis may not be treated as trading advice. RoboForex bears no responsibility for trading results based on trading recommendations and reviews contained herein.

- The US Tech sector hit by sell‑off. Oil prices decline on renewed negotiations Jul 28, 2026
- Gold Declines, Focus on Fed and Falling Oil Prices Jul 28, 2026
- This week will be one of the most crowded for central‑bank meetings Jul 27, 2026
- EUR/USD Ahead of a Key Week: Holding Near Lows Jul 27, 2026
- COT Metals Charts: Weekly Speculator Changes led by Copper Jul 26, 2026
- COT Bonds Charts: Speculator Bets led by SOFR 3-Months & 5-Year Bonds Jul 26, 2026
- COT Energy Charts: Weekly Speculator Bets led by WTI Crude & Natural Gas Jul 26, 2026
- COT Soft Commodities Charts: Weekly Speculator Bets led by Corn & Soybeans Jul 26, 2026
- The US introduces new import tariffs for 60 countries. Brent crude surpasses $100 per barrel Jul 24, 2026
- USD/JPY Breaks Records: Nothing Slows the Yen’s Decline Jul 24, 2026