The Reserve Bank of India kept interest rates unchanged. In Vietnam, inflationary pressures continue to ease

By JustMarkets 

As of Tuesday’s close, the Dow Jones Index (US30) declined by 0.14%. The S&P 500 Index (US500) fell by 0.49%, and the tech-heavy Nasdaq (US100) ended lower by 0.65%. The US stocks closed lower on Tuesday as investors grappled with disappointing economic data, escalating trade tensions, and mixed corporate earnings. Stagflation concerns resurfaced after the ISM Services Index showed activity stalled in July. Meanwhile, President Trump’s threats to impose steep tariffs of up to 250% on pharmaceutical imports, along with potential tariffs on semiconductors, heightened market anxiety amid ongoing trade uncertainty with India, Switzerland, and China. On the earnings front, Palantir rose by 7.8% after raising its revenue expectations, while Pfizer gained 5.2% following a strong quarterly report.

In June 2025, Canada’s trade deficit widened to CAD 5.9 billion (seasonally adjusted), up from the revised figure of CAD 5.5 billion in the previous month. Imports increased by 1.4% from a six-month low to CAD 67.6 billion, marking the first increase in four months. Exports to the US, subject to sectoral and country-specific tariffs, rose 3.1% from the previous month but remained 12.5% lower year-over-year.

European stock markets mostly rose yesterday. Germany’s DAX (DE40) gained 0.37%, France’s CAC 40 (FR40) closed down 0.14%, Spain’s IBEX35 (ES35) rose by 0.15%, and the UK’s FTSE 100 (UK100) closed up 0.16%. The DAX in Frankfurt gave up early gains and closed 0.4% higher on Tuesday as investors continued to monitor earnings season and trade developments, with US tariffs set to take effect on August 7. Under the US-EU deal, most EU exporters will face a unified 15% US tariff — half the 30% Trump had previously threatened. In return, the EU pledged to lower its own tariffs on certain goods and boost energy imports from the US by $750 billion over the remaining three and a half years of Trump’s presidency. However, Trump warned he could impose 35% tariffs on the EU if Brussels fails to meet its $600 billion investment commitment in US infrastructure.

WTI crude oil prices rose above $65 per barrel on Wednesday, snapping a four-day losing streak and rebounding from a five-week low amid supply disruption concerns. Investors assessed potential supply interruptions, as India may reduce imports of Russian oil in response to President Trump’s tariff threats over continued purchases. Trump warned of raising tariffs on Indian goods within 24 hours to pressure Russian President Vladimir Putin to end the war in Ukraine. Additional support for bulls came from API data showing a 4.2 million barrel drop in US crude inventories last week, exceeding market expectations of a 1.8 million barrel decline and signaling stronger-than-expected demand.

Silver held near $37.8 per ounce on Wednesday after rising for three straight sessions, supported by growing expectations of Federal Reserve rate cuts. The latest ISM Services PMI for July pointed to sluggish growth, a decline in employment, and persistent price pressures, reinforcing signs of labor market cooling after last week’s weaker-than-expected payroll report. Markets are now pricing in two Fed rate cuts by year-end, with the first potentially in September.

Asian markets mostly rose yesterday. Japan’s Nikkei 225 (JP225) gained 0.64%, China’s FTSE China A50 (CHA50) increased by 0.94%, Hong Kong’s Hang Seng (HK50) rose by 0.68%, and Australia’s ASX 200 (AU200) posted a strong performance, up 1.23%.

The Reserve Bank of India (RBI), at its August meeting, held the key repo rate steady at 5.50%, maintaining a neutral stance after cutting the rate by 50 basis points in June, more than usual and in line with expectations. The rate remains at its lowest level since August 2022. The decision came amid easing inflation and the recent US announcement of 25% tariffs on Indian imports. On the economic outlook, the RBI maintained its GDP growth expectations at 6.5% for the 2025/26 fiscal year and 6.6% for the following year. Meanwhile, inflation expectations were revised downward to 3.1% from 3.7%, remaining within the RBI’s target range of 2-6%.

Vietnam’s annual inflation rate fell to 3.19% in July 2025 from 3.57% in June, marking the lowest level in three months. Meanwhile, core inflation, excluding volatile items, slowed to 3.30% in July from 3.46% in June, also a three-month low. On a monthly basis, consumer prices rose by 0.11%, down from a 0.48% increase in the previous period.

In June 2025, the unemployment rate in New Zealand rose to 5.2%, which is slightly higher than the previous figure of 5.1% and in line with market expectations. The number of unemployed increased to 158,000 people compared to 156,000 in March, representing an annual increase of 16,000 people, or 11.1%. This data indicates growing slack in the labor market, putting pressure on policymakers as economic dynamics continue to weaken.

S&P 500 (US500) 6,299.19 −30.75 (−0.49%)

Dow Jones (US30) 44,111.74 −61.90 (−0.14%)

DAX (DE40) 23,846.07 +88.38 (+0.37%)

FTSE 100 (UK100) 9,142.73 +14.43 (+0.16%)

USD Index 98.76 −0.03 (−0.03%)

News feed for: 2025.08.06

  • New Zealand Unemployment Rate (q/q) at 01:45 (GMT+3);
  • Japan Average Cash Earnings (y/y) at 02:30 (GMT+3);
  • Eurozone Retail Sales (m/m) at 12:00 (GMT+3);
  • US Crude Oil Reserves (w/w) at 17:30 (GMT+3).

By JustMarkets


This article reflects a personal opinion and should not be interpreted as an investment advice, and/or offer, and/or a persistent request for carrying out financial transactions, and/or a guarantee, and/or a forecast of future events.

Gold Holds Near Two-Week High

By RoboForex Analytical Department

On Wednesday, the price of gold dipped to 3,375 USD per troy ounce but remained close to a two-week high, retaining most of its recent gains.

The market remains buoyed by demand for defensive assets amid expectations of a more dovish Federal Reserve policy.

The previous day saw the release of US ISM data, which showed the services sector business activity index for July falling to 50.1 points – below forecasts. The figures indicated sluggish growth, slowing employment, and mounting price pressures. Earlier data also pointed to a weakening labour market and declining consumer spending.

These developments have bolstered expectations that the Fed may cut interest rates as early as September, with markets now pricing in a 90% probability of such a move.

Further support for gold comes from new trade tariffs announced by US President Donald Trump, alongside investor concerns over the Federal Reserve’s independence following the resignation of Board of Governors member Lisa Kugler. Her departure paves the way for Trump to appoint a more accommodative successor.

Technical Analysis: XAU/USD

H4 Chart:

The XAU/USD pair is forming a broad consolidation range around 3,346 USD on the H4 chart. The market has corrected to 3,390 USD. Today, we assess the likelihood of a new downward wave developing towards 3,333 USD. A break below this level could extend the decline to a minimum of 3,255 USD. This scenario is technically supported by the MACD indicator, where the signal line remains above zero near recent highs but shows signs of an impending downturn.

H1 Chart:

On the H1 chart, the market has completed a corrective structure to 3,390 USD. A consolidation range is now forming below this level, with a downward breakout likely to extend the decline towards 3,320 USD. A breach of this support could signal further downside momentum, potentially targeting 3,200 USD. The Stochastic oscillator corroborates this outlook, with its signal line below 50 and trending sharply downward towards 20.

Conclusion

Gold remains resilient near recent highs, supported by macroeconomic uncertainties and shifting Federal Reserve expectations. However, technical indicators suggest potential near-term downside, with key support levels at 3,333 USD (H4) and 3,320 USD (H1) in focus.


Disclaimer

Any forecasts contained herein are based on the author’s particular opinion. This analysis may not be treated as trading advice. RoboForex bears no responsibility for trading results based on trading recommendations and reviews contained herein.

Bitcoin waits for fresh directional spark

By ForexTime

  • Bitcoin ↓ 1.6% month-to-date
  • Fresh catalyst needed to break out of range 
  • Trump’s tariff & US data could spark volatility
  • Technical levels: $120k, $115k, $112k


Bitcoin remains in standby mode with prices lingering around $115k in the absence of a fresh directional catalyst.

Despite the action witnessed last Friday, the “OG” crypto remains trapped within a range with support identified at the 50-day SMA. 

This period of calm could come to an end amid Trump’s tariff drama and market bets around the Fed cutting interest rates. 

As of now, the massive ETF outflow of $812 million last Friday suggests that bears could strike. This was the biggest single-day outflow seen since late February 2025, when Bitcoin ended the month 17% lower. 

Considering how Trump’s updated tariffs come into effect on Thursday, 7th August, risk assets, including Bitcoin could be exposed to downside risks.

Beyond the tariff drama, Bitcoin could also be influenced by US economic data and Fed cut expectations. Should US data support the argument around lower interest rates, this may support Bitcoin. The same can be said vice versa.


Potential scenarios:

Bullish Scenario: A clean breakout above $115k could push prices toward $120k and $123k. 

Bearish Scenario: Weakness below $115k may trigger a decline back toward $112k and $110k.


Imagen
Bitcoin

Forex-Time-LogoArticle by ForexTime

ForexTime Ltd (FXTM) is an award winning international online forex broker regulated by CySEC 185/12 www.forextime.com

EUR/USD Pressured by External Factors

By RoboForex Analytical Department

The EUR/USD pair edged lower on Tuesday, dipping to 1.1556 amid subdued trading activity. Market participants are cautiously assessing the latest trade signals and recalibrating their expectations for monetary policy.

Trade tensions resurfaced as US President Donald Trump threatened India with steep tariff hikes over its continued purchases of Russian oil. Meanwhile, the European Union postponed retaliatory tariffs against the US by six months, with both sides pledging further negotiations.

The US dollar faced downward pressure last week following the release of a disappointing US employment report. July’s figures fell short of forecasts, reinforcing market bets on a Fed rate cut in September. Investors are now pricing in over 60 basis points’ worth of easing by year-end.

Political uncertainty also weighed on sentiment. The resignation of a Federal Reserve Board member and the dismissal of a key statistical agency head under Trump’s administration have fuelled concerns over stability in the US economic leadership.

Market focus now shifts to June’s foreign trade data and the latest ISM PMI report, which could offer fresh insights into the health of the US economy.

Technical Analysis: EUR/USD

H4 Chart:

The EUR/USD corrected to 1.1590 before entering consolidation below this level. A breakout towards 1.1615 remains possible, but the primary expectation is a resumption of the downtrend, targeting 1.1348 as the next key support. This bearish view is supported by the MACD indicator, with its signal line firmly below zero and pointing downward.

H1 Chart:

The pair has formed a consolidation range around 1.1555, with the minimum correction target already met. A downside breakout is anticipated, initiating the fifth wave of decline towards 1.1348. The Stochastic oscillator reinforces this outlook, with its signal line below 50 and trending sharply downward towards 20.

Conclusion

The EUR/USD remains vulnerable to further losses, driven by a combination of weakening technical structure and external macroeconomic pressures. Traders should monitor US economic data for signals on near-term direction, as the broader downtrend remains intact.


Disclaimer

Any forecasts contained herein are based on the author’s particular opinion. This analysis may not be treated as trading advice. RoboForex bears no responsibility for trading results based on trading recommendations and reviews contained herein.

Stock indexes returned to growth amid renewed hopes for a September Fed rate cut

By JustMarkets 

The Dow Jones Index (US30) rose by 1.34% by the end of Monday. The S&P 500 Index (US500) gained 1.47%, and the tech-heavy Nasdaq (US100) closed 1.95% higher. The indexes’ growth was fueled by renewed hopes for a September Fed rate cut following a weak July employment report and a downward revision of data from previous months. In response, President Trump fired the head of the Bureau of Labor Statistics and stated he would name a replacement this week. Meanwhile, updated tariffs ranging from 10% to 41% added additional pressure, although Switzerland and the EU signaled an openness to negotiations. Mega-cap tech stocks led the gains as traders focused on strong earnings, with 82% of S&P 500 companies reporting better-than-expected results so far. Palantir jumped 4.2% ahead of its post-market earnings release, Nvidia was up 3.5%, and Amazon gained 1.5%.

European stock markets were mostly higher yesterday. The German DAX (DE40) increased by 1.42%, the French CAC 40 (FR40) closed up 1.14%, the Spanish IBEX35 (ES35) gained 1.84%, and the British FTSE 100 (UK100) closed 0.66% higher on Monday. The FTSE 100’s Monday gains were driven by a sharp rise in British bank stocks after a favorable Supreme Court ruling on a motor finance case. Shares of Lloyds Banking Group surged over 8% to their highest level since 2015, while Barclays climbed 1.5%. HSBC and Standard Chartered also saw gains. The ruling overturned a lower court decision, easing fears of massive compensation payouts related to mis-selling car loans. The Financial Conduct Authority is now estimating a potential redress amount of £9 billion, significantly lower than earlier market fears of up to £30 billion. The ratings agency RBC upgraded Lloyds, the largest player in the UK car finance market, calling the court decision an “event that removes significant pressure on the stock.” BP shares also rose nearly 2% ahead of its earnings report as investors anticipate new insights into the company’s return to traditional energy sources.

The Swiss franc weakened to 0.81 against the US dollar as concerns about newly announced US tariffs overshadowed modest Swiss inflation growth. On August 1st, the Trump administration announced 39% tariffs on Swiss exports, higher than the 31% tariffs announced in April, with the measures taking effect on August 7th. If the tariffs remain in place, they are expected to intensify disinflationary pressure in Switzerland. Meanwhile, inflation in July grew slightly to 0.2% year-over-year, which was higher than the 0.1% expectation but still near zero. The subdued price growth, combined with rising external risks, suggests that the Swiss National Bank may resort to further negative interest rate cuts. The Swiss Manufacturing PMI fell to 48.8 in July from 49.6 in June, signaling a deeper downturn in the sector.

WTI crude oil prices fell to $66.3 per barrel on Monday as traders digested the OPEC+ decision to increase production and growing geopolitical uncertainty. The group confirmed a widely anticipated production increase of 547,000 barrels per day starting in September, completing the phased unwinding of voluntary cuts enacted in 2023. While the move was expected, it heightened expectations that global oil supply could outpace demand this year, potentially leading to a buildup in inventories. Traders are also monitoring potential US actions on Russian oil flows. President Trump has threatened to impose additional sanctions on countries buying Russian oil, specifically targeting India, with possible measures taking effect as early as August 8th.

The US natural gas prices fell below the $3/ 3/MMBtu mark, nearing a low not seen since November 2024, as production outpaces demand. According to LSEG, average output in the Lower 48 states reached 107.5 billion cubic feet per day in July, surpassing June’s record of 106.4 billion cubic feet per day. As a result, the latest EIA data showed a larger-than-expected injection into storage of 48 billion cubic feet for the week ending July 25th, exceeding forecasts of 38 billion cubic feet.

Asian markets were mostly higher yesterday. The Japanese Nikkei 225 (JP225) fell by 1.25%, the Chinese FTSE China A50 (CHA50) rose by 0.52%, the Hong Kong Hang Seng (HK50) gained 0.92%, and the Australian ASX 200 (AU200) had a positive result of 0.02% yesterday.

Hong Kong stocks dropped to 24,711 on Tuesday morning, reversing the previous session’s gains. Investors cautiously awaited China’s July trade data and upcoming inflation figures amid concerns over rising trade barriers and weak domestic demand. Consumer stocks fell while real estate, financial, and tech stocks saw modest gains. Further losses were contained by an overnight rally on Wall Street amid some bargain hunting after Friday’s decline and increased bets on a September rate cut. Meanwhile, according to a private survey, China’s services activity grew at its fastest pace in 14 months in July.

S&P 500 (US500) 6,329.94 +91.93 (+1.47%)

Dow Jones (US30) 44,173.64 +585.06 (+1.34%)

DAX (DE40) 23,757.69 +331.72 (+1.42%)

FTSE 100 (UK100) 9,128.30 +59.72 (+0.66%)

USD index 98.79 −0.36 (−0.36%)

News feed for: 2025.08.05

  • Australia Services PMI (m/m) at 02:00 (GMT+3);
  • Japan Monetary Policy Meeting Minutes at 02:50 (GMT+3);
  • Japan Services PMI (m/m) at 03:30 (GMT+3);
  • China Caixin Services PMI (m/m) at 04:45 (GMT+3);
  • German Services PMI (m/m) at 10:55 (GMT+3);
  • Eurozone Services PMI (m/m) at 11:00 (GMT+3);
  • UK Services PMI (m/m) at 11:30 (GMT+3);
  • Eurozone Producer Price Index (m/m) at 12:00 (GMT+3);
  • US Trade Balance (m/m) at 15:30 (GMT+3);
  • Canada Trade Balance (m/m) at 15:30 (GMT+3);
  • US ISM Services PMI (m/m) at 17:00 (GMT+3).

By JustMarkets


This article reflects a personal opinion and should not be interpreted as an investment advice, and/or offer, and/or a persistent request for carrying out financial transactions, and/or a guarantee, and/or a forecast of future events.

Weak US labor market data increased the likelihood of a Fed rate cut. Oil prices fall amid rumors that OPEC plans to raise production

By JustMarkets

On Friday, the Dow Jones Index (US30) declined by 1.23% (-3.02% for the week). The S&P 500 Index (US500) dropped by 1.60% (-2.50% for the week), and the Nasdaq Tech Index (US100) closed down by 1.96% (-2.48% for the week). The US stocks fell on Friday as investors reacted to weak July employment data and a new round of tariffs announced by President Trump. Non-farm payrolls increased by just 73,000 in July, well below expectations, and sharp downward revisions to previous months’ data pointed to deeper labor market weakness. Treasury yields fell, and the probability of a Fed rate cut in September rose above 80%. Sentiment also soured after the US imposed new tariffs ranging from 10% to 41% on imports from key partners, including Canada, India, and Taiwan. On the corporate front, Amazon dropped nearly 8% due to disappointing cloud forecasts, dragging the broader market, while Apple fell 2.9% despite strong results. Exxon (-1.8%) and Chevron (-0.1%) beat expectations, Eli Lilly rose by 3% on hopes of drug coverage, while Moderna plunged 6.6% amid renewed vaccine concerns.

The Mexican peso fell to a one-month low, breaking through 18.80 per USD, despite broad dollar weakness, primarily reflecting domestic factors and tariff concerns weighing on the currency. The S&P Global Manufacturing PMI for July remained at 49.1 for the thirteenth consecutive month, while the business confidence index stayed below the 49.4 threshold, indicating falling export demand and reduced capital expenditures.

The Canadian dollar strengthened to 1.38 per USD, rebounding from a two-month low as the dollar weakened following the weak US non-farm payroll report showing just 73,000 new jobs vs. 110,000 expected, and a net downward revision of 258,000 positions. This boosted bets on a Fed rate cut in September. At the same time, Canada’s economy showed surprising resilience: after a 0.1% GDP contraction in May, a 0.1% increase is expected in June, with manufacturing output rising by 0.7%. This supports the Bank of Canada’s decision to hold rates steady at 2.75%, standing in sharp contrast to the Fed’s more dovish stance. Although President Trump’s surprise announcement of 35% tariffs briefly shook markets, Canadian exemptions under USMCA effectively cap export taxes at around 5%, softening any major impact on cross-border trade flows.

European stock markets mostly declined on Friday. Germany’s DAX (DE40) fell 2.66% (weekly: -4.09%), France’s CAC 40 (FR40) closed down 2.91% (weekly: -4.77%), Spain’s IBEX35 (ES35) dropped 1.88% (weekly: -1.68%), and the UK’s FTSE 100 (UK100) closed Friday 0.70% (weekly: -0.57%). European equities closed sharply lower on Friday, following a steep global market sell-off as the US government expanded the range of imports subject to tariffs. While the base tariff remained at 10%, rates were sharply increased for India (25%), Canada (35%), and Switzerland (39%). Overall, the average US tariff rate will rise to 15%, compared to roughly 2% in 2024. Additionally, banks and industrial giants fell sharply following the pessimistic US labor report: Siemens, Intesa Sanpaolo, ING, BNP Paribas, and Schneider dropped more than 4%.

WTI crude oil prices fell by 2.7% to $67.3 per barrel on Friday amid reports that OPEC and its allies may soon agree to raise output. Market sentiment also deteriorated following newly signed tariffs by President Trump on imports from dozens of countries, including Canada, India, and Taiwan, which will take effect on August 7.

Silver hovered around $37 per ounce on Monday after rising nearly 1% in the previous session, supported by rising expectations of a Fed rate cut following the weak July jobs report. A falling dollar and lower Treasury yields further boosted silver’s appeal.

Asian markets mostly declined last week. Japan’s Nikkei 225 (JP225) dropped by 1.73%, China’s FTSE China A50 (CHA50) fell by 2.19%, Hong Kong’s Hang Seng (HK50) declined by 3.74%, while Australia’s ASX 200 (AU200) posted a slight weekly loss of 0.06%.

On Monday, the offshore yuan held its recent gains at 7.19 per USD after the People’s Bank of China announced the formation of a new committee on macroprudential and financial stability. The central bank reaffirmed its accommodative stance, pledging to manage key financial risks and maintain ample liquidity in H2 with an “appropriately loose” monetary policy. Lending to strategic sectors such as technology and green development has surged, reflecting policy priorities. Meanwhile, investors are watching the key October policy plenum, where officials are expected to present countermeasures to persistent deflationary pressure, excess industrial capacity, and the ongoing real estate downturn. Recent signals from the Politburo point to more stimulus through bond issuance and demand-boosting measures.

S&P 500 (US500) 6,238.01 −101.38 (−1.60%)

Dow Jones (US30) 43,588.58 −542.40 (−1.23%)

DAX (DE40) 23,425.97 −639.50 (−2.66%)

FTSE 100 (UK100) 9,068.58 −64.23 (−0.70%)

USD index 98.69 −1.28 (−1.28%)

News feed for: 2025.08.04

  • Switzerland Consumer Price Index (m/m) at 09:30 (GMT+3);
  • Switzerland Manufacturing PMI (m/m) at 10:30 (GMT+3).

By JustMarkets


This article reflects a personal opinion and should not be interpreted as an investment advice, and/or offer, and/or a persistent request for carrying out financial transactions, and/or a guarantee, and/or a forecast of future events.

Yen Weakens Amid Fed Rate Expectations and Bank of Japan Signals

By RoboForex Analytical Department

The USD/JPY pair climbed to 147.67 on Monday as the Japanese yen underwent a correction following Friday’s volatile trading session, with investors closely monitoring macroeconomic developments.

Market focus remains on shifting US Federal Reserve policy expectations after the release of softer labour market data. Although Friday’s report bolstered predictions of a rate cut, Fed officials have maintained a cautious tone, citing persistent inflation risks. Proposed large-scale tariffs from US President Donald Trump have further amplified these concerns.

Against this backdrop, the US dollar has partially regained strength, exerting downward pressure on the yen.

Investors are now awaiting the release of the Bank of Japan (BoJ) meeting minutes, hoping for clues on the timing of a potential rate hike. Last week, the Japanese central bank left interest rates unchanged but raised its inflation forecast and highlighted growing uncertainty due to global trade risks.

Overall, the outlook for the JPY remains subdued. The BoJ has ample room to delay rate hikes, justifying its stance with ongoing caution.

Technical Analysis: USD/JPY

H4 Chart:

On the H4 chart, USD/JPY completed an upward wave to 150.90 before entering a correction phase. A further decline towards 146.52 is anticipated today. Once this level is reached, the pair may initiate a new growth wave, potentially targeting 151.00, with a longer-term prospect of extending the trend to 153.10. This scenario is supported by the MACD indicator, where the signal line remains above zero but is trending sharply downward.

H1 Chart:

On the H1 chart, USD/JPY is forming a corrective structure towards 146.52. A temporary rebound to 148.70 (testing from below) is expected today, followed by a possible resumption of the correction to 146.52. Once this correction concludes, a fresh upward wave towards 151.00 could materialise. The Stochastic oscillator validates this outlook, with its signal line positioned above 50 and pointing upwards.

Conclusion

The yen remains under pressure amid shifting Fed expectations and cautious BoJ signals. Technically, USD/JPY is poised for further correction before potentially resuming its uptrend.


Disclaimer

Any forecasts contained herein are based on the author’s particular opinion. This analysis may not be treated as trading advice. RoboForex bears no responsibility for trading results based on trading recommendations and reviews contained herein.

Week Ahead: GBPUSD under pressure with fresh losses ahead?

By ForexTime

(Note: This report was published before the US NFP report on Friday afternoon.)

  • GBPUSD ↓ 3.8% in July – worst month in 2025 
  • BoE expected to cut rates by 25bp on Thursday 
  • BoE meeting forecast to move GBPUSD ↑ 0.5% & ↓ 0.4%
  • US economic data could trigger additional volatility
  • Bloomberg FX model: GBPUSD has 74% of trading within 1.2990 – 1.3308 over 1-week period

Even as the clock ticks down to the key US jobs report this afternoon (Friday 1st August), investors are bracing for more action in the week ahead.

Trump has injected a fresh dose of uncertainty into markets after signing an executive order reimposing reciprocal tariffs of 10% to 41% on dozens of countries. 

Considering how these come into effect from August 7th, this could mean more volatility for a week already packed with key data and corporate earnings:

Sunday, 3rd August 

  • OIL: OPEC+ meeting on production levels

Monday, 4th August 

  • US500: US factory orders, durable goods

Tuesday, 5th August 

  • CN50: China S&P Global services PMI
  • EU50: Eurozone PPI, HCOB services PMI
  • JP225: Japan BOJ meeting minutes
  • US500: US trade, ISM services, S&P Global services PMI
  • UK00: BP earnings

Wednesday, 6th August 

  • EUR: Eurozone retail sales
  • GER40: Germany factory orders
  • TWN: Taiwan CPI
  • US30: Disney earnings

Thursday, 7th August 

  • AUD: Australia trade
  • CN50: China trade, foreign reserves
  • GER40: Germany industrial production
  • GBP: BoE rate decision
  • USDInd: US initial jobless claims, Atlanta Fed President Raphael Bostic speech
  • Trump’s updated tariffs come into effect  

Friday, 8th  August 

  • CAD: Canada unemployment
  • JP225: Japan household spending, trade, current account
  • TWN: Taiwan trade

Our focus lands on the GBPUSD which ended July almost 4% lower – its worst trading month in 2025.

A strengthening dollar has hammered the major currency pair, with prices approaching levels not seen since mid-May. 

Imagen
GBPUSD

(Note: This chart was published before the US NFP report on Friday afternoon.)

With bears in a position of power, further downside could be expected with the right fundamental catalyst.


Here are 3 factors to watch out for:


1) BoE rate decision

The Bank of England (BoE) is expected to cut interest rates again at its August meeting to 4% from 4.25%. 

However, the central bank may adopt a cautious stance on future rate cuts given how inflation surprised to the upside in June. Still, concerns over the labour market may encourage policymakers to lower rates deeper into the year.

Note: The latest UK CPI report increased to 3.6% in June, up from 3.4% in May. 

Traders are currently pricing in a 95% probability that the BoE cuts rates in August with the odds of another rate cut by November at 63%.

  • The GBPUSD may extend losses if the BoE cuts interest rates and signals lower rates in the second half of 2025.


  • Should BoE governor Bailey express caution over future cuts, this may support the GBPUSD.

GBPUSD is forecasted to move 0.5% up or down 0.4% in a 6-hour window after the BoE rate decision. 


2) US data

More economic data from the world’s largest economy may impact bets on a Fed cut and the US dollar. Recently, confidence toward the US economy was boosted by the stronger-than-expected Q2 GDP figures.  More encouraging data could lift sentiment, cool Fed cut bets, and support the USD.

On Tuesday, the latest US ISM services and PMI’s will be published, followed by the initial jobless claims on Thursday.

  • A strong set of figures may boost the dollar, dragging the GBPUSD lower as a result.


  • Weaker-than-expected data may hit the dollar, pushing the GBPUSD higher as a result.


3) Technical forces

GBPUSD is under intense pressure on the daily charts with prices trading below the 50 and 100-day SMA’s. However, the Relative Strength Index (RSI) shows that prices are heavily oversold. 

  • A solid weekly close under 1.3200 may encourage a decline toward 1.3070 and the 200-day SMA at 1.2990, which is also the lower bound of the Bloomberg FX model.


  • Should prices push back above 1.3200, this could trigger a move toward 1.3285 and 1.3308 – the upper bound of the Bloomberg FX model.
Imagen
GBPUSD QD2

Bloomberg’s FX model forecasts a 74% chance that GBPUSD will trade within the 1.2990 – 1.3308 range, using current levels as a base, over the next one-week period.


Forex-Time-LogoArticle by ForexTime

ForexTime Ltd (FXTM) is an award winning international online forex broker regulated by CySEC 185/12 www.forextime.com

Urban trees vs. cool roofs: What’s the best way for cities to beat the heat?

By Ian Smith, Boston University and Lucy Hutyra, Boston University 

When summer turns up the heat, cities can start to feel like an oven, as buildings and pavement trap the sun’s warmth and vehicles and air conditioners release more heat into the air.

The temperature in an urban neighborhood with few trees can be more than 10 degrees Fahrenheit (5.5 Celsius) higher than in nearby suburbs. That means air conditioning works harder, straining the electrical grid and leaving communities vulnerable to power outages.

There are some proven steps that cities can take to help cool the air – planting trees that provide shade and moisture, for example, or creating cool roofs that reflect solar energy away from the neighborhood rather than absorbing it.

But do these steps pay off everywhere?

We study heat risk in cities as urban ecologists and have been exploring the impact of tree-planting and reflective roofs in different cities and different neighborhoods across cities. What we’re learning can help cities and homeowners be more targeted in their efforts to beat the heat.

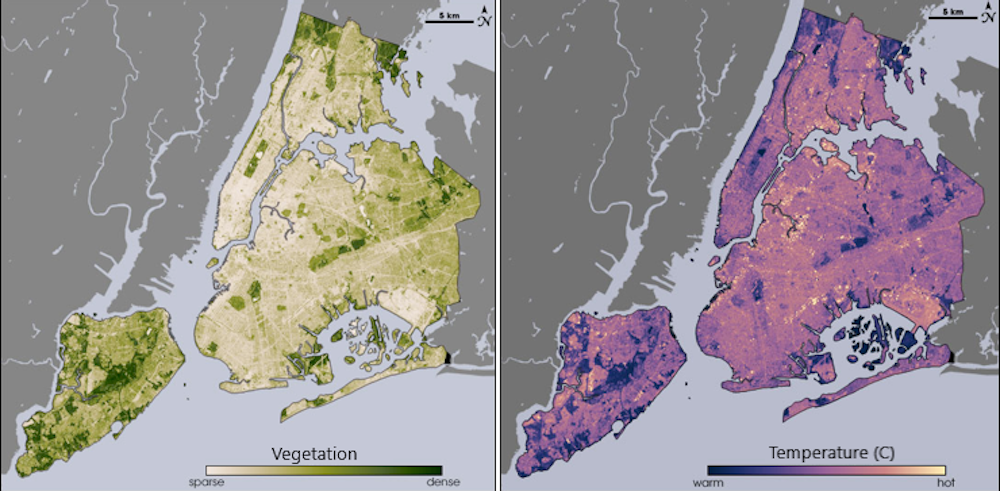
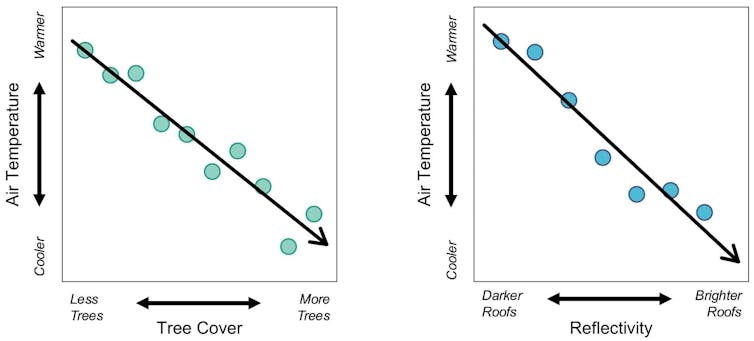
Trees like these in Boston can help keep neighborhoods cooler on hot days.
Yassine Khalfalli/Unsplash, CC BY

The wonder of trees

Urban trees offer a natural defense against rising temperatures. They cast shade and release water vapor through their leaves, a process akin to human sweating. That cools the surrounding air and reduces afternoon heat.

Adding trees to city streets, parks and residential yards can make a meaningful difference in how hot a neighborhood feels, with blocks that have tree canopies nearly 3 F (1.7 C) cooler than blocks without trees.

Two maps of New York City show how vegetation matches cooler areas by temperature.
Comparing maps of New York’s vegetation and temperature shows the cooling effect of parks and neighborhoods with more trees. In the map on the left, lighter colors are areas with fewer trees. Light areas in the map on the right are hotter.
NASA/USGS Landsat

But planting trees isn’t always simple.

In hot, dry cities, trees often require irrigation to survive, which can strain already limited water resources. Trees must survive for decades to grow large enough to provide shade and release enough water vapor to reduce air temperatures.

Annual maintenance costs – about US$900 per tree per year in Boston – can surpass the initial planting investment.

Most challenging of all, dense urban neighborhoods where heat is most intense are often too packed with buildings and roads to grow more trees.

How cool roofs can help on hot days

Another option is “cool roofs.” Coating rooftops with reflective paint or using light-colored materials allows buildings to reflect more sunlight back into the atmosphere rather than absorbing it as heat.

These roofs can lower the temperature inside an apartment building without air conditioning by about 2 to 6 F (1 to 3.3 C), and can cut peak cooling demand by as much as 27% in air-conditioned buildings, one study found. They can also provide immediate relief by reducing outdoor temperatures in densely populated areas. The maintenance costs are also lower than expanding urban forests.

However, like trees, cool roofs come with limits. Cool roofs work better on flat roofs than sloped roofs with shingles, as flat roofs are often covered by heat-trapping rubber and are exposed to more direct sunlight over the course of an afternoon.

Cities also have a finite number of rooftops that can be retrofitted. And in cities that already have many light-colored roofs, a few more might help lower cooling costs in those buildings, but they won’t do much more for the neighborhood.

By weighing the trade-offs of both strategies, cities can design location-specific plans to beat the heat.

Choosing the right mix of cooling solutions

Many cities around the world have taken steps to adapt to extreme heat, with tree planting and cool roof programs that implement reflectivity requirements or incentivize cool roof adoption.

In Detroit, nonprofit organizations have planted more than 166,000 trees since 1989. In Los Angeles, building codes now require new residential roofs to meet specific reflectivity standards.

In a recent study, we analyzed Boston’s potential to lower heat in vulnerable neighborhoods across the city. The results demonstrate how a balanced, budget-conscious strategy could deliver significant cooling benefits.

For example, we found that planting trees can cool the air 35% more than installing cool roofs in places where trees can actually be planted.

However, many of the best places for new trees in Boston aren’t in the neighborhoods that need help. In these neighborhoods, we found that reflective roofs were the better choice.

By investing less than 1% of the city’s annual operating budget, about US$34 million, in 2,500 new trees and 3,000 cool roofs targeting the most at-risk areas, we found that Boston could reduce heat exposure for nearly 80,000 residents. The results would reduce summertime afternoon air temperatures by over 1 F (0.6 C) in those neighborhoods.

While that reduction might seem modest, reductions of this magnitude have been found to dramatically reduce heat-related illness and death, increase labor productivity and reduce energy costs associated with building cooling.

Not every city will benefit from the same mix. Boston’s urban landscape includes many flat, black rooftops that reflect only about 12% of sunlight, making cool roofs that reflect over 65% of sunlight an especially effective intervention. Boston also has a relatively moist growing season that supports a thriving urban tree canopy, making both solutions viable.

Two aerial images show very different building coloring in two cities.
Phoenix, left, already has a lot of light-colored roots, compared with Boston, right, where roofs are mostly dark.
Imagery © Google 2025.

In places with fewer flat, dark rooftops suitable for cool roof conversion, tree planting may offer more value. Conversely, in cities with little room left for new trees or where extreme heat and drought limit tree survival, cool roofs may be the better bet.

Phoenix, for example, already has many light-colored roofs. Trees might be an option there, but they will require irrigation.

Getting the solutions where people need them

Adding shade along sidewalks can do double-duty by giving pedestrians a place to get out of the sun and cooling buildings. In New York City, for example, street trees account for an estimated 25% of the entire urban forest.

Cool roofs can be more difficult for a government to implement because they require working with building owners. That often means cities need to provide incentives. Louisville, Kentucky, for example, offers rebates of up to $2,000 for homeowners who install reflective roofing materials, and up to $5,000 for commercial businesses with flat roofs that use reflective coatings.

Two charts show improvements
In Boston, planting trees, left, and increasing roof reflectivity, right, were both found to be effective ways to cool urban areas.
Ian Smith et al. 2025

Efforts like these can help spread cool roof benefits across densely populated neighborhoods that need cooling help most.

As climate change drives more frequent and intense urban heat, cities have powerful tools for lowering the temperature. With some attention to what already exists and what’s feasible, they can find the right budget-conscious strategy that will deliver cooling benefits for everyone.The Conversation

About the Author:

Ian Smith, Research Scientist in Earth & Environment, Boston University and Lucy Hutyra, Distinguished Professor & Chair of Earth and Environment, Boston University, Boston University

This article is republished from The Conversation under a Creative Commons license. Read the original article.


California farmers identify a hot new cash crop: Solar power

By Jacob Stid, Michigan State University; Annick Anctil, Michigan State University, and Anthony Kendall, Michigan State University 

Imagine that you own a small, 20-acre farm in California’s Central Valley. You and your family have cultivated this land for decades, but drought, increasing costs and decreasing water availability are making each year more difficult.

Now imagine that a solar-electricity developer approaches you and presents three options:

  • You can lease the developer 10 acres of otherwise productive cropland, on which the developer will build an array of solar panels and sell electricity to the local power company.
  • You can select 1 or 2 acres of your land on which to build and operate your own solar array, using some electricity for your farm and selling the rest to the utility.
  • Or you can keep going as you have been, hoping your farm can somehow survive.

Thousands of farmers across the country, including in the Central Valley, are choosing one of the first two options. A 2022 survey by the U.S. Department of Agriculture found that roughly 117,000 U.S. farm operations have some type of solar device. Our own work has identified over 6,500 solar arrays currently located on U.S. farmland.

Our study of nearly 1,000 solar arrays built on 10,000 acres of the Central Valley over the past two decades found that solar power and farming are complementing each other in farmers’ business operations. As a result, farmers are making and saving more money while using less water – helping them keep their land and livelihood.

A hotter, drier and more built-up future

Perhaps nowhere in the U.S. is farmland more valuable or more productive than California’s Central Valley. The region grows a vast array of crops, including nearly all of the nation’s production of almonds, olives and sweet rice. Using less than 1% of all farmland in the country, the Central Valley supplies a quarter of the nation’s food, including 40% of its fruits, nuts and other fresh foods.

The food, fuel and fiber that these farms produce are a bedrock of the nation’s economy, food system and way of life.

But decades of intense cultivation, urban development and climate change are squeezing farmers. Water is limited, and getting more so: A state law passed in 2014 requires farmers to further reduce their water usage by the mid-2040s.

The trade-offs of installing solar on agricultural land

When the solar arrays we studied were installed, California state solar energy policy and incentives gave farm landowners new ways to diversify their income by either leasing their land for solar arrays or building their own.

There was an obvious trade-off: Turning land used for crops to land used for solar usually means losing agricultural production. We estimated that over the 25-year life of the solar arrays, this land would have produced enough food to feed 86,000 people a year, assuming they eat 2,000 calories a day.

There was an obvious benefit, too, of clean energy: These arrays produced enough renewable electricity to power 470,000 U.S. households every year.

But the result we were hoping to identify and measure was the economic effect of shifting that land from agricultural farming to solar farming. We found that farmers who installed solar were dramatically better off than those who did not.

They were better off in two ways, the first being financially. All the farmers, whether they owned their own arrays or leased their land to others, saved money on seeds, fertilizer and other costs associated with growing and harvesting crops. They also earned money from leasing the land, offsetting farm energy bills, and selling their excess electricity.

Farmers who owned their own arrays had to pay for the panels, equipment and installation, and maintenance. But even after covering those costs, their savings and earnings added up to US$50,000 per acre of profits every year, 25 times the amount they would have earned by planting that acre.

Farmers who leased their land made much less money but still avoided costs for irrigation water and operations on that part of their farm, gaining $1,100 per acre per year – with no up-front costs.

The farmers also conserved water, which in turn supported compliance with the state’s Sustainable Groundwater Management Act water use reduction requirements. Most of the solar arrays were installed on land that had previously been irrigated. We calculated that turning off irrigation on this land saved enough water every year to supply about 27 million people with drinking water or irrigate 7,500 acres of orchards. Following solar array installation, some farmers also fallowed surrounding land, perhaps enabled by the new stable income stream, which further reduced water use.

Changes to food and energy production

Farmers in the Central Valley and elsewhere are now cultivating both food and energy. This shift can offer long-term security for farmland owners, particularly for those who install and run their own arrays.

Recent estimates suggest that converting between 1.1% and 2.4% of the country’s farmland to solar arrays would, along with other clean energy sources, generate enough electricity to eliminate the nation’s need for fossil fuel power plants.

Though many crops are part of a global market that can adjust to changes in supply, losing this farmland could affect the availability of some crops. Fortunately, farmers and landowners are finding new ways to protect farmland and food security while supporting clean energy.

One such approach is agrivoltaics, where farmers install solar designed for grazing livestock or growing crops beneath the panels. Solar can also be sited on less productive farmland or on farmland that is used for biofuels rather than food production.

Even in these areas, arrays can be designed and managed to benefit local agriculture and natural ecosystems. With thoughtful design, siting and management, solar can give back to the land and the ecosystems it touches.

Farms are much more than the land they occupy and the goods they produce. Farms are run by people with families, whose well-being depends on essential and variable resources such as water, fertilizer, fuel, electricity and crop sales. Farmers often borrow money during the planting season in hopes of making enough at harvest time to pay off the debt and keep a little profit.

Installing solar on their land can give farmers a diversified income, help them save water, and reduce the risk of bad years. That can make solar an asset to farming, not a threat to the food supply.The Conversation

About the Authors:

Jacob Stid, Ph.D. student in Hydrogeology, Michigan State University; Annick Anctil, Associate Professor of Civil and Environmental Engineering, Michigan State University, and Anthony Kendall, Professor of Earth and Environmental Sciences, Michigan State University

This article is republished from The Conversation under a Creative Commons license. Read the original article.