Is the Bitcoin Cycle Dead?

Source: Stephen McBride (7/29/25) 

Stephen McBride of RiskHedge shares his thoughts on the Bitcoin cycle, and what investors should really be paying attention to.

“3 up, 1 down.” This represents the historical rhythm that Bitcoin (BTC) and cryptocurrency values have typically followed.

We refer to it as the four-year cycle. It was a sequence so reliable, you could synchronize your timepiece to it, as demonstrated by this chart of Bitcoin’s yearly performance:

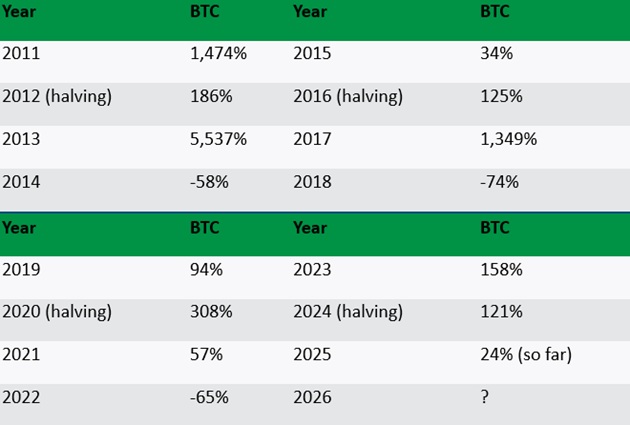
Numerous investors continue to operate according to this four-year framework. However, as I’ll demonstrate, the conventional four-year pattern has likely concluded, and that’s actually positive news.

January 11, 2024 . . .

The moment Bitcoin’s rhythm broke.

What occurred that day?

The initial Bitcoin ETFs commenced trading in the United States.

Bitcoin was previously a fringe asset. To acquire it, you needed to establish a cryptocurrency wallet, transfer your funds to a suspicious-looking exchange, and hope it remained secure. And incorporating it into your retirement portfolio was virtually impossible. Too complicated for most people.

Currently, you can purchase Bitcoin as straightforwardly as Apple Inc. (AAPL:NASDAQ) or Tesla Inc. (TSLA:NASDAQ).

ETFs unlocked access to Wall Street capital. And funds rapidly streamed in. BlackRock, Inc.’s (BLK:NYSE) Bitcoin ETF — the iShares Bitcoin Trust ETF (IBIT) — emerged as the fastest-expanding ETF ever. Within less than two years, $87 billion flowed into it. It represents the most successful ETF introduction in history, by a substantial margin. For context, the biggest gold ETF — the SPDR Gold Trust (GLD) — has existed for over twenty years and manages $100 billion. I anticipate IBIT will exceed GLD within the coming months.

Hello, infinite bid. . .

The reality that anyone can easily purchase BTC and Ethereum (ETH) through an ETF has fundamentally altered cryptocurrency markets permanently.

The “infinite bid” from wealth administrators constitutes the most significant positive force in cryptocurrency’s existence.

Cryptocurrency is now substantially controlled by professional investors who are theoretically less susceptible to excessive speculation. Though I’ll share a secret: Many I’m familiar with remain impulsive gamblers.

This suggests the explosive peaks and devastating 80% collapses we’ve become accustomed to will likely transform into more consistent upward trends interrupted by less severe corrections.

The traditional four-year cycle has likely concluded, and that’s actually positive news. Less frenzied expansion. More sustainable growth. This shift mirrors financial market evolution. Early stock markets experienced complete panics every couple of years, while contemporary markets face crises every 20–30 years.

Cryptocurrency is following the same maturation trajectory, just compressed into a briefer timeframe.

This consistent influx of capital didn’t exist in cryptocurrency . . . at least until ETFs arrived.

When tens of millions of Americans receive paychecks biweekly, they invest in stocks through their retirement accounts and 401(k)s. This generates ongoing demand for stocks, which I’d suggest establishes a minimum price threshold.

Now, the planet’s largest asset managers — including BlackRock, Fidelity, VanEck, and others — are advising their clients to acquire and maintain BTC in their 401(k)s.

The barriers have collapsed. Billions of dollars of Wall Street capital are entering cryptocurrency for the first time ever. There’s $8 trillion allocated in 401(k) plans currently. If cryptocurrency captures merely 1% of 401(k) assets, that’s $80 billion in fresh money entering the market.

If you’re curious about our position in the Bitcoin cycle, you’re focusing on the wrong issue.

The more relevant question is: Which cryptocurrency asset will Wall Street target next?

Bitcoin was the first “legitimate” cryptocurrency that institutions could engage with. Everything else was too ambiguous. The regulatory uncertainty was excessive.

But that’s changing as well.

The current U.S. administration has made its stance clear. They intend to “make America the crypto capital of the world” (their words).

In recent weeks, Congress approved several pro-cryptocurrency bills that will provide the industry with essential regulatory clarity. Regulation has shifted from risk to opportunity. And now, the entire cryptocurrency space will become accessible to Wall Street. That’s driving investment currently.

Ethereum stands as the obvious successor.

It offers considerably more functionality than Bitcoin. It’s rapidly becoming the settlement foundation for a new global financial infrastructure.

Robinhood Markets Inc. (HOOD:NASDAQ) is developing its tokenized stock platform on Ethereum. A selection of companies creating products on Ethereum includes: PayPal Holdings Inc. (PYPL:NASDAQ), Visa Inc. (V:NYSE), Stripe, Fidelity,JPMorgan Chase & Co (JPM:NYSE), Mastercard Inc. (MA:NYSE), and Shopify Inc. (SHOP:NASDAQ).

Wall Street is finally recognizing this potential.

Inflows into ETH ETFs are accelerating exponentially.

From July 2024 to June 2025, a total of $4.2 billion entered these funds. This month alone (July 2025), witnessed $4.4 billion pour into the ETH ETFs! That indicates Wall Street is moving into cryptocurrency in a big way.

One final thing: the Bitcoin cycle may be dead, but the opportunity in crypto is very much alive. I’ll have more to say on emerging crypto developments in future issues of my twice-weekly investing letter The Jolt. If you’d like to join, you can sign up here.


Important Disclosures:

  1. Stephen McBride: I, or members of my immediate household or family, own: Ethereum. My company has a financial relationship with: None. My company has purchased stocks mentioned in this article for my management clients: None. I determined which companies would be included in this article based on my research and understanding of the sector.
  2. Statements and opinions expressed are the opinions of the author and not of Streetwise Reports, Street Smart, or their officers. The author is wholly responsible for the accuracy of the statements. Streetwise Reports was not paid by the author to publish or syndicate this article. Streetwise Reports requires contributing authors to disclose any shareholdings in, or economic relationships with, companies that they write about. Any disclosures from the author can be found  below. Streetwise Reports relies upon the authors to accurately provide this information and Streetwise Reports has no means of verifying its accuracy.
  3.  This article does not constitute investment advice and is not a solicitation for any investment. Streetwise Reports does not render general or specific investment advice and the information on Streetwise Reports should not be considered a recommendation to buy or sell any security. Each reader is encouraged to consult with his or her personal financial adviser and perform their own comprehensive investment research. By opening this page, each reader accepts and agrees to Streetwise Reports’ terms of use and full legal disclaimer. Streetwise Reports does not endorse or recommend the business, products, services or securities of any company.

For additional disclosures, please click here.

What’s Next For Gold?

Source: Adrian Day (7/29/25)

Global Analyst Adrian Day reviews initial results from Altius Minerals Corp. (ALS:TSX) and takes a look at gold and gold stocks.

Altius Minerals Corp. (ALS:TSX) reported royalty revenue lower than both the previous and the year-ago quarter, as well as below estimates. Attributable revenue fell CA$2.3 million from CA$15 million in the first quarter, largely due to weak iron ore royalties, which accounted for CA$1.7 million of the decline.

Base metals revenue also fell due mostly to the timing of deliveries; potash was also down due to maintenance downtime. Given the temporary nature of these issues and higher prices, we expect both segments to recovery this quarter. These three areas were also down relative to the year-ago quarter, with iron ore revenue falling from a particularly strong $4.1 million to $1.1million.

Overall, revenue fell from over $20 million in the year-ago quarter to $12.7 million last quarter. Renewable energy saw high revenue as projects ramp up. The near-term focus continues to be the disposition of Altius’ 1.5% royalty on Anglo’s Arthur Deposit, with a pro forma value, based on the sale of Orogen’s similar 1% royalty, of CA$515 million, or just over 40% of Altius’ market cap.

Altius remains a Buy based on its NAV and potential gains from the sale of its Arthur royalty (or more).

TOP PICKS this week, in addition to above, include Nestle SA (NESN:VX; NSRGY:OTC), Franco-Nevada Corp. (FNV:TSX; FNV:NYSE), Royal Gold Inc. (RGLD:NASDAQ), and Fox River Resources Corp. (FOX:CSE).

THE U.S. DOLLAR After falling 11% in the first half, the worst first-half since 1973, the dollar is oversold; we should not expect another imminent sharp decline; markets don’t move in straight lines. However, a recovery may be slow and modest rather than any V-shaped rebound. Tariffs and other policies are making foreign investors reduce exposure to U.S. assets. When a foreigner buys, for example, U.S. stocks, bonds, or real estate, he must first convert his currency into dollars, boosting the dollar. A reduced appetite for U.S. assets, therefore, reduces demand for dollars. We are not forecasting a dollar collapse any time soon — other major currencies hardly represent fiscal rectitude — but at the margin, appetite for the Euro, British pound, yen, and commodity currencies (including the Canadian dollar, already up this year from 0.69 cents to 73) will increase, along with an increased demand for gold.

Gold Buying Trends and Stock Valuations

Central bank buying picked up in May, as gross sales declined meaningfully, the latest month for which data is available; though above multi-year levels, buying remains below the levels of 2023 and 2024. The People’s Bank of China added for the seventh straight month, after a pause last fall. Meanwhile, Chinese non-official buying, including inflows to China gold ETFs, has dwindled to almost nothingness, after surging earlier in the year. Global ETF inflows have picked up, however, the remain soft in the U.S. There were some inflows in the first three weeks of June, but then buying fell off again, with the largest ETF, GLD, seeing over $900 million in net outflows since June 24th. Commodity traders continue to be positive, but have reduced their positions all year (to little more than half of the February peak).

A record 95% of central banks expect global gold reserves to increase over the next 12 months, while none expects a decrease, this according to a survey from the World Gold Council. Over 40% of respondents expected their own reserves to increase, and none a decrease. After another strong quarter of central bank buying, gold is now the second-largest reserve asset, surpassing the Euro.

Main Drivers of Gold Remain Intact

For now, the major driver of gold buying revolves around possible changes in the global monetary regime, most notably central bank diversification in the face of dollar weaponization. Nothing that has happened this year diminishes that drive. Given this, it makes sense that U.S. demand has been weak, since concerns about monetary regime changes are more muted. But a major and long-lasting change in that regime, with the U.S. dollar losing its status as the sole reserve currency, along with less willingness to hold dollars internationally, most assuredly will have a significant impact on the U.S. economy and investor sentiment (cf. Britain in the 1950s to 1970s, when the pound fell from being worth five dollars to par, before Margaret Thatcher rescued the country).

There have been other factors supporting gold, of course, as diverse as the Trump-Powell tiff and the Middle East. But we have yet to see the macroeconomic environment, the things that traditionally drive gold, turn in gold’s favor. The U.S. has been characterized by a strong economy, low and falling inflation, high interest rates (and positive real rates), and, until this year, a relatively strong dollar. This is precisely the opposite of the environment conducive to gold. All of this is changing, if slowly, and as the narrative shifts, U.S. interest in gold will increase.

Gold Stock Sentiment Remains Weak

Add to the economic environment the fact that the S&P continues to go up month after month (as does the so-called Magnificent 7, despite some individual names stumbling), means that investors do not see the need to buy gold stocks. After a minor flurry into gold miner ETFs in late May early June, the flows reversed, with the GDX seeing $570 million of outflows in the past month, over $3.4 billion for the year to date. The dichotomy between prices and flows has never been greater.

Generalist interest is even weaker. Almost 80% of investment advisors have been zero and 1% exposure to gold in accounts they manage (and I bet for most of them, it’s close to zero than to 1%). Non-gold mutual funds have virtually no exposure. A total of 322 of the largest funds holds just 35 gold stocks. Only three funds own GLD among their top 20 positions, four own Newmont, and one owns Barrick.

Crowded Trade? Anything But

Staggeringly and unbelievably, global fund managers think that gold is the “most crowded” trade, according to a survey from Bank of America, with 58% of managers choosing gold against 22% saying the Magnificent 7, and only 1% saying the U.S. two-year Treasury. The number selecting gold (in May, the latest month) was up on April, despite the flat gold price since then. This is a reflection of managers who missed the bull move, in my view.

S&P investors, of course, are already lagging, with not only gold stocks but gold itself beating the S&P over the past four-, three-, two- and one-year periods, as well as year to Source: Bloomberg Date, and increasingly handsomely so (with the XAU up over 50% this year against less than 8% for the S&P, including dividends). In the graph are gold (white), the XAU (blue) and the S&P (red) year to date.

Gold Stocks Remain Undervalued, as Value Increases

Oscar Wilde berated those who know the price of everything but the value of nothing. Certainly, the 50% plus increase in the XAU indices this year has led many to instinctively think that the gold stocks are expensive. But the stocks are still extremely undervalued.

As the price of gold moves up, from the low $1,600s less than three years ago, to today $3,350, the value of the gold in the ground moves up; the price-to-NAV has therefore not increased over that period. As the price of gold has moved up far more rapidly than the cost of mining, the margins have expanded and with it corporate cash flows increased; thus the price-to-cash flow multiples have declined.

So we see the gold-standard of mining companies, Agnico Eagle Mines Ltd. (AEM:TSX; AEM:NYSE), trading in its lowest quartile of price-to-cash flow metric in 40 years; while Barrick Mining Corp. (ABX:TSX; B:NYSE), the #2 gold producer, is trading in the lowest decile of price-to-NAV in its history. Normally, when the price of the commodity goes up, we expect to see multiple expansion not contraction. Commodity prices are trading at 100-year lows relative to U.S. stocks. The same is true of mining stocks generally,

Sources: S&P Market Intelligence; Statista not only gold stocks; they are trading at significant 100-year lows, and less than 10% of their late-1960 relative valuation peaks.


Important Disclosures:

  1. As of the date of this article, officers and/or employees of Streetwise Reports LLC (including members of their household) own securities of Altius Minerals Corp., Franco-Nevada Corp., Fox Riv Res Corp., Agnico Eagle Mines Limited, and Barrick Mng Corp.
  2. Adrian Day: I, or members of my immediate household or family, own securities of: All. My company has a financial relationship with: None.  My company has purchased stocks mentioned in this article for my management clients: All.  I determined which companies would be included in this article based on my research and understanding of the sector.
  3. Statements and opinions expressed are the opinions of the author and not of Streetwise Reports, Street Smart, or their officers. The author is wholly responsible for the accuracy of the statements. Streetwise Reports was not paid by the author to publish or syndicate this article. Streetwise Reports requires contributing authors to disclose any shareholdings in, or economic relationships with, companies that they write about. Any disclosures from the author can be found  below. Streetwise Reports relies upon the authors to accurately provide this information and Streetwise Reports has no means of verifying its accuracy.
  4.  This article does not constitute investment advice and is not a solicitation for any investment. Streetwise Reports does not render general or specific investment advice and the information on Streetwise Reports should not be considered a recommendation to buy or sell any security. Each reader is encouraged to consult with his or her personal financial adviser and perform their own comprehensive investment research. By opening this page, each reader accepts and agrees to Streetwise Reports’ terms of use and full legal disclaimer. Streetwise Reports does not endorse or recommend the business, products, services or securities of any company.

For additional disclosures, please click here.

Adrian Day Disclosures

Adrian Day’s Global Analyst is distributed for $990 per year by Investment Consultants International, Ltd., P.O. Box 6644, Annapolis, MD 21401. (410) 224-8885. www.AdrianDayGlobalAnalyst.com. Publisher: Adrian Day. Owner: Investment Consultants International, Ltd. Staff may have positions in securities discussed herein. Adrian Day is also President of Global Strategic Management (GSM), a registered investment advisor, and a separate company from this service. In his capacity as GSM president, Adrian Day may be buying or selling for clients securities recommended herein concurrently, before or after recommendations herein, and may be acting for clients in a manner contrary to recommendations herein. This is not a solicitation for GSM. Views herein are the editor’s opinion and not fact. All information is believed to be correct, but its accuracy cannot be guaranteed. The owner and editor are not responsible for errors and omissions. © 2023. Adrian Day’s Global Analyst. Information and advice herein are intended purely for the subscriber’s own account. Under no circumstances may any part of a Global Analyst e-mail be copied or distributed without prior written permission of the editor. Given the nature of this service, we will pursue any violations aggressively.

Little Oil and Gas Junior at an Excellent Price

Source: Michael Ballanger (7/30/25) 

Michael Ballanger of GGM Advisory Inc. explains why he thinks Ring Energy Inc. (REI:NYSE) is a Buy.

Ring Energy Inc. (REI:NYSE) is an independent oil and gas exploration and production company focused on the Permian Basin in West Texas.

They engage in the acquisition, exploration, development, and production of oil and natural gas properties.  The company’s operations are primarily located in the Northwest Shelf and Central Basin Platform in West Texas.

Here’s a more detailed breakdown:

Core Business:

Ring Energy’s main activities include acquiring, exploring, developing, and producing oil and natural gas.

Geographic Focus:

The company’s operations are concentrated in the Permian Basin, specifically the Northwest Shelf and Central Basin Platform in West Texas.

Production Method:

Ring Energy primarily utilizes vertical drilling to produce oil and natural gas, according to TMX Money and Simply Wall Street.

Company Size:

With 108 employees, Ring Energy is considered a mid-sized company within the energy sector.

 Headquarters:

The company’s headquarters are located in The Woodlands, Texas.

Recent Performance:

In 2023, Ring Energy saw record fourth quarter and full year oil and gas sales volumes, according to their press release.

Recent Price:

The shares are trading at the US$0.8223 level with a 52-week range of US$.72 to US$1.99.

Valuation: 

The shares trade at a 30 P/E and have a book value of US$4.24.

Conclusion

The shares of this little junior oil and gas producer are an excellent place to hide in the event of a painful correction overtaking the U.S. equity markets.

The stock is cheap trading at a fraction of book value versus the industry average shown below:

If we call REI an “explorer-producer,” then it should trade at 1.74 times book value which was established at $4.24 so $4.24 times 1.74 = $7.37 per share. From what I am hearing through my dear friend Freddie (of Freddie’s Corner fame), there has been talk of a buyer surfacing.

Well, we hear those narratives all the time but being the super sleuth that he is Freddie drew my attention to the REI September $1.00 calls where the volume today exceeds 30,722 contracts with a daily range of $0.01-$0.08 per contract.

Since the stock hasn’t been over $1.00 since April 7, someone is making a big bet that it will before September 19. What option volume like this tells us is that someone might be getting ready to make a bid for Ring so with a P/E of only 2.30 while trading at 19.58% of book versus industry average at 1.74, valuation is cheap enough to represent minimal downside risk versus substantial capital appreciation potential.

This is a great proxy for one’s allocation to the energy sector.

In the GGMA 2025 Portfolio Account:

  • BUY 50,000 REI at $0.83
  • Target $2.00


Important Disclosures:

  1. Michael Ballanger: I, or members of my immediate household or family, own securities of: Ring Energy. My company has a financial relationship with: None. My company has purchased stocks mentioned in this article for my management clients: None. I determined which companies would be included in this article based on my research and understanding of the sector.
  2. Statements and opinions expressed are the opinions of the author and not of Streetwise Reports, Street Smart, or their officers. The author is wholly responsible for the accuracy of the statements. Streetwise Reports was not paid by the author to publish or syndicate this article. Streetwise Reports requires contributing authors to disclose any shareholdings in, or economic relationships with, companies that they write about. Any disclosures from the author can be found  below. Streetwise Reports relies upon the authors to accurately provide this information and Streetwise Reports has no means of verifying its accuracy.
  3.  This article does not constitute investment advice and is not a solicitation for any investment. Streetwise Reports does not render general or specific investment advice and the information on Streetwise Reports should not be considered a recommendation to buy or sell any security. Each reader is encouraged to consult with his or her personal financial adviser and perform their own comprehensive investment research. By opening this page, each reader accepts and agrees to Streetwise Reports’ terms of use and full legal disclaimer. Streetwise Reports does not endorse or recommend the business, products, services or securities of any company.

For additional disclosures, please click here.

Michael Ballanger Disclosures

This letter makes no guarantee or warranty on the accuracy or completeness of the data provided. Nothing contained herein is intended or shall be deemed to be investment advice, implied or otherwise. This letter represents my views and replicates trades that I am making but nothing more than that. Always consult your registered advisor to assist you with your investments. I accept no liability for any loss arising from the use of the data contained on this letter. Options and junior mining stocks contain a high level of risk that may result in the loss of part or all invested capital and therefore are suitable for experienced and professional investors and traders only. One should be familiar with the risks involved in junior mining and options trading and we recommend consulting a financial adviser if you feel you do not understand the risks involved.

FOMC, BoC, and BoJ expectedly kept interest rates unchanged

By JustMarkets

By the end of Wednesday, the Dow Jones Index (US30) declined by 0.38%. The S&P 500 Index (US500) fell by 0.12%, while the tech-heavy Nasdaq Index (US100) closed higher by 0.15%. The US stocks ended mostly lower on Wednesday after the Federal Reserve kept interest rates unchanged at its July meeting, as investors digested a wave of earnings reports. Fed Chair Jerome Powell noted that the Fed is still assessing the impact of Trump-era tariffs on inflation, which tempered expectations for near-term rate cuts. The decision was not unanimous: Fed governors Michelle Bowman and Christopher Waller supported a 25-basis-point rate cut.

Investors also evaluated corporate earnings: Humana, Kraft Heinz, and Visa gained on strong results, while Starbucks dropped over 1% despite higher revenue. Meanwhile, trade tensions escalated as President Trump announced 25% tariffs on Indian goods and 50% tariffs on Brazilian imports.

The Canadian dollar fell to 1.38 per US dollar, its weakest level in two months, pressured by a stronger US dollar, while Canada’s monetary and economic environment had little impact on the Loonie. The Bank of Canada’s decision to keep its key rate at 2.75%, the third pause after seven cuts. This highlighted policymakers’ caution amid ongoing tariff uncertainty, an expected GDP slowdown in Q2 (after exporters front-loaded shipments in Q1), and projections that CPI inflation will remain close to the 2% target in the medium term.

European stock markets were mostly up yesterday. Germany’s DAX (DE40) gained 0.19%, France’s CAC 40 (FR40) closed up by 0.06%, Spain’s IBEX35 (ES35) added 0.23%, and the UK’s FTSE 100 (UK100) ended slightly higher by 0.01%. Investors evaluated a range of regional economic data and fresh corporate earnings while keeping an eye on trade talks. Germany’s economy contracted by 0.1% in Q2, reversing a 0.4% growth in Q1. Meanwhile, the German cabinet approved a draft 2026 budget featuring a record €126.7 billion in investments and €174 billion in planned borrowing.

On the corporate front, Siemens Healthineers rose around 2% on strong Q3 results and updated expectations, and Porsche AG gained 1.7% as investors welcomed its strategic restructuring despite a projection cut due to €400 million in tariff-related losses. Among decliners, Adidas plunged over 11% after missing revenue targets, and Mercedes-Benz dropped 3.4% after H1 profit halved and its full-year revenue outlook was lowered.

WTI crude oil prices climbed above $70 per barrel on Wednesday, holding at a five-week high, driven by concerns over supply after President Donald Trump pressured Russia to shorten the timeline for ending the war in Ukraine. Trump gave Moscow a 10-day ultimatum to propose a satisfactory resolution or face consequences, including 100% secondary tariffs on countries continuing trade with Russia. These measures could significantly disrupt oil markets, as key US trading partners, major buyers of Russian oil, might reduce or halt purchases.

Asian markets traded mixed yesterday. Japan’s Nikkei 225 (JP225) declined by 0.05%, China’s FTSE China A50 (CHA50) rose by 0.17%, Hong Kong’s Hang Seng (HK50) dropped by 1.36%, and Australia’s ASX 200 (AU200) ended the day with a gain of 0.60%.

Official PMI data from China indicated a slowdown in July, with the composite PMI falling to a three-month low of 50.2 from June’s 50.7. Manufacturing activity remained in contraction, slipping to 49.3 from 49.7, while the services PMI declined to 50.1 — the weakest in eight months — from 50.5. Despite weak data, sentiment found some support from Wednesday’s Politburo meeting.

At its July meeting, the Bank of Japan left its short-term policy rate unchanged at 0.5%, maintaining borrowing costs at their highest level since 2008, in line with market expectations. The decision was unanimous, reflecting the Central Bank’s cautious stance on policy normalization. In its quarterly outlook, the BoJ raised its core inflation expectations for fiscal year 2025 to 2.7%, up from April’s 2.2%, while expecting it to drop to 1.8% in FY2026 and rise again to 2.0% in FY2027. The GDP growth estimate for FY2025 was slightly raised to 0.6% from 0.5%, while the FY2026 growth projection remained unchanged at 0.7%.

S&P 500 (US500) 6,362.90 −7.96 (−0.12%)

Dow Jones (US30) 44,461.28 −171.71 (−0.38%)

DAX (DE40) 24,262.22 +44.85 (+0.19%)

FTSE 100 (UK100) 9,136.94 +0.62 (+0.01%)

USD Index 99.95 +1.07 (+1.08%)

News feed for: 2025.07.31

  • Japan Industrial Production (m/m) at 02:50 (GMT+3);
  • Japan Retail Sales (m/m) at 02:50 (GMT+3);
  • Australia Retail Sales (m/m) at 04:30 (GMT+3);
  • China Manufacturing PMI (m/m) at 04:30 (GMT+3);
  • China Non-Manufacturing PMI (m/m) at 04:30 (GMT+3);
  • Japan BoJ Monetary Policy Statement at 06:00 (GMT+3);
  • Japan BoJ Interest Rate Decision at 06:00 (GMT+3);
  • Japan BoJ Outlook Report at 06:00 (GMT+3);
  • Switzerland Retail Sales (m/m) at 09:30 (GMT+3);
  • German Unemployment Rate (m/m) at 10:55 (GMT+3);
  • Eurozone Unemployment Rate (m/m) at 12:00 (GMT+3);
  • German Inflation Rate (m/m) at 15:00 (GMT+3);
  • US Initial Jobless Claims (w/w) at 15:30 (GMT+3);
  • US Core PCE Price Index (m/m) at 15:30 (GMT+3);
  • Canada GDP (m/m) at 15:30 (GMT+3);
  • US Chicago PMI (m/m) at 17:00 (GMT+3);
  • US Natural Gas Storage (w/w) at 17:30 (GMT+3).

By JustMarkets


This article reflects a personal opinion and should not be interpreted as an investment advice, and/or offer, and/or a persistent request for carrying out financial transactions, and/or a guarantee, and/or a forecast of future events.

GBP/USD Hits Lows: Weak UK Data and a Strong Dollar Weigh on the Pound

By RoboForex Analytical Department

The GBP/USD pair dropped to 1.3252, its lowest level since 11 May 2025, as a resurgent US dollar and disappointing UK economic data weighed on the pound.

Market sentiment has shifted from concerns about inflation to fears of an economic slowdown, while optimism surrounding new trade agreements has bolstered the dollar.

Although warmer weather boosted food sales, the broader economic outlook remains fragile after worse-than-expected PMI figures. This has reinforced expectations that the Bank of England (BoE) could cut interest rates by 25 basis points as early as August, with another potential reduction before year-end to stimulate growth.

Meanwhile, the dollar gained strength following the announcement of a US-EU trade deal, which imposes 15% tariffs on most European exports, including cars. The agreement has averted a further escalation in trade tensions, providing additional support for the greenback.

However, not all European leaders view the deal as favourable. Many argue that the terms disproportionately disadvantage the EU. While the UK maintains its separate agreements, the broader economic ripple effects are still being felt, given the interconnected nature of global markets.

Technical Analysis: GBP/USD

H4 Chart:

On the 4-hour chart, GBP/USD continues its downward trajectory towards 1.3152, with a consolidation range currently forming around 1.3268. A downside breakout from this range could see the pair extend losses towards 1.3152, followed by a potential corrective rebound to 1.3370. This scenario is supported by the MACD indicator, where the signal line remains below zero and points sharply downward.

H1 Chart:

On the hourly chart, the pair declined to 1.3225 before correcting to 1.3270. Further downside movement towards 1.3152 is anticipated today, with the Stochastic oscillator confirming this outlook: its signal line has crossed below 80 and is trending downward towards 20.

Conclusion

The pound remains under pressure amid a stronger dollar and a lacklustre UK economic performance. With rate cut expectations mounting and global trade dynamics shifting, further volatility in GBP/USD is likely. Traders will be watching key technical levels for confirmation of the next directional move.


Disclaimer

Any forecasts contained herein are based on the author’s particular opinion. This analysis may not be treated as trading advice. RoboForex bears no responsibility for trading results based on trading recommendations and reviews contained herein.

How wind and solar power helps keep America’s farms alive

By Paul Mwebaze, University of Illinois at Urbana-Champaign 

Drive through the plains of Iowa or Kansas and you’ll see more than rows of corn, wheat and soybeans. You’ll also see towering wind turbines spinning above fields and solar panels shining in the sun on barns and machine sheds.

For many farmers, these are lifelines. Renewable energy provides steady income and affordable power, helping farms stay viable when crop prices fall or drought strikes.

But some of that opportunity is now at risk as the Trump administration cuts federal support for renewable energy.

Wind power brings steady income for farms

Wind energy is a significant economic driver in rural America. In Iowa, for example, over 60% of the state’s electricity came from wind energy in 2024, and the state is a hub for wind turbine manufacturing and maintenance jobs.

For landowners, wind turbines often mean stable lease payments. Those historically were around US$3,000 to $5,000 per turbine per year, with some modern agreements $5,000 to $10,000 annually, secured through 20- to 30-year contracts.

Nationwide, wind and solar projects contribute about $3.5 billion annually in combined lease payments and state and local taxes, more than a third of it going directly to rural landowners.

A U.S. map shows the strongest wind power potential in the central U.S., particularly the Great Plains and Midwestern states.
States throughout the Great Plains and Midwest, from Texas to Montana to Ohio, have the strongest onshore winds and onshore wind power potential. These are also in the heart of U.S. farm country. The map shows wind speeds at 100 meters (nearly 330 feet), about the height of a typical land-based wind turbine.
NREL

These figures are backed by long-term contracts and multibillion‑dollar annual contributions, reinforcing the economic value that turbines bring to rural landowners and communities.

Wind farms also contribute to local tax revenues that help fund rural schools, roads and emergency services. In counties across Texas, wind energy has become one of the most significant contributors to local property tax bases, stabilizing community budgets and helping pay for public services as agricultural commodity revenues fluctuate.

In Oldham County in northwest Texas, for example, clean energy projects provided 22% of total county revenues in 2021. In several other rural counties, wind farms rank among the top 10 property taxpayers, contributing between 38% and 69% of tax revenue.

The construction and operation of these projects also bring local jobs in trucking, concrete work and electrical services, boosting small-town businesses.

The U.S. wind industry supports over 300,000 U.S. jobs across construction, manufacturing, operations and other roles connected to the industry, according to the American Clean Power Association.

Renewable energy has been widely expected to continue to grow along with rising energy demand. In 2024, 93% of all new electricity generating capacity was wind, solar or energy storage, and the U.S. Energy Information Administration expected a similar percentage in 2025 as of June.

Solar can cut power costs on the farm

Solar energy is also boosting farm finances. Farmers use rooftop panels on barns and ground-mounted systems to power irrigation pumps, grain dryers and cold storage facilities, cutting their power costs.

Some farmers have adopted agrivoltaics – dual-use systems that grow crops beneath solar panels. The panels provide shade, helping conserve water, while creating a second income path. These projects often cultivate pollinator-friendly plants, vegetables such as lettuce and spinach, or even grasses for grazing sheep, making the land productive for both food and energy.

Federal grants and tax credits that were significantly expanded under the 2022 Inflation Reduction Act helped make the upfront costs of solar installations affordable.

However, the federal spending bill signed by President Donald Trump on July 4, 2025, rolled back many clean energy incentives. It phases down tax credits for distributed solar projects, particularly those under 1 megawatt, which include many farm‑scale installations, and sunsets them entirely by 2028. It also eliminates bonus credits that previously supported rural and low‑income areas.

Without these credits, the upfront cost of solar power could be out of reach for some farmers, leaving them paying higher energy costs. At a 2024 conference organized by the Institute of Sustainability, Energy and Environment at the University of Illinois Urbana-Champaign, where I work as a research economist, farmers emphasized the importance of tax credits and other economic incentives to offset the upfront cost of solar power systems.

What’s being lost

The cuts to federal incentives include terminating the Production Tax Credit for new projects placed in service after Dec. 31, 2027, unless construction begins by July 4, 2026, and is completed within a tight time frame. The tax credit pays eligible wind and solar facilities approximately 2.75 cents per kilowatt-hour over 10 years, effectively lowering the cost of renewable energy generation. Ending that tax credit will likely increase the cost of production, potentially leading to higher electricity prices for consumers and fewer new projects coming online.

The changes also accelerate the phase‑out of wind power tax credits. Projects must now begin construction by July 4, 2026, or be in service before the end of 2027 to qualify for any credit.

Meanwhile, the Investment Tax Credit, which covers 30% of installed cost for solar and other renewables, faces similar limits: Projects must begin by July 4, 2026, and be completed by the end of 2027 to claim the credits. The bill also cuts bonuses for domestic components and installations in rural or low‑income locations. These adjustments could slow new renewable energy development, particularly smaller projects that directly benefit rural communities.

While many existing clean energy agreements will remain in place for now, the rollback of federal incentives threatens future projects and could limit new income streams. It also affects manufacturing and jobs in those industries, which some rural communities rely on.

Renewable energy also powers rural economies

Renewable energy benefits entire communities, not just individual farmers.

Wind and solar projects contribute millions of dollars in tax revenue. For example, in Howard County, Iowa, wind turbines generated $2.7 million in property tax revenue in 2024, accounting for 14.5% of the county’s total budget and helping fund rural schools, public safety and road improvements.

In some rural counties, clean energy is the largest new source of economic activity, helping stabilize local economies otherwise reliant on agriculture’s unpredictable income streams. These projects also support rural manufacturing – such as Iowa turbine blade factories like TPI Composites, which just reopened its plant in Newton, and Siemens Gamesa in Fort Madison, which supply blades for GE and Siemens turbines. The tax benefits in the 2022 Inflation Reduction Act helped boost those industries – and the jobs and local tax revenue they bring in.

On the solar side, rural companies like APA Solar Racking, based in Ohio, manufacture steel racking systems for utility-scale solar farms across the Midwest.

An example of how renewable energy has helped boost farm incomes and keep farmers on their land.

As rural America faces economic uncertainty and climate pressures, I believe homegrown renewable energy offers a practical path forward. Wind and solar aren’t just fueling the grid; they’re helping keep farms and rural towns alive.The Conversation

About the Author:

Paul Mwebaze, Research Economist at the Institute for Sustainability, Energy and Environment, University of Illinois at Urbana-Champaign

This article is republished from The Conversation under a Creative Commons license. Read the original article.

How the world’s nuclear watchdog monitors facilities around the world – and what it means that Iran kicked it out

By Anna Erickson, Georgia Institute of Technology 

What happens when a country seeks to develop a peaceful nuclear energy program? Every peaceful program starts with a promise not to build a nuclear weapon. Then, the global community verifies that stated intent via the Treaty on the Non-Proliferation of Nuclear Weapons.

Once a country signs the treaty, the world’s nuclear watchdog, the International Atomic Energy Agency, provides continuous and technical proof that the country’s nuclear program is peaceful.

The IAEA ensures that countries operate their programs within the limits of nonproliferation agreements: low enrichment and no reactor misuse. Part of the agreement allows the IAEA to inspect nuclear-related sites, including unannounced surprise visits.

These are not just log reviews. Inspectors know what should and should not be there. When the IAEA is not on site, cameras, tamper-revealing seals on equipment and real-time radiation monitors are working full-time to gather or verify inside information about the program’s activities.

This travel case holds a toolkit containing equipment for inspecting nuclear facilities.
Dean Calma/IAEA, CC BY

Safeguards toolkit

The IAEA safeguards toolkit is designed to detect proliferation activities early. Much of the work is fairly technical. The safeguards toolkit combines physical surveillance, material tracking, data analytics and scientific sampling. Inspectors are chemists, physicists and nuclear engineers. They count spent fuel rods in a cooling pond. They check tamper seals on centrifuges. Often, the inspectors walk miles through hallways and corridors carrying heavy equipment.

That’s how the world learned in April 2021 about Iran pushing uranium enrichment from reactor-fuel-grade to near-weapons-grade levels. IAEA inspectors were able to verify that Iran was feeding uranium into a series of centrifuges designed to enrich the uranium from 5%, used for energy programs, to 60%, which is a step toward the 90% level used in nuclear weapons.

Around the facilities, whether for uranium enrichment or plutonium processing, closed-circuit surveillance cameras monitor for undeclared materials or post-work activities. Seals around the facilities provide evidence that uranium gas cylinders have not been tampered with or that centrifuges operate at the declared levels. Beyond seals, online enrichment monitors allow inspectors to look inside of centrifuges for any changes in the declared enrichment process.

Seals verify whether nuclear equipment or materials have been used between onsite inspections.

When the inspectors are on-site, they collect environmental swipes: samples of nuclear materials on surfaces, in dust or in the air. These can reveal if uranium has been enriched to levels beyond those allowed by the agreement. Or if plutonium, which is not used in nuclear power plants, is being produced in a reactor. Swipes are precise. They can identify enrichment levels from a particle smaller than a speck of dust. But they take time, days or weeks. Inspectors analyze the samples at the IAEA’s laboratories using sophisticated equipment called mass spectrometers.

In addition to physical samples, IAEA inspectors look at the logs of material inventories. They look for diversion of uranium or plutonium from normal process lines, just like accountants trace the flow of finances, except that their verification is supported by the ever-watching online monitors and radiation sensors. They also count items of interest and weigh them for additional verification of the logs.

Beyond accounting for materials, IAEA inspectors verify that the facility matches the declared design. For example, if a country is expanding centrifuge halls to increase its enrichment capabilities, that’s a red flag. Changes to the layout of material processing laboratories near nuclear reactors could be a sign that the program is preparing to produce unauthorized plutonium.

Losing access

Iran announced on June 28, 2025, that it has ended its cooperation with the IAEA. It removed the monitoring devices, including surveillance cameras, from centrifuge halls. This move followed the news by the IAEA that Iran’s enrichment activities are well outside of allowed levels. Iran now operates sophisticated uranium centrifuges, like models IR-6 and IR-9.

Removing IAEA access means that the international community loses insight into how quickly Iran’s program can accumulate weapon-grade uranium, or how much it has produced. Also lost is information about whether the facility is undergoing changes for proliferation purposes. These processes are difficult to detect with external surveillance, like satellites, alone.

An alternative to the uranium enrichment path for producing nuclear weapons material is plutonium. Plutonium can’t be mined, it has to be produced in a nuclear reactor. Iran built a reactor capable of producing plutonium, the IR-40 Heavy Water Research Reactor at the Arak Nuclear Complex.

Iran modified the Arak reactor under the now-defunct Joint Comprehensive Plan of Action to make plutonium production less likely. During the June 2025 missile attacks, Israel targeted Arak’s facilities with the aim of eliminating the possibility of plutonium production.

With IAEA access suspended, it won’t be possible to see what happens inside the facility. Can the reactor be used for plutonium production? Although a lengthier process than the uranium enrichment path, plutonium provides a parallel path to uranium enrichment for developing nuclear weapons.

Continuity of knowledge

North Korea expelled IAEA inspectors in 2009. Within a few years, they restarted activities related to uranium enrichment and plutonium production in the Yongbyon reactor. The international community’s information about North Korea’s weapons program now relies solely on external methods: satellite images, radioactive particles like xenon – airborne fingerprints of nuclear activities – and seismic data.

What is lost is the continuity of the knowledge, a chain of verification over time. Once the seals are broken or cameras are removed, that chain is lost, and so is confidence about what is happening at the facilities.

When it comes to IAEA inspections, there is no single tool that paints the whole picture. Surveillance plus sampling plus accounting provide validation and confidence. Losing even one weakens the system in the long term.

The existing safeguards regime is meant to detect violations. The countries that sign the nonproliferation treaty know that they are always watched, and that plays a deterrence role. The inspectors can’t just resume the verification activities after some time if access is lost. Future access won’t necessarily enable inspectors to clarify what happened during the gap.The Conversation

About the Author:

Anna Erickson, Professor of Nuclear and Radiological Engineering, Georgia Institute of Technology

This article is republished from The Conversation under a Creative Commons license. Read the original article.

USD/JPY in Correction as Markets Await Signals from Fed and BoJ

By RoboForex Analytical Department

The USD/JPY pair fell to 147.92 on Wednesday, with the Japanese yen recovering some of its early-week losses as the US dollar softened ahead of the Federal Reserve’s policy meeting.

While the Fed is widely expected to keep rates on hold, market focus remains squarely on whether policymakers will signal a potential rate cut in September.

Simultaneously, investors are assessing the outcome of this week’s US–China trade talks in Stockholm, which concluded on Tuesday without an extension of the current trade truce.

Domestically, attention turns to the upcoming Bank of Japan (BoJ) policy decision. The central bank is forecast to maintain its current interest rate as it evaluates the economic impact of US tariffs. The BoJ’s quarterly outlook report may also see an upward revision to its inflation forecasts.

Political uncertainty adds another layer of complexity, with growing pressure on Prime Minister Shigeru Ishiba to resign. However, the Prime Minister has firmly denied any intention to step down.

Notably, despite broader US dollar strength across markets, the USD/JPY pair has not fully reflected this trend due to counterbalancing factors.

Technical Analysis: USD/JPY

H4 Chart:

On the H4 chart, USD/JPY continues to consolidate around 147.90, having extended its range upwards to 148.77. Following a retest of 147.90 from above, the next likely move is a push higher towards 149.11, with a potential continuation towards 150.30 if bullish momentum holds. This scenario is supported by the MACD indicator, where the signal line remains above zero and points firmly upwards.

H1 Chart:

Switching to the H1 chart, the pair is forming a consolidation range around 147.90. A breakout to the upside could see a move towards 149.11, followed by a retracement to 148.44. Conversely, a downside break may trigger a decline towards 145.90. The Stochastic oscillator aligns with this outlook, as its signal line sits above 20 and is trending upwards.

Conclusion

The USD/JPY pair remains in a corrective phase, with near-term direction hinging on policy signals from the Fed and BoJ. While technical indicators currently support a bullish bias, traders should remain alert to the possibility of breakout moves as confirmation.


Disclaimer

Any forecasts contained herein are based on the author’s particular opinion. This analysis may not be treated as trading advice. RoboForex bears no responsibility for trading results based on trading recommendations and reviews contained herein.

Mag 7 Earnings Preview: Wall Street Faces $11 Trillion Test

By ForexTime 

  • 4 of “Magnificent 7” set to publish earnings
  • Combined market cap of 4 tech titans over $11 trillion 
  • Beyond earnings, key focus on tariff impact & AI spending  
  • Meta could move almost 6% ↑ or ↓ post earnings
  • Apple shares ↓ over 15% year-to-date

Four of the “Magnificent 7” tech giants with a combined market capitalization of over $11 trillion are set to publish their results this week.

And this could be pivotal for markets given the ongoing uncertainty around Trump’s tariff drama. Investors will be eager to learn from these titans how global trade developments have affected their businesses.

Note: A volley of country-specific tariffs will take effect on August 1st, with the United States only securing six trade deals as of writing. There could be a potential extension of a tariff pause between the US and China.

Fresh updates from Mag 7 companies Microsoft, Meta, Amazon and Apple will be in focus. 

Here is what you need to know:


1) Microsoft

Microsoft reports on its fiscal Q4 2025 earnings on Wednesday 30th July after US markets close. 

Shares of the tech giant have gained over 20% year-to-date, with Wall Street analysts expecting Microsoft to post revenue and income growth amid growing AI demand. Quarterly revenues are projected to jump by 14% to $73.9 billion, while earnings per share are forecast to increase to $3.37 from $2.95 the same time a year ago.

Beyond revenue growth, updates on the Azure cloud service and AI initiatives will be in focus. 

Markets are forecasting a 3.9% move, either up or down, for Microsoft shares post earnings.

Imagen
Microsoft cfd


2) Meta

Meta is set to report second-quarter earnings after US markets close on Wednesday 30th July.

Shares of this tech titan are up almost 20% since the start of 2025, powered by the hunger for AI. Quarterly revenues are forecast to rise $44.8 billion – marking a 15% jump from a year earlier while EPS are seen jumping to $5.89 from $5.16. 

Markets are forecasting a 5.8% move, either up or down, for Meta shares post earnings.

Imagen
Meta cfd


3) Amazon

Amazon is scheduled to report second quarter earnings after US markets close on Thursday 31st July.

The tech giant is expected to report a nearly 10% jump in revenues to $162.1 billion while earnings per share are projected to increase to $1.32 from $1.26 the same time a year ago. Amazon Web Services has shown dominance in the cloud computing space, so the AWS and advertising business will be in focus.

Markets are forecasting a 5% move, either up or down, for Amazon stocks post earnings.

Imagen
amazon cfd


4) Apple

Apple reports its quarterly results after the closing bell on Thursday 31st July. 

It has been a rough year for Apple thus far with its share down over 15% year-to-date. 

The iPhone maker is expected to report 4% revenue growth amid improving services revenue and iPhone sales. Still, investors will be looking for updates on investment in Apple Intelligence and sales in China.

Markets are forecasting a 3.5% move, either up or down, for Apple shares post earnings.

Imagen
Apple cfd

Forex-Time-LogoArticle by ForexTime

ForexTime Ltd (FXTM) is an award winning international online forex broker regulated by CySEC 185/12 www.forextime.com

Today, investors focus on the Bank of Canada meeting and the FOMC decision

By JustMarkets

As of Tuesday, the Dow Jones Index (US30) fell by 0.46%. The S&P 500 Index (US500) declined by 0.30%, and the tech-heavy Nasdaq Index (US100) closed lower by 0.21%. The three major US indexes ended Tuesday in the red as mixed corporate earnings reports and caution ahead of the Federal Reserve’s monetary policy decision weighed on investor sentiment. Weak results from UnitedHealth (-7.5%), Boeing (-4.4%), and Merck (-1.7%) dragged the market down, while United Parcel Service and Whirlpool also slumped more than 10% following disappointing earnings and expectations. Investors also reacted to a decline in job openings and hiring in June, although consumer confidence in July came in higher than expected. Meanwhile, trade talks between the US and China ended without a final agreement, leaving hopes alive for an extension of the current tariff truce.

The Fed is expected to leave interest rates unchanged today, but markets are closely watching for signals on the future direction of policy amid signs of slowing inflation.

The Bank of Canada will also hold its policy meeting today. It is expected to keep interest rates unchanged at 2.75%, but the tone of the statement and the follow-up press conference will be key for markets. Recent data points to economic weakness: GDP is expected to contract for the third consecutive month, increasing the likelihood of a rate cut by year-end. With slowing inflation and weakening domestic demand, the Bank of Canada may lean toward a more dovish outlook.

The IMF expects global economic growth at 3.0% in 2025 and 3.1% in 2026, slightly above its April 2025 projections. The upgrade — by 0.2 percentage points for 2025 and 0.1 percentage points for 2026 — reflects stronger-than-expected economic activity, lower-than-expected US tariff rates, improved financial conditions (partly due to a weaker US dollar), and expanded fiscal policies in several major economies. Despite the slightly improved outlook, the IMF warns that risks remain tilted to the downside. Growth projections for key economies include the US at 1.9% in 2025 and 2.0% in 2026, the Eurozone at 1.0% and 1.2%, and the UK at 1.2% and 1.4%. China’s growth was revised upward to 4.8% and 4.2%, while Japan is expected to grow at a more modest pace of 0.7% and 0.5%.

European stock markets mostly rose yesterday. Germany’s DAX (DE40) gained 1.03%, France’s CAC 40 (FR40) closed up 0.72%, Spain’s IBEX35 (ES35) rose by 0.90%, and the UK’s FTSE 100 (UK100) ended up 0.60%. The FTSE 100 climbed over 0.5% to a new record high, supported by strong corporate earnings and improved sentiment around the UK economy. Shares of AstraZeneca jumped 3.5% following strong Q2 results, driven by high cancer drug sales and reaffirmed guidance. Barclays also rose by 2.5% despite a mixed earnings report, as its investment banking division posted solid results, benefiting from market volatility. Optimism was further boosted by the IMF’s projection that the UK’s economic growth this year and next will outpace other major European economies.

WTI crude oil prices rose by 3.7% to close at $69.20 per barrel on Tuesday, reaching a five-week high and extending Monday’s 2.4% gain, as easing trade tensions and rising geopolitical risks fueled supply concerns. Additional support came from former President Trump, who increased pressure on Russia by setting a shorter deadline for progress in ending the war in Ukraine and threatening new sanctions.

Asian markets traded mixed yesterday. Japan’s Nikkei 225 (JP225) fell by 0.79%, China’s FTSE China A50 (CHA50) rose by 0.01%, Hong Kong’s Hang Seng Index (HK50) declined by 0.15%, while Australia’s ASX 200 (AU200) posted a modest gain of 0.08%.

The Australian dollar rose above the $0.651 level on Wednesday, snapping a four-day losing streak, as a weaker US dollar outweighed weak domestic inflation data. In Australia, consumer prices rose at the slowest pace in over four years in Q2: the headline CPI was 0.7% quarter-over-quarter and 2.1% year-over-year, while core inflation fell to a three-year low of 2.7% year-over-year. Both figures came in below expectations and within the Reserve Bank of Australia’s 2–3% target range. The soft inflation data strengthened expectations for policy easing, with markets now fully pricing in a 25-basis-point rate cut at the RBA’s August meeting.

S&P 500 (US500) 6,370.86 −18.91 (−0.30%)

Dow Jones (US30) 44,632.99 −204.57 (−0.46%)

DAX (DE40) 24,217.37 +247.01 (+1.03%)

FTSE 100 (UK100) 9,136.32 +54.88 (+0.60%)

USD Index 98.92 +0.28 (+0.29%)

News feed for: 2025.07.30

  • Australia Consumer Price Index (m/m) at 04:30 (GMT+3);
  • German Retail Sales (m/m) at 09:00 (GMT+3);
  • Switzerland KOF Leading Indicators (m/m) at 10:00 (GMT+3);
  • German GDP (m/m) at 11:00 (GMT+3);
  • Eurozone GDP (m/m) at 12:00 (GMT+3);
  • US ADP Non-Farm Employment Change (m/m) at 15:30 (GMT+3);
  • US GDP (m/m) at 15:30 (GMT+3);
  • Canada BoC Monetary Policy Statement at 16:45 (GMT+3);
  • Canada Interest Rate Decision at 16:45 (GMT+3);
  • US Pending Home Sales (m/m) at 17:00 (GMT+3);
  • Canada BOC Press Conference at 17:30 (GMT+3);
  • US Crude Oil Reserves (w/w) at 17:30 (GMT+3);
  • US FOMC Statement (m/m) at 21:00 (GMT+3);
  • US Fed Interest Rate Decision (m/m) at 21:00 (GMT+3);
  • US Fed Press Conference (m/m) at 21:30 (GMT+3).

By JustMarkets


This article reflects a personal opinion and should not be interpreted as an investment advice, and/or offer, and/or a persistent request for carrying out financial transactions, and/or a guarantee, and/or a forecast of future events.