Large drop in Gold Speculator bets leads COT Metals Changes

By InvestMacro

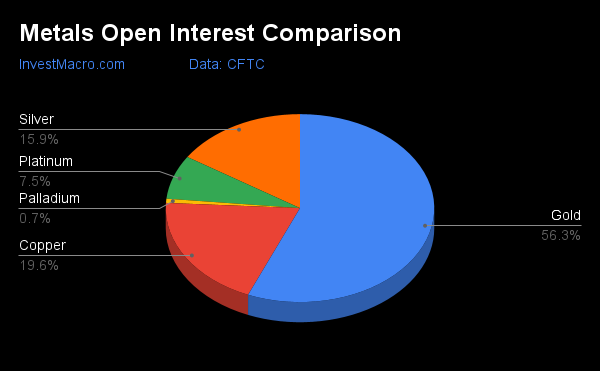
Metals Open Interest Comparison

Here are the latest charts and statistics for the Commitment of Traders (COT) data published by the Commodities Futures Trading Commission (CFTC).

The latest COT data is updated through Tuesday September 20th and shows a quick view of how large traders (for-profit speculators and commercial entities) were positioned in the futures markets.

Large drop in Gold bets leads Weekly Speculator Changes
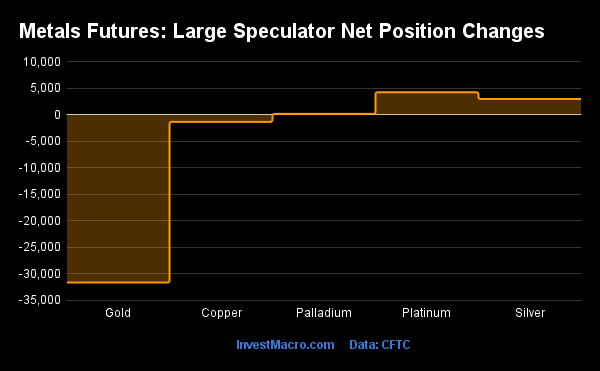
Metals Futures Large Speculator Net Position Changes

The COT precious metals speculator bets were higher overall this week as three out of the five metals markets we cover had higher positioning this week while the other two markets had lower contracts.

Leading the gains for the precious metals markets was Platinum (4,269 contracts) with Silver (3,000 contracts) and Palladium (192 contracts) also showing positive weeks.

The metals markets leading the declines in speculator bets this week were Gold (-31,622 contracts) with Copper (-1,300 contracts) also registering lower bets on the week.

Highlighting the COT Metals data this week was the sharp and continued decline in the Gold futures bets. Speculators dropped their Gold net positions this week by largest one-week amount in the past thirty-three weeks. The Gold position has now fallen for six straight weeks and by a total of -77,129 contracts over that 6-week time period. This bearishness has pushed the overall net positioning to a total of just +65,722 contracts, marking the lowest overall standing for Gold since April 23rd of 2019, a span of 178 weeks. The current investing environment has been a challenging one for Gold and the futures price this week touched the lowest level since April of 2020. Gold closed the week down over 1.6% and right around the $1,655.60 level.


Data Snapshot of Commodity Market Traders | Columns Legend
Sep-20-2022OIOI-IndexSpec-NetSpec-IndexCom-NetCOM-IndexSmalls-NetSmalls-Index
WTI Crude1,481,5451239,8788-261,5689421,69036
Gold469,395565,7220-75,4281009,7060
Silver132,1070-1,64012-5,629907,2694
Copper163,0584-20,2862223,21582-2,9298
Palladium5,9931-1,081171,26182-18033
Platinum62,900272,39012-5,496893,1065
Natural Gas960,2361-155,71132121,3086934,40362
Brent164,02511-37,9034836,732541,17125
Heating Oil292,6343214,09763-25,9414411,84439
Soybeans656,3101884,77339-55,48570-29,28822
Corn1,330,8419305,67769-241,23838-64,4396
Coffee191,433541,07274-42,998301,92617
Sugar744,972837,34544-35,86061-1,4856
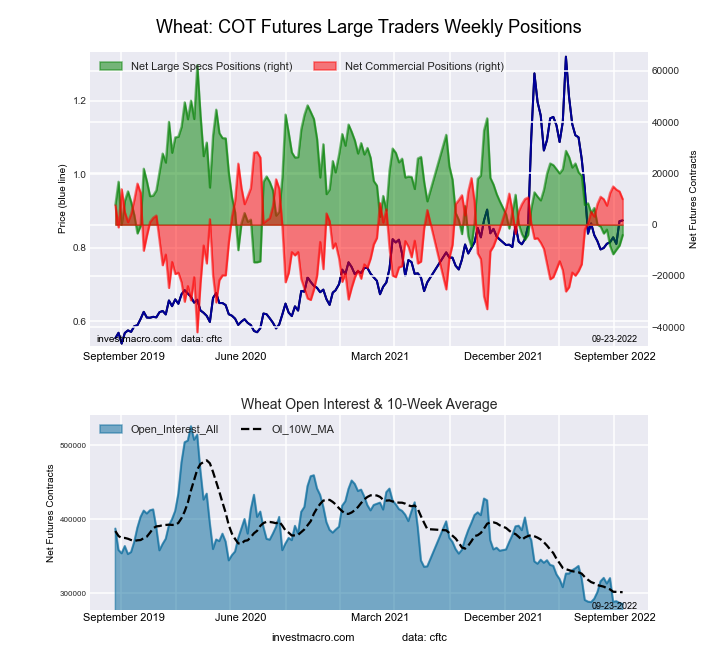
Wheat285,5670-4,029149,98274-5,95380


Strength Scores

Strength scores (a measure of the 3-Year range of Speculator positions, from 0 to 100 where above 80 is extreme bullish and below 20 is extreme bearish) showed that Copper (21.7 percent) leads the metals markets with a score that is just outside an extreme bearish position of under 20 percent.

All of the other metals markets we cover continue to have scores under 20 percent with Gold at the lowest with 0.0 percent or the lowest level in three years. Silver (12.3 percent) is up over three percent from last week followed by Platinum (12.3 percent) and Palladium (16.8 percent). Platinum and Palladium are also higher than last week’s scores.
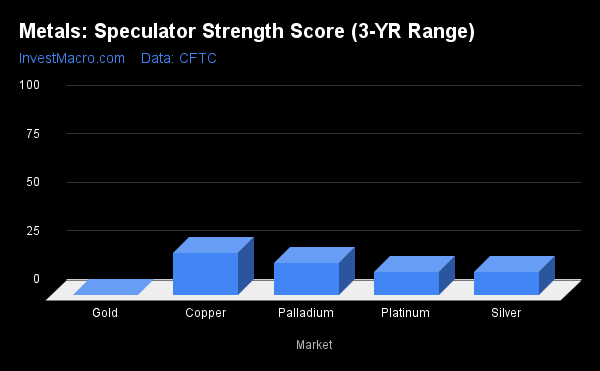

Strength Statistics:
Gold (0.0 percent) vs Gold previous week (11.0 percent)
Silver (12.3 percent) vs Silver previous week (9.0 percent)
Copper (21.7 percent) vs Copper previous week (22.7 percent)
Platinum (12.3 percent) vs Platinum previous week (6.6 percent)
Palladium (16.8 percent) vs Palladium previous week (15.7 percent)

Strength Trends

Strength Score Trends (or move index, calculates the 6-week changes in strength scores) showed that Copper (6.4 percent) leads the past six weeks trends for metals this week. Palladium (5.0 percent) and Platinum (2.1 percent) fill out the other positive movers in the latest trends data.

Gold (-26.8 percent) leads the downside trend scores with a big negative jump from last week’s -9.4 percent trend score and is followed by Silver at a trend score of -5.0 percent.
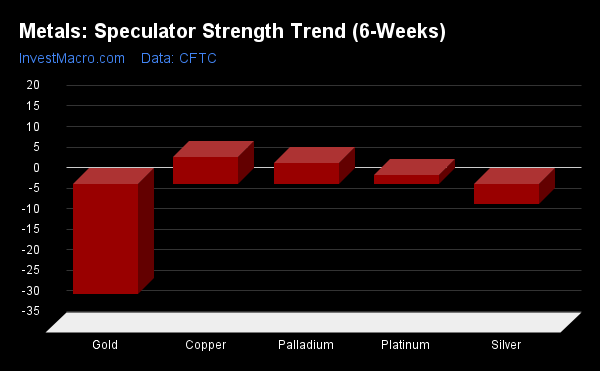
Metals Speculator Strength Trend (6-Weeks)
Move Statistics:
Gold (-26.8 percent) vs Gold previous week (-9.4 percent)
Silver (-5.0 percent) vs Silver previous week (-6.2 percent)
Copper (6.4 percent) vs Copper previous week (6.6 percent)
Platinum (2.1 percent) vs Platinum previous week (0.9 percent)
Palladium (5.0 percent) vs Palladium previous week (7.2 percent)


Individual COT Metals Market Charts:

Gold Comex Futures:
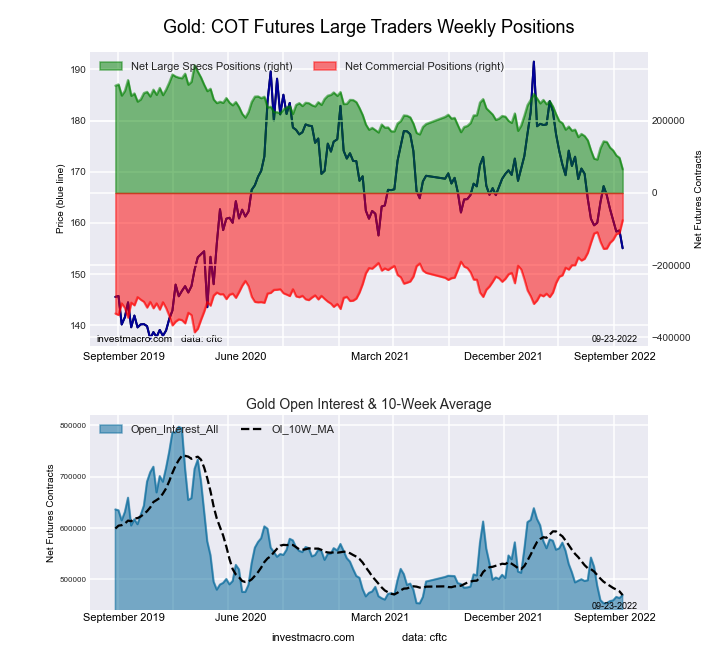
Gold Futures COT ChartThe Gold Comex Futures large speculator standing this week came in at a net position of 65,722 contracts in the data reported through Tuesday. This was a weekly fall of -31,622 contracts from the previous week which had a total of 97,344 net contracts.

This week’s current strength score (the trader positioning range over the past three years, measured from 0 to 100) shows the speculators are currently Bearish-Extreme with a score of 0.0 percent. The commercials are Bullish-Extreme with a score of 100.0 percent and the small traders (not shown in chart) are Bearish-Extreme with a score of 0.0 percent.

Gold Futures StatisticsSPECULATORSCOMMERCIALSSMALL TRADERS
– Percent of Open Interest Longs:45.730.28.6
– Percent of Open Interest Shorts:31.746.36.6
– Net Position:65,722-75,4289,706
– Gross Longs:214,557141,86240,500
– Gross Shorts:148,835217,29030,794
– Long to Short Ratio:1.4 to 10.7 to 11.3 to 1
NET POSITION TREND:
– Strength Index Score (3 Year Range Pct):0.0100.00.0
– Strength Index Reading (3 Year Range):Bearish-ExtremeBullish-ExtremeBearish-Extreme
NET POSITION MOVEMENT INDEX:
– 6-Week Change in Strength Index:-26.825.5-5.2


Silver Comex Futures:

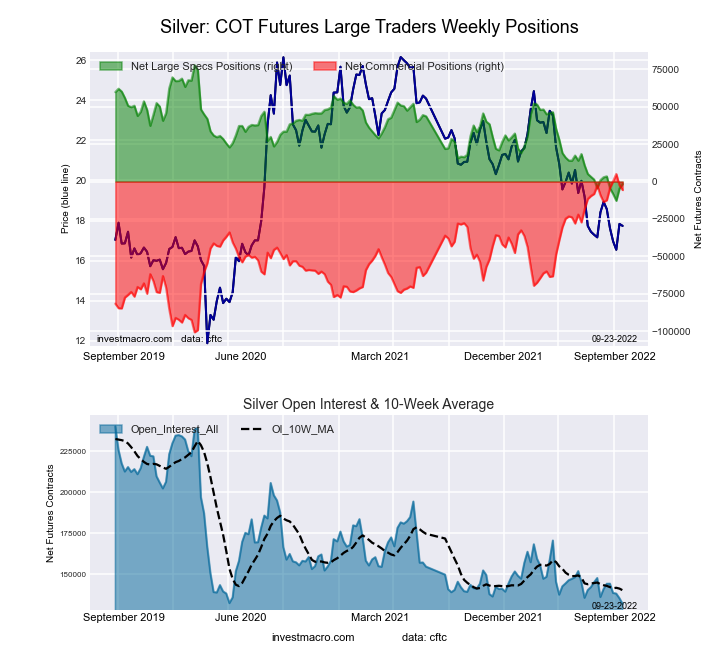
Silver Futures COT ChartThe Silver Comex Futures large speculator standing this week came in at a net position of -1,640 contracts in the data reported through Tuesday. This was a weekly lift of 3,000 contracts from the previous week which had a total of -4,640 net contracts.

This week’s current strength score (the trader positioning range over the past three years, measured from 0 to 100) shows the speculators are currently Bearish-Extreme with a score of 12.3 percent. The commercials are Bullish-Extreme with a score of 89.9 percent and the small traders (not shown in chart) are Bearish-Extreme with a score of 4.2 percent.

Silver Futures StatisticsSPECULATORSCOMMERCIALSSMALL TRADERS
– Percent of Open Interest Longs:39.638.316.2
– Percent of Open Interest Shorts:40.842.610.7
– Net Position:-1,640-5,6297,269
– Gross Longs:52,32350,66121,383
– Gross Shorts:53,96356,29014,114
– Long to Short Ratio:1.0 to 10.9 to 11.5 to 1
NET POSITION TREND:
– Strength Index Score (3 Year Range Pct):12.389.94.2
– Strength Index Reading (3 Year Range):Bearish-ExtremeBullish-ExtremeBearish-Extreme
NET POSITION MOVEMENT INDEX:
– 6-Week Change in Strength Index:-5.07.5-16.6


Copper Grade #1 Futures:

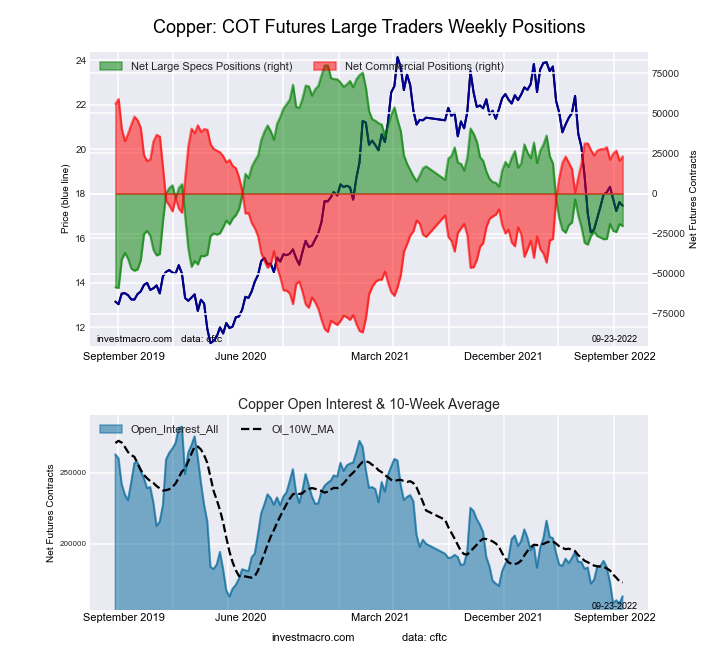
Copper Futures COT ChartThe Copper Grade #1 Futures large speculator standing this week came in at a net position of -20,286 contracts in the data reported through Tuesday. This was a weekly decrease of -1,300 contracts from the previous week which had a total of -18,986 net contracts.

This week’s current strength score (the trader positioning range over the past three years, measured from 0 to 100) shows the speculators are currently Bearish with a score of 21.7 percent. The commercials are Bullish-Extreme with a score of 81.6 percent and the small traders (not shown in chart) are Bearish-Extreme with a score of 8.4 percent.

Copper Futures StatisticsSPECULATORSCOMMERCIALSSMALL TRADERS
– Percent of Open Interest Longs:28.750.78.1
– Percent of Open Interest Shorts:41.136.59.9
– Net Position:-20,28623,215-2,929
– Gross Longs:46,77382,69313,179
– Gross Shorts:67,05959,47816,108
– Long to Short Ratio:0.7 to 11.4 to 10.8 to 1
NET POSITION TREND:
– Strength Index Score (3 Year Range Pct):21.781.68.4
– Strength Index Reading (3 Year Range):BearishBullish-ExtremeBearish-Extreme
NET POSITION MOVEMENT INDEX:
– 6-Week Change in Strength Index:6.4-3.3-21.4


Platinum Futures:

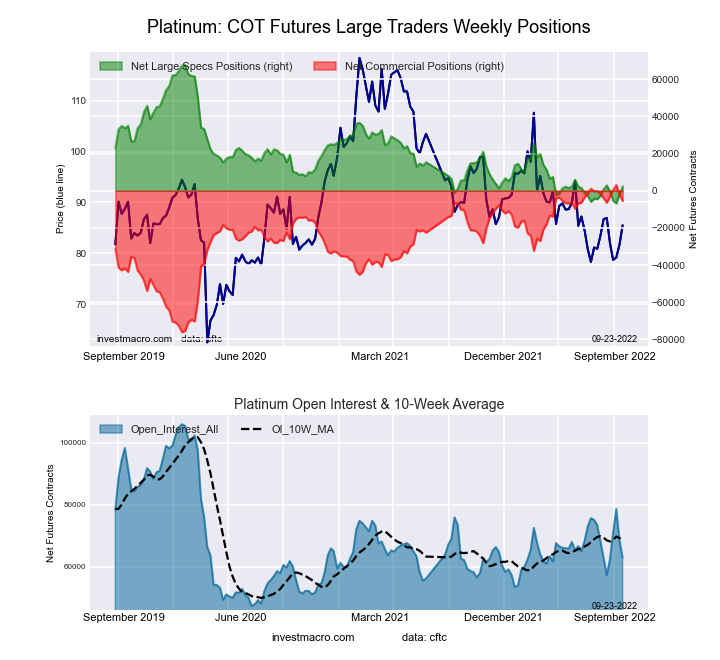
Platinum Futures COT ChartThe Platinum Futures large speculator standing this week came in at a net position of 2,390 contracts in the data reported through Tuesday. This was a weekly gain of 4,269 contracts from the previous week which had a total of -1,879 net contracts.

This week’s current strength score (the trader positioning range over the past three years, measured from 0 to 100) shows the speculators are currently Bearish-Extreme with a score of 12.3 percent. The commercials are Bullish-Extreme with a score of 89.1 percent and the small traders (not shown in chart) are Bearish-Extreme with a score of 5.2 percent.

Platinum Futures StatisticsSPECULATORSCOMMERCIALSSMALL TRADERS
– Percent of Open Interest Longs:44.138.611.8
– Percent of Open Interest Shorts:40.347.36.9
– Net Position:2,390-5,4963,106
– Gross Longs:27,75624,2817,432
– Gross Shorts:25,36629,7774,326
– Long to Short Ratio:1.1 to 10.8 to 11.7 to 1
NET POSITION TREND:
– Strength Index Score (3 Year Range Pct):12.389.15.2
– Strength Index Reading (3 Year Range):Bearish-ExtremeBullish-ExtremeBearish-Extreme
NET POSITION MOVEMENT INDEX:
– 6-Week Change in Strength Index:2.1-1.8-1.4


Palladium Futures:

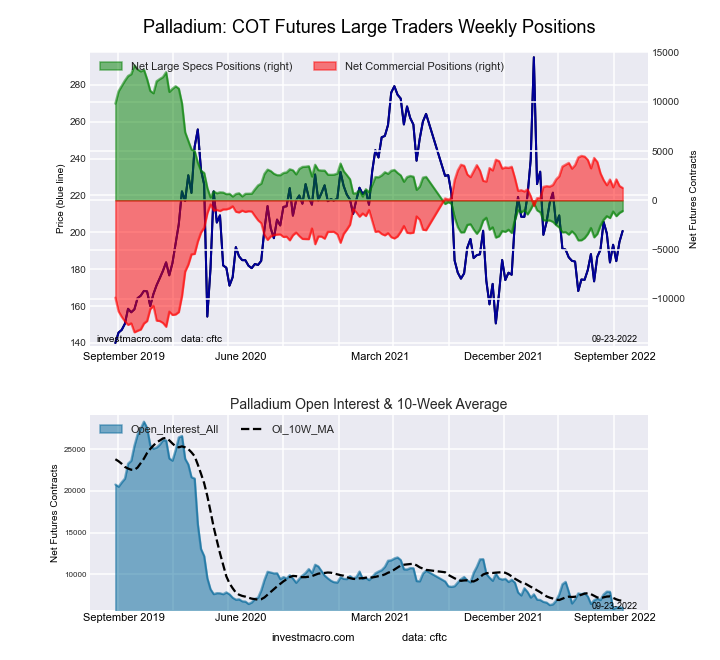
Palladium Futures COT ChartThe Palladium Futures large speculator standing this week came in at a net position of -1,081 contracts in the data reported through Tuesday. This was a weekly advance of 192 contracts from the previous week which had a total of -1,273 net contracts.

This week’s current strength score (the trader positioning range over the past three years, measured from 0 to 100) shows the speculators are currently Bearish-Extreme with a score of 16.8 percent. The commercials are Bullish-Extreme with a score of 81.8 percent and the small traders (not shown in chart) are Bearish with a score of 33.4 percent.

Palladium Futures StatisticsSPECULATORSCOMMERCIALSSMALL TRADERS
– Percent of Open Interest Longs:22.959.915.5
– Percent of Open Interest Shorts:40.938.918.5
– Net Position:-1,0811,261-180
– Gross Longs:1,3713,592930
– Gross Shorts:2,4522,3311,110
– Long to Short Ratio:0.6 to 11.5 to 10.8 to 1
NET POSITION TREND:
– Strength Index Score (3 Year Range Pct):16.881.833.4
– Strength Index Reading (3 Year Range):Bearish-ExtremeBullish-ExtremeBearish
NET POSITION MOVEMENT INDEX:
– 6-Week Change in Strength Index:5.0-4.4-6.1


Article By InvestMacroReceive our weekly COT Newsletter

*COT Report: The COT data, released weekly to the public each Friday, is updated through the most recent Tuesday (data is 3 days old) and shows a quick view of how large speculators or non-commercials (for-profit traders) were positioned in the futures markets.

The CFTC categorizes trader positions according to commercial hedgers (traders who use futures contracts for hedging as part of the business), non-commercials (large traders who speculate to realize trading profits) and nonreportable traders (usually small traders/speculators) as well as their open interest (contracts open in the market at time of reporting). See CFTC criteria here.

Eurodollar and 10-Year Bond Speculator bets rebounded before Fed Hikes

By InvestMacro

Here are the latest charts and statistics for the Commitment of Traders (COT) reports data published by the Commodities Futures Trading Commission (CFTC).

The latest COT data is updated through Tuesday September 20th and shows a quick view of how large traders (for-profit speculators and commercial hedgers) were positioned in the futures markets.

Eurodollar and 10-Year Bond bets rebound in Weekly Speculator Changes

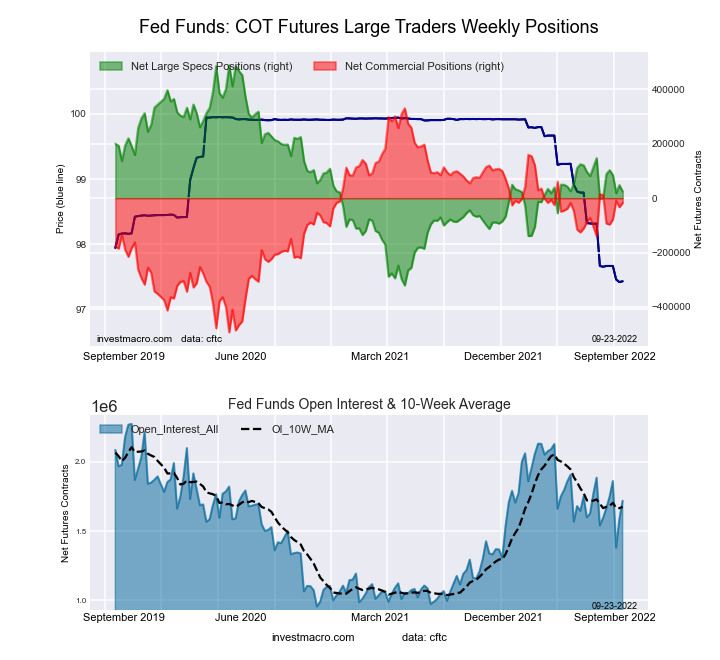
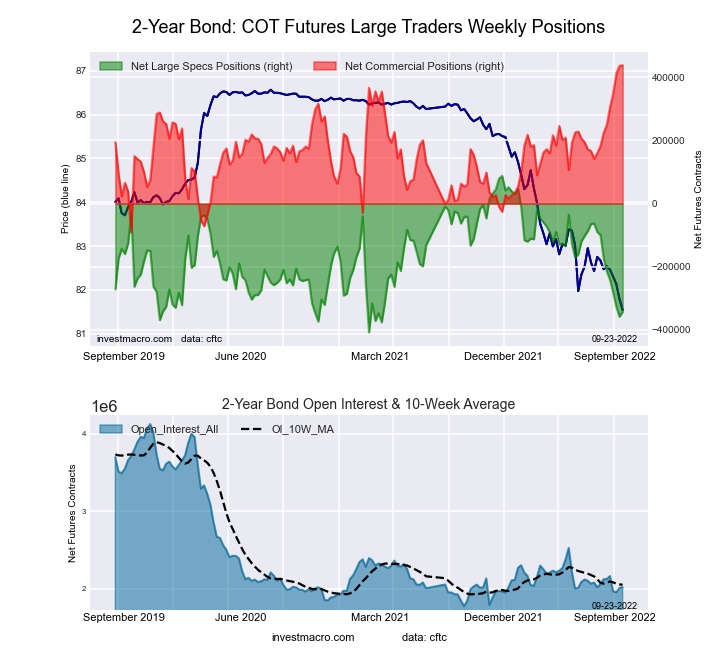
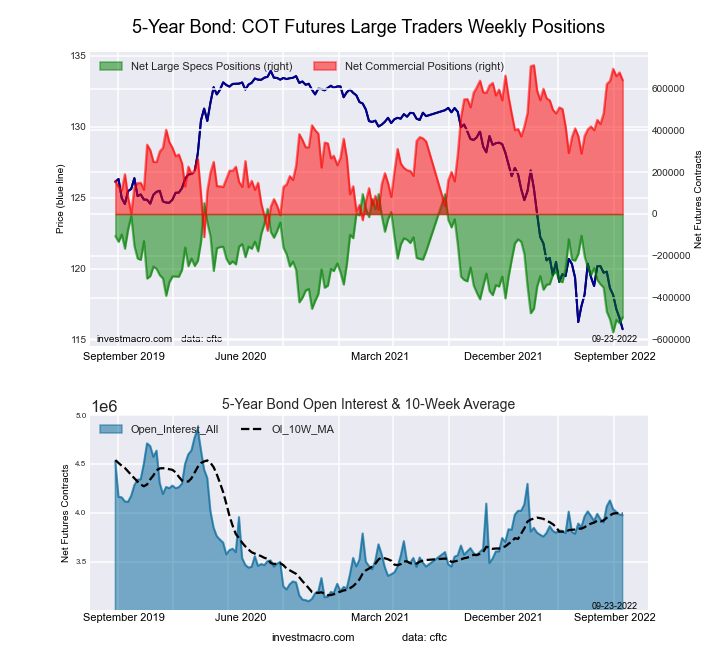
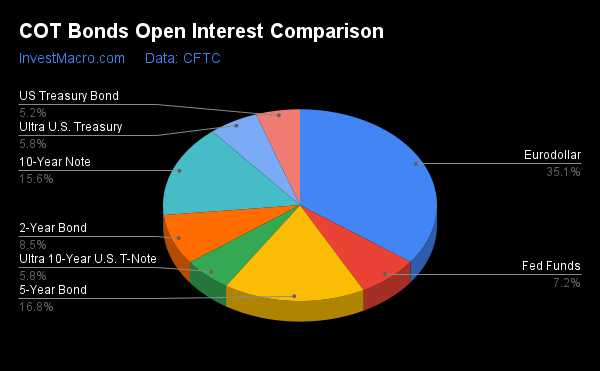
The COT bond market speculator bets were mixed this week as four out of the eight bond markets we cover had higher positioning this week while the other four markets had lower contracts.

Leading the gains for the bond markets was the Eurodollar (653,551 contracts) with the 10-Year Bond (123,299 contracts), the 5-Year Bond (27,655 contracts) and the 2-Year Bond (15,766 contracts) also showing positive weeks.

The bond markets leading the declines in speculator bets this week was the Fed Funds (-23,797 contracts) with the Ultra 10-Year (-22,022 contracts), the Ultra US Bond (-19,316 contracts) and the Long US Bond (-4,568 contracts) also registering lower bets on the week.

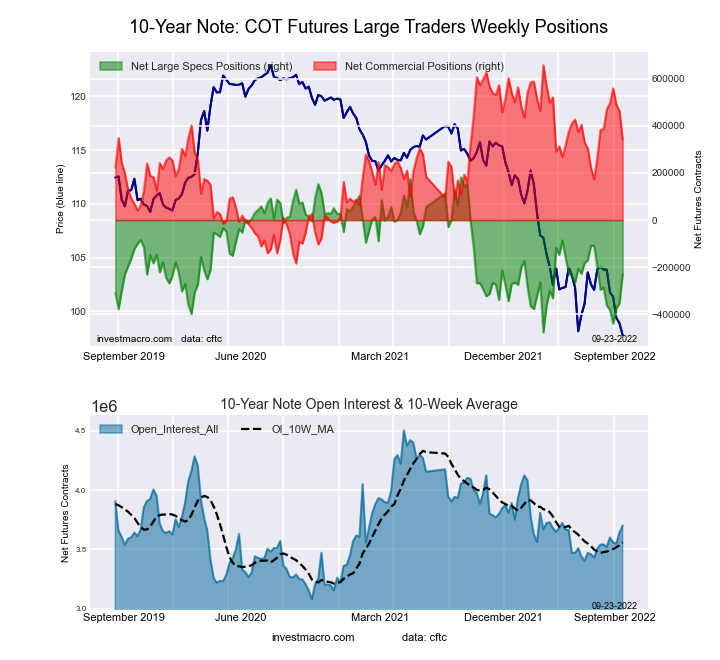
Highlighting the COT Bonds data this week was the rebound in both the Eurodollar and the 10-Year Bonds positioning. Both of these bond markets continue to have very bearish speculator positions and it has been that way since global central banks started to get more hawkish in raising their benchmark interest rates to fight inflation.

The Eurodollar turned from a bullish speculator position to bearish in May of 2021 while the 10-Year saw its speculative positioning flip bullish to bearish in October of 2021.

This week saw sharp gains for each of these markets with the Eurodollar jumping by a total of +653,551 net contracts and the 10-Year by +123,299 net contracts.

The bonds data was heavily influenced by the Federal Reserve’s interest rate decision coming out the next day that resulted in a 75 basis point hike. This likely prompted traders to take off positions that were deemed risky or to try and position for possible surprise outcomes of the Fed meeting.

The Eurodollar speculative change data for that Tuesday was the result of speculators sharply dropping their gross short positions by a total of -709,309 contracts. This is compared to a -55,758 contract decline in the gross long positions.

The 10-Year change, meanwhile, was the result of speculators raising their gross long positions by a total of +100,016 contracts in addition to reducing their gross short contracts by -23,283 to get the weekly net change of 123,299 contracts.


Data Snapshot of Bond Market Traders | Columns Legend
Sep-20-2022OIOI-IndexSpec-NetSpec-IndexCom-NetCOM-IndexSmalls-NetSmalls-Index
Eurodollar8,320,3650-2,223,771122,509,93186-286,16041
FedFunds1,719,1985824,16443-17,27358-6,89142
2-Year2,020,40211-342,41513438,181100-95,7669
Long T-Bond1,235,65251-99,5395278,9583920,58169
10-Year3,700,92944-229,59038342,34863-112,75853
5-Year3,974,32150-493,80411639,72891-145,92441


Strength Scores

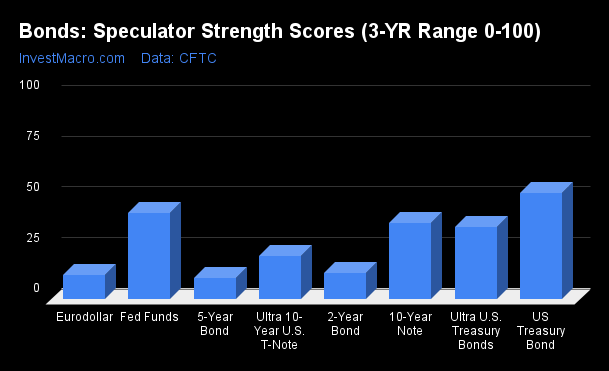
Strength Scores (a normalized measure of Speculator positions over a 3-Year range, from 0 to 100 where above 80 is extreme bullish and below 20 is extreme bearish) showed that the US Treasury Bond (52.2 percent) leads the bonds category and is the only market above the midpoint of its 3-year range. The Fed Funds (42.6 percent) comes in as the next highest bonds market in strength scores.

On the downside, the 5-Year Bond (10.8 percent), the Eurodollar (12.2 percent) and the 2-Year Bond (13.1 percent) come in at the lowest strength levels currently and are all in bearish extreme positions (below 20 percent).

Strength Statistics:
Fed Funds (42.6 percent) vs Fed Funds previous week (45.5 percent)
2-Year Bond (13.1 percent) vs 2-Year Bond previous week (9.9 percent)
5-Year Bond (10.8 percent) vs 5-Year Bond previous week (6.7 percent)
10-Year Bond (37.5 percent) vs 10-Year Bond previous week (18.8 percent)
Ultra 10-Year Bond (21.3 percent) vs Ultra 10-Year Bond previous week (27.0 percent)
US Treasury Bond (52.2 percent) vs US Treasury Bond previous week (53.7 percent)
Ultra US Treasury Bond (35.9 percent) vs Ultra US Treasury Bond previous week (43.8 percent)
Eurodollar (12.2 percent) vs Eurodollar previous week (0.2 percent)

Strength Trends

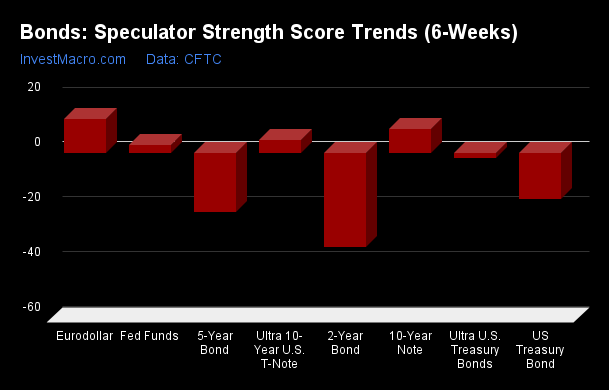
Strength Score Trends (or move index, calculates the 6-week changes in strength scores) show that the Eurodollar (12.2 percent) leads the past six weeks trends for bonds this week. The 10-Year Bond (8.6 percent), the Ultra 10-Year Bond (4.6 percent) and the Fed Funds (2.9 percent) fill out the rest of the positive movers in the latest trends data.

The 2-Year Bond (-34.4 percent) leads the downside trend scores currently while the next market with lower trend scores were the 5-Year Bond (-21.6 percent) followed by the US Treasury Bond (-16.9 percent).


Strength Trend Statistics:
Fed Funds (2.9 percent) vs Fed Funds previous week (6.3 percent)
2-Year Bond (-34.4 percent) vs 2-Year Bond previous week (-52.2 percent)
5-Year Bond (-21.6 percent) vs 5-Year Bond previous week (-28.1 percent)
10-Year Bond (8.6 percent) vs 10-Year Bond previous week (-8.7 percent)
Ultra 10-Year Bond (4.6 percent) vs Ultra 10-Year Bond previous week (7.7 percent)
US Treasury Bond (-16.9 percent) vs US Treasury Bond previous week (-12.7 percent)
Ultra US Treasury Bond (-1.9 percent) vs Ultra US Treasury Bond previous week (2.3 percent)
Eurodollar (12.2 percent) vs Eurodollar previous week (-1.7 percent)


Individual Markets:

3-Month Eurodollars Futures:

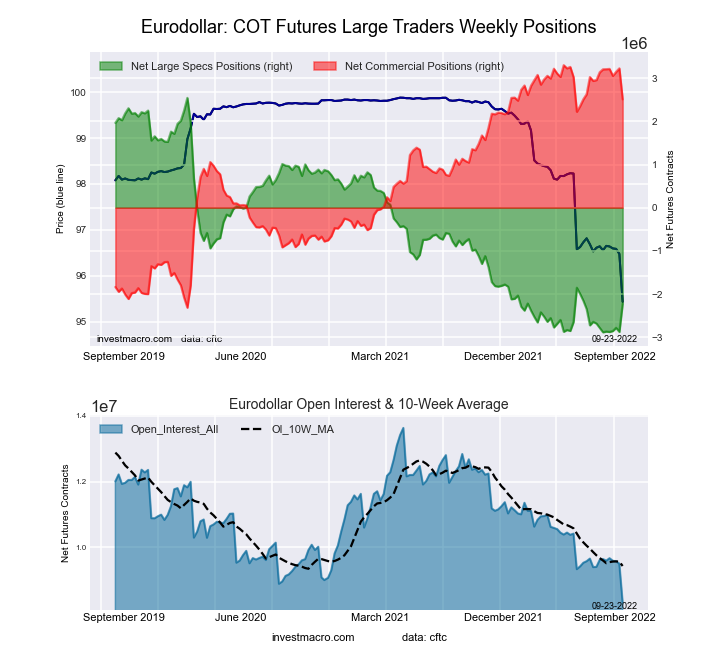
Eurodollar Bonds Futures COT ChartThe 3-Month Eurodollars large speculator standing this week recorded a net position of -2,223,771 contracts in the data reported through Tuesday. This was a weekly advance of 653,551 contracts from the previous week which had a total of -2,877,322 net contracts.

This week’s current strength score (the trader positioning range over the past three years, measured from 0 to 100) shows the speculators are currently Bearish-Extreme with a score of 12.2 percent. The commercials are Bullish-Extreme with a score of 85.9 percent and the small traders (not shown in chart) are Bearish with a score of 41.5 percent.

3-Month Eurodollars StatisticsSPECULATORSCOMMERCIALSSMALL TRADERS
– Percent of Open Interest Longs:6.769.44.8
– Percent of Open Interest Shorts:33.439.28.2
– Net Position:-2,223,7712,509,931-286,160
– Gross Longs:556,5375,772,986398,527
– Gross Shorts:2,780,3083,263,055684,687
– Long to Short Ratio:0.2 to 11.8 to 10.6 to 1
NET POSITION TREND:
– Strength Index Score (3 Year Range Pct):12.285.941.5
– Strength Index Reading (3 Year Range):Bearish-ExtremeBullish-ExtremeBearish
NET POSITION MOVEMENT INDEX:
– 6-Week Change in Strength Index:12.2-12.47.4


30-Day Federal Funds Futures:

Federal Funds 30-Day Bonds Futures COT ChartThe 30-Day Federal Funds large speculator standing this week recorded a net position of 24,164 contracts in the data reported through Tuesday. This was a weekly fall of -23,797 contracts from the previous week which had a total of 47,961 net contracts.

This week’s current strength score (the trader positioning range over the past three years, measured from 0 to 100) shows the speculators are currently Bearish with a score of 42.6 percent. The commercials are Bullish with a score of 57.8 percent and the small traders (not shown in chart) are Bearish with a score of 42.1 percent.

30-Day Federal Funds StatisticsSPECULATORSCOMMERCIALSSMALL TRADERS
– Percent of Open Interest Longs:12.771.72.3
– Percent of Open Interest Shorts:11.372.72.7
– Net Position:24,164-17,273-6,891
– Gross Longs:217,6311,232,60139,438
– Gross Shorts:193,4671,249,87446,329
– Long to Short Ratio:1.1 to 11.0 to 10.9 to 1
NET POSITION TREND:
– Strength Index Score (3 Year Range Pct):42.657.842.1
– Strength Index Reading (3 Year Range):BearishBullishBearish
NET POSITION MOVEMENT INDEX:
– 6-Week Change in Strength Index:2.9-3.513.7


2-Year Treasury Note Futures:

2-Year Treasury Bonds Futures COT ChartThe 2-Year Treasury Note large speculator standing this week recorded a net position of -342,415 contracts in the data reported through Tuesday. This was a weekly boost of 15,766 contracts from the previous week which had a total of -358,181 net contracts.

This week’s current strength score (the trader positioning range over the past three years, measured from 0 to 100) shows the speculators are currently Bearish-Extreme with a score of 13.1 percent. The commercials are Bullish-Extreme with a score of 100.0 percent and the small traders (not shown in chart) are Bearish-Extreme with a score of 8.7 percent.

2-Year Treasury Note StatisticsSPECULATORSCOMMERCIALSSMALL TRADERS
– Percent of Open Interest Longs:6.983.67.6
– Percent of Open Interest Shorts:23.861.912.4
– Net Position:-342,415438,181-95,766
– Gross Longs:139,3581,688,474154,106
– Gross Shorts:481,7731,250,293249,872
– Long to Short Ratio:0.3 to 11.4 to 10.6 to 1
NET POSITION TREND:
– Strength Index Score (3 Year Range Pct):13.1100.08.7
– Strength Index Reading (3 Year Range):Bearish-ExtremeBullish-ExtremeBearish-Extreme
NET POSITION MOVEMENT INDEX:
– 6-Week Change in Strength Index:-34.440.5-18.2


5-Year Treasury Note Futures:

5-Year Treasury Bonds Futures COT ChartThe 5-Year Treasury Note large speculator standing this week recorded a net position of -493,804 contracts in the data reported through Tuesday. This was a weekly rise of 27,655 contracts from the previous week which had a total of -521,459 net contracts.

This week’s current strength score (the trader positioning range over the past three years, measured from 0 to 100) shows the speculators are currently Bearish-Extreme with a score of 10.8 percent. The commercials are Bullish-Extreme with a score of 91.3 percent and the small traders (not shown in chart) are Bearish with a score of 40.9 percent.

5-Year Treasury Note StatisticsSPECULATORSCOMMERCIALSSMALL TRADERS
– Percent of Open Interest Longs:6.784.77.3
– Percent of Open Interest Shorts:19.168.611.0
– Net Position:-493,804639,728-145,924
– Gross Longs:266,4523,366,448291,033
– Gross Shorts:760,2562,726,720436,957
– Long to Short Ratio:0.4 to 11.2 to 10.7 to 1
NET POSITION TREND:
– Strength Index Score (3 Year Range Pct):10.891.340.9
– Strength Index Reading (3 Year Range):Bearish-ExtremeBullish-ExtremeBearish
NET POSITION MOVEMENT INDEX:
– 6-Week Change in Strength Index:-21.619.3-4.3


10-Year Treasury Note Futures:

10-Year Treasury Notes Bonds Futures COT ChartThe 10-Year Treasury Note large speculator standing this week recorded a net position of -229,590 contracts in the data reported through Tuesday. This was a weekly gain of 123,299 contracts from the previous week which had a total of -352,889 net contracts.

This week’s current strength score (the trader positioning range over the past three years, measured from 0 to 100) shows the speculators are currently Bearish with a score of 37.5 percent. The commercials are Bullish with a score of 62.6 percent and the small traders (not shown in chart) are Bullish with a score of 53.3 percent.

10-Year Treasury Note StatisticsSPECULATORSCOMMERCIALSSMALL TRADERS
– Percent of Open Interest Longs:10.777.59.0
– Percent of Open Interest Shorts:16.968.212.1
– Net Position:-229,590342,348-112,758
– Gross Longs:397,0502,868,123334,645
– Gross Shorts:626,6402,525,775447,403
– Long to Short Ratio:0.6 to 11.1 to 10.7 to 1
NET POSITION TREND:
– Strength Index Score (3 Year Range Pct):37.562.653.3
– Strength Index Reading (3 Year Range):BearishBullishBullish
NET POSITION MOVEMENT INDEX:
– 6-Week Change in Strength Index:8.6-5.2-3.1


Ultra 10-Year Notes Futures:

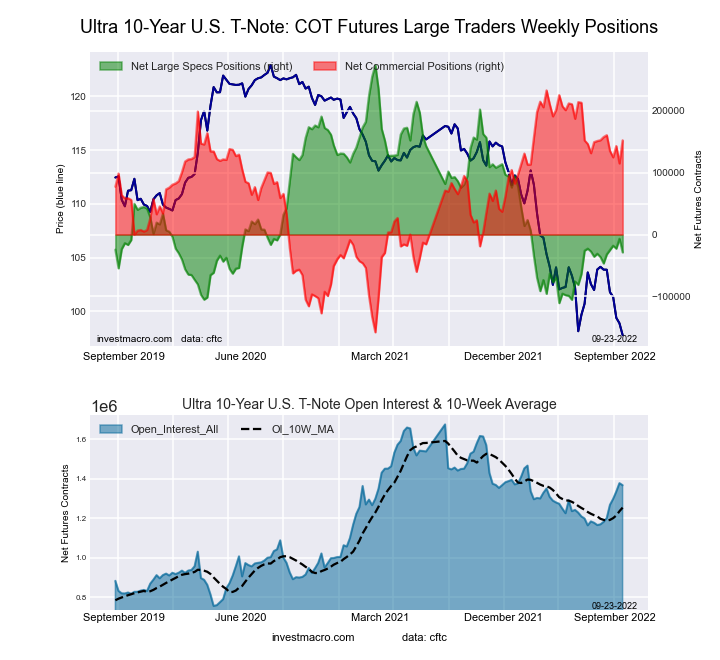
Ultra 10-Year Treasury Notes Bonds Futures COT ChartThe Ultra 10-Year Notes large speculator standing this week recorded a net position of -28,808 contracts in the data reported through Tuesday. This was a weekly reduction of -22,022 contracts from the previous week which had a total of -6,786 net contracts.

This week’s current strength score (the trader positioning range over the past three years, measured from 0 to 100) shows the speculators are currently Bearish with a score of 21.3 percent. The commercials are Bullish with a score of 79.4 percent and the small traders (not shown in chart) are Bearish with a score of 45.2 percent.

Ultra 10-Year Notes StatisticsSPECULATORSCOMMERCIALSSMALL TRADERS
– Percent of Open Interest Longs:8.381.19.0
– Percent of Open Interest Shorts:10.470.018.0
– Net Position:-28,808152,285-123,477
– Gross Longs:113,6571,109,324123,083
– Gross Shorts:142,465957,039246,560
– Long to Short Ratio:0.8 to 11.2 to 10.5 to 1
NET POSITION TREND:
– Strength Index Score (3 Year Range Pct):21.379.445.2
– Strength Index Reading (3 Year Range):BearishBullishBearish
NET POSITION MOVEMENT INDEX:
– 6-Week Change in Strength Index:4.6-1.3-8.3


US Treasury Bonds Futures:

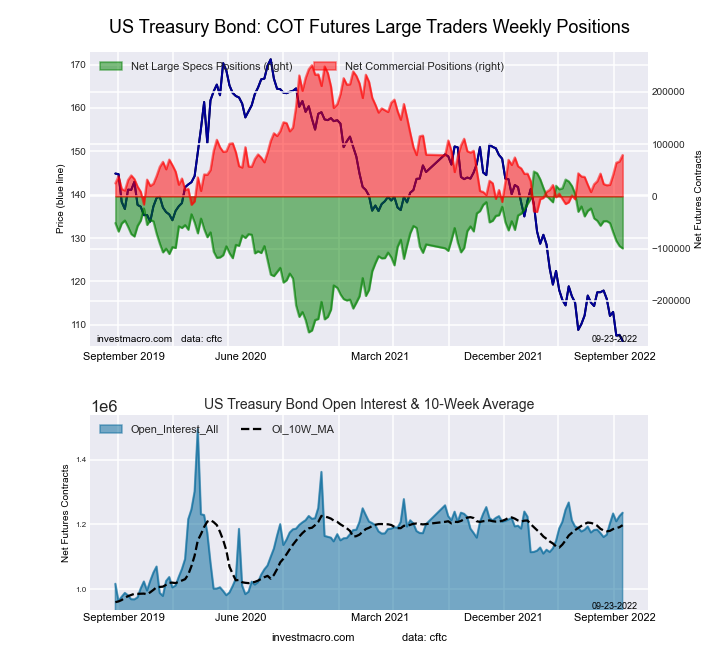
US Year Treasury Notes Long Bonds Futures COT ChartThe US Treasury Bonds large speculator standing this week recorded a net position of -99,539 contracts in the data reported through Tuesday. This was a weekly fall of -4,568 contracts from the previous week which had a total of -94,971 net contracts.

This week’s current strength score (the trader positioning range over the past three years, measured from 0 to 100) shows the speculators are currently Bullish with a score of 52.2 percent. The commercials are Bearish with a score of 38.8 percent and the small traders (not shown in chart) are Bullish with a score of 68.9 percent.

US Treasury Bonds StatisticsSPECULATORSCOMMERCIALSSMALL TRADERS
– Percent of Open Interest Longs:6.277.113.8
– Percent of Open Interest Shorts:14.270.712.2
– Net Position:-99,53978,95820,581
– Gross Longs:76,399952,947170,936
– Gross Shorts:175,938873,989150,355
– Long to Short Ratio:0.4 to 11.1 to 11.1 to 1
NET POSITION TREND:
– Strength Index Score (3 Year Range Pct):52.238.868.9
– Strength Index Reading (3 Year Range):BullishBearishBullish
NET POSITION MOVEMENT INDEX:
– 6-Week Change in Strength Index:-16.919.8-2.9


Ultra US Treasury Bonds Futures:

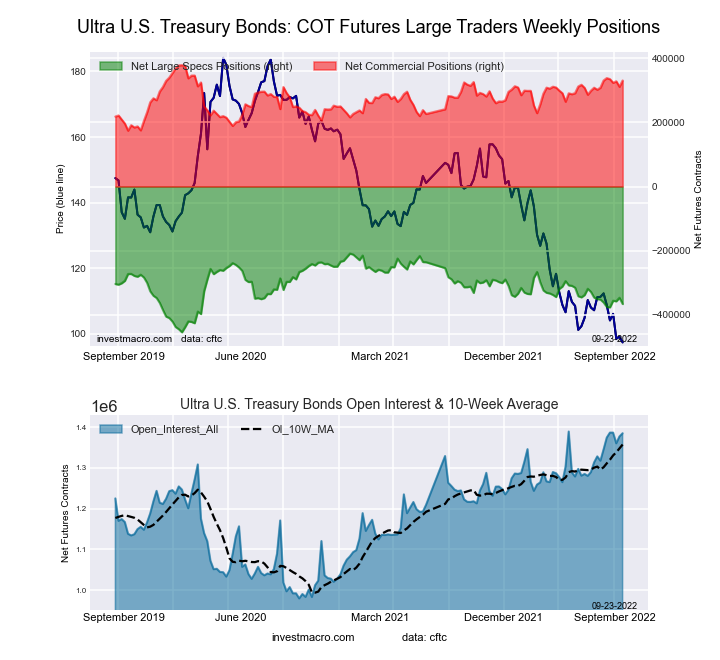
Ultra US Year Treasury Notes Long Bonds Futures COT ChartThe Ultra US Treasury Bonds large speculator standing this week recorded a net position of -365,913 contracts in the data reported through Tuesday. This was a weekly fall of -19,316 contracts from the previous week which had a total of -346,597 net contracts.

This week’s current strength score (the trader positioning range over the past three years, measured from 0 to 100) shows the speculators are currently Bearish with a score of 35.9 percent. The commercials are Bullish with a score of 76.5 percent and the small traders (not shown in chart) are Bullish with a score of 54.0 percent.

Ultra US Treasury Bonds StatisticsSPECULATORSCOMMERCIALSSMALL TRADERS
– Percent of Open Interest Longs:5.183.210.7
– Percent of Open Interest Shorts:31.659.48.1
– Net Position:-365,913330,14335,770
– Gross Longs:71,3061,152,370147,949
– Gross Shorts:437,219822,227112,179
– Long to Short Ratio:0.2 to 11.4 to 11.3 to 1
NET POSITION TREND:
– Strength Index Score (3 Year Range Pct):35.976.554.0
– Strength Index Reading (3 Year Range):BearishBullishBullish
NET POSITION MOVEMENT INDEX:
– 6-Week Change in Strength Index:-1.90.03.3


Article By InvestMacroReceive our weekly COT Newsletter

*COT Report: The COT data, released weekly to the public each Friday, is updated through the most recent Tuesday (data is 3 days old) and shows a quick view of how large speculators or non-commercials (for-profit traders) were positioned in the futures markets.

The CFTC categorizes trader positions according to commercial hedgers (traders who use futures contracts for hedging as part of the business), non-commercials (large traders who speculate to realize trading profits) and nonreportable traders (usually small traders/speculators) as well as their open interest (contracts open in the market at time of reporting). See CFTC criteria here.

Soybean Meal Bullish Speculator bets leads weekly COT Soft Commodities changes

By InvestMacro

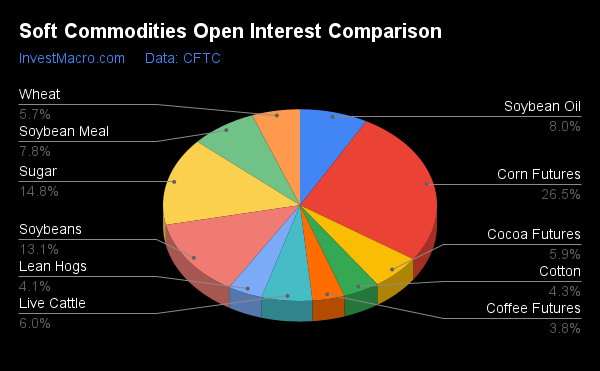
Soft Commodities Open Interest Comparison

Here are the latest charts and statistics for the Commitment of Traders (COT) reports data published by the Commodities Futures Trading Commission (CFTC).

The latest COT data is updated through Tuesday September 20th and shows a quick view of how large traders (for-profit speculators and commercial entities) were positioned in the futures markets.

Soybean Meal leads positive Weekly Speculator Changes while Sugar see weekly drop

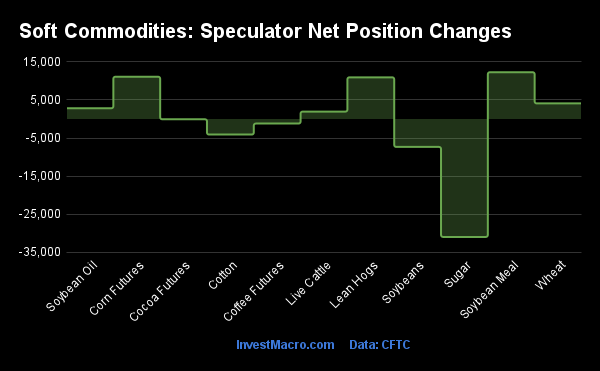
Soft Commodities Speculator Net Position Changes

The COT soft commodities speculator bets were slightly higher this week as six out of the eleven soft commodities markets we cover had higher positioning this week while the other five markets had decreases in contracts.

Leading the gains for soft commodities markets was Soybean Meal (12,293 contracts) with Corn (11,108 contracts), Lean Hogs (10,953 contracts), Wheat (4,099 contracts), Soybean Oil (2,830 contracts) and Live Cattle (1,947 contracts) also showing positive weeks.

The softs markets leading the declines in speculator bets this week was Sugar (-30,985 contracts) with Soybeans (-7,337 contracts), Cotton (-4,086 contracts), Coffee (-1,195 contracts) and Cocoa (-67 contracts) also registering lower bets on the week.

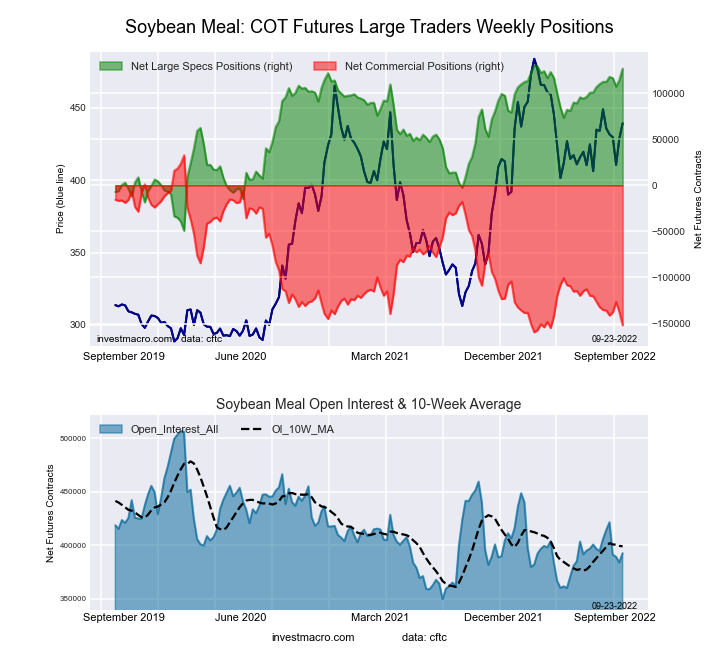
Highlighting the COT Soft Commodities data is the gains in Soybean Meal speculator bets. Speculative net positions rose for a second straight week and for the ninth time out of the past twelve weeks. This recent bullishness has pushed Soybean Meal net positions to the highest level of the past 26 weeks, dating back to March 22nd of this year. The speculator positioning for this market currently represents the highest strength score among all the futures markets (50+ markets) we cover with a 97.9 percent score and an extreme bullish reading.


Data Snapshot of Commodity Market Traders | Columns Legend
Sep-20-2022OIOI-IndexSpec-NetSpec-IndexCom-NetCOM-IndexSmalls-NetSmalls-Index
WTI Crude1,481,5451239,8788-261,5689421,69036
Gold469,395565,7220-75,4281009,7060
Silver132,1070-1,64012-5,629907,2694
Copper163,0584-20,2862223,21582-2,9298
Palladium5,9931-1,081171,26182-18033
Platinum62,900272,39012-5,496893,1065
Natural Gas960,2361-155,71132121,3086934,40362
Brent164,02511-37,9034836,732541,17125
Heating Oil292,6343214,09763-25,9414411,84439
Soybeans656,3101884,77339-55,48570-29,28822
Corn1,330,8419305,67769-241,23838-64,4396
Coffee191,433541,07274-42,998301,92617
Sugar744,972837,34544-35,86061-1,4856
Wheat285,5670-4,029149,98274-5,95380


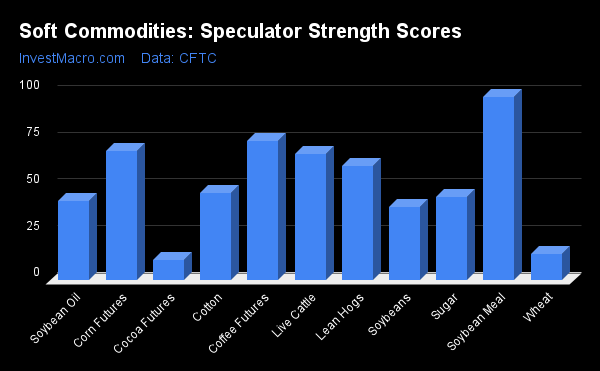
Strength Scores

Strength Scores (a normalized measure of Speculator positions over a 3-Year range, from 0 to 100 where above 80 is extreme bullish and below 20 is extreme bearish) showed that Soybean Meal (97.9 percent) leads the soft commodity markets and is in a bullish extreme position (above 80 percent). Coffee (74.3 percent), Corn (69.1 percent) and Live Cattle (67.6 percent) come in as the next highest soft commodity markets in strength scores.

On the downside, Cocoa (11.0 percent) and Wheat (13.8 percent) come in at the lowest strength levels currently and are in bearish extreme positions (below 20 percent).

Soft Commodities Speculator Strength Scores
Strength Statistics:
Corn (69.1 percent) vs Corn previous week (67.7 percent)
Sugar (44.3 percent) vs Sugar previous week (50.7 percent)
Coffee (74.3 percent) vs Coffee previous week (75.4 percent)
Soybeans (39.4 percent) vs Soybeans previous week (41.7 percent)
Soybean Oil (42.4 percent) vs Soybean Oil previous week (40.4 percent)
Soybean Meal (97.9 percent) vs Soybean Meal previous week (91.0 percent)
Live Cattle (67.6 percent) vs Live Cattle previous week (65.2 percent)
Lean Hogs (61.3 percent) vs Lean Hogs previous week (49.4 percent)
Cotton (46.5 percent) vs Cotton previous week (49.3 percent)
Cocoa (11.0 percent) vs Cocoa previous week (11.0 percent)
Wheat (13.8 percent) vs Wheat previous week (8.5 percent)

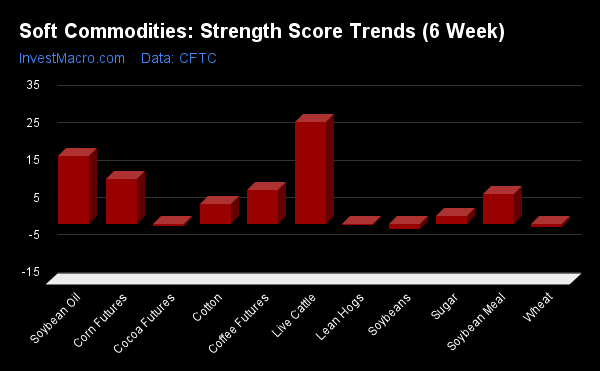
Strength Trends

Strength Score Trends (or move index, calculates the 6-week changes in strength scores) show that Live Cattle (27.3 percent) and Soybean Oil (18.2 percent) sentiment have led the positive moves  over the past six weeks. Corn (12.1 percent), Coffee (9.2 percent) and Soybean Meal (8.0 percent) fill out the next top movers in the latest trends data.

Soybeans (-1.3 percent) lead the downside trend scores currently with the next markets with lower trend scores being Wheat (-0.8 percent), Cocoa (-0.4 percent) and Lean Hogs (-0.1 percent).

Soft Commodities Strength Score Trends (6 Week)
Strength Trend Statistics:
Corn (12.1 percent) vs Corn previous week (11.9 percent)
Sugar (2.3 percent) vs Sugar previous week (7.0 percent)
Coffee (9.2 percent) vs Coffee previous week (13.0 percent)
Soybeans (-1.3 percent) vs Soybeans previous week (-0.1 percent)
Soybean Oil (18.2 percent) vs Soybean Oil previous week (16.6 percent)
Soybean Meal (8.0 percent) vs Soybean Meal previous week (2.5 percent)
Live Cattle (27.3 percent) vs Live Cattle previous week (39.5 percent)
Lean Hogs (-0.1 percent) vs Lean Hogs previous week (-0.6 percent)
Cotton (5.3 percent) vs Cotton previous week (7.5 percent)
Cocoa (-0.4 percent) vs Cocoa previous week (-3.9 percent)
Wheat (-0.8 percent) vs Wheat previous week (-9.6 percent)


Individual Markets:

CORN Futures:

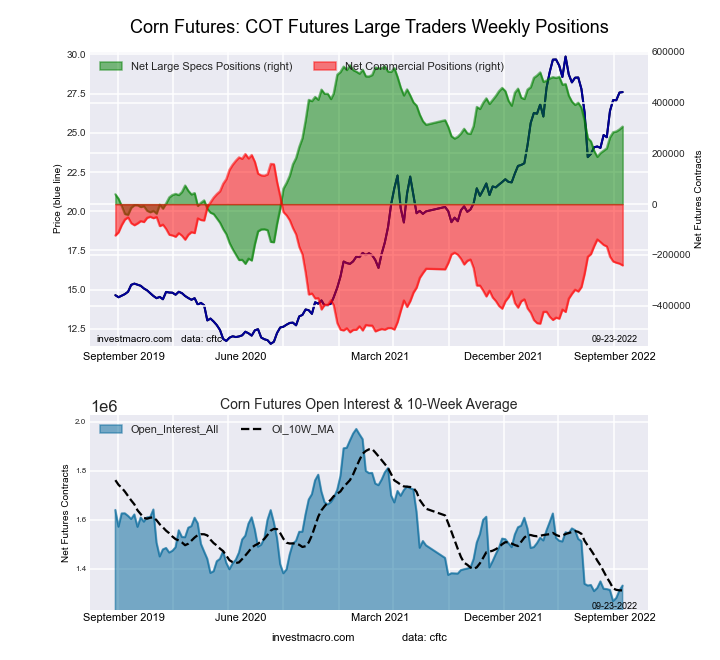
CORN Futures COT ChartThe CORN large speculator standing this week reached a net position of 305,677 contracts in the data reported through Tuesday. This was a weekly gain of 11,108 contracts from the previous week which had a total of 294,569 net contracts.

This week’s current strength score (the trader positioning range over the past three years, measured from 0 to 100) shows the speculators are currently Bullish with a score of 69.1 percent. The commercials are Bearish with a score of 37.5 percent and the small traders (not shown in chart) are Bearish-Extreme with a score of 6.0 percent.

CORN Futures StatisticsSPECULATORSCOMMERCIALSSMALL TRADERS
– Percent of Open Interest Longs:32.544.48.7
– Percent of Open Interest Shorts:9.662.613.6
– Net Position:305,677-241,238-64,439
– Gross Longs:432,909591,425116,001
– Gross Shorts:127,232832,663180,440
– Long to Short Ratio:3.4 to 10.7 to 10.6 to 1
NET POSITION TREND:
– Strength Index Score (3 Year Range Pct):69.137.56.0
– Strength Index Reading (3 Year Range):BullishBearishBearish-Extreme
NET POSITION MOVEMENT INDEX:
– 6-Week Change in Strength Index:12.1-11.5-8.3


SUGAR Futures:

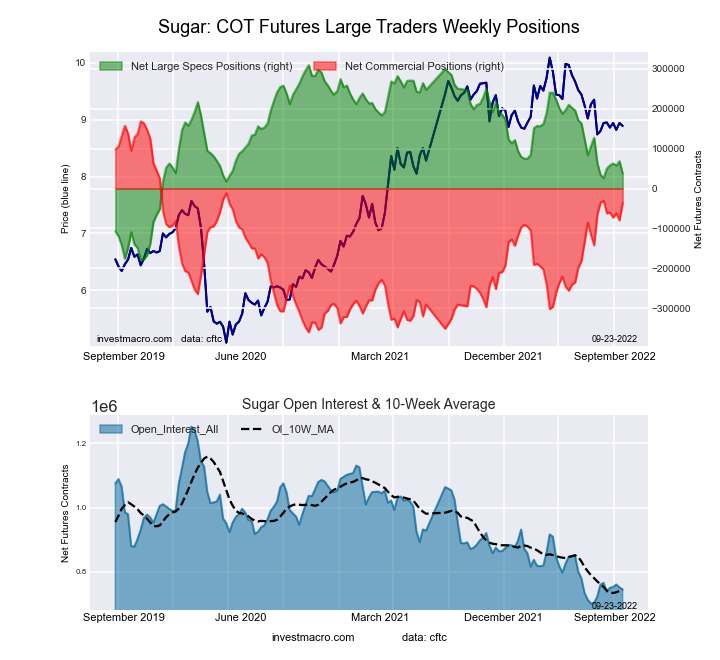
SUGAR Futures COT ChartThe SUGAR large speculator standing this week reached a net position of 37,345 contracts in the data reported through Tuesday. This was a weekly fall of -30,985 contracts from the previous week which had a total of 68,330 net contracts.

This week’s current strength score (the trader positioning range over the past three years, measured from 0 to 100) shows the speculators are currently Bearish with a score of 44.3 percent. The commercials are Bullish with a score of 61.3 percent and the small traders (not shown in chart) are Bearish-Extreme with a score of 6.0 percent.

SUGAR Futures StatisticsSPECULATORSCOMMERCIALSSMALL TRADERS
– Percent of Open Interest Longs:22.057.08.7
– Percent of Open Interest Shorts:17.061.88.9
– Net Position:37,345-35,860-1,485
– Gross Longs:164,043424,44364,709
– Gross Shorts:126,698460,30366,194
– Long to Short Ratio:1.3 to 10.9 to 11.0 to 1
NET POSITION TREND:
– Strength Index Score (3 Year Range Pct):44.361.36.0
– Strength Index Reading (3 Year Range):BearishBullishBearish-Extreme
NET POSITION MOVEMENT INDEX:
– 6-Week Change in Strength Index:2.3-1.0-7.5


COFFEE Futures:

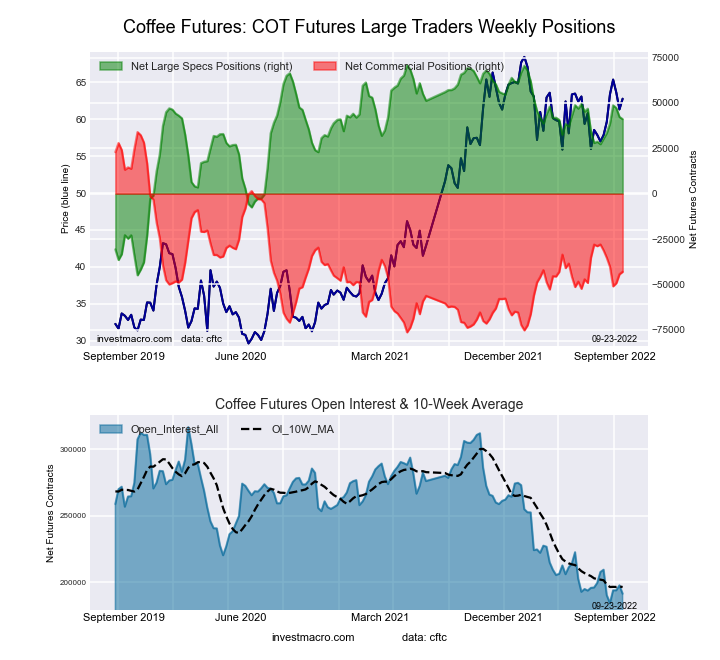
COFFEE Futures COT ChartThe COFFEE large speculator standing this week reached a net position of 41,072 contracts in the data reported through Tuesday. This was a weekly decline of -1,195 contracts from the previous week which had a total of 42,267 net contracts.

This week’s current strength score (the trader positioning range over the past three years, measured from 0 to 100) shows the speculators are currently Bullish with a score of 74.3 percent. The commercials are Bearish with a score of 30.2 percent and the small traders (not shown in chart) are Bearish-Extreme with a score of 17.2 percent.

COFFEE Futures StatisticsSPECULATORSCOMMERCIALSSMALL TRADERS
– Percent of Open Interest Longs:27.447.44.7
– Percent of Open Interest Shorts:5.969.93.7
– Net Position:41,072-42,9981,926
– Gross Longs:52,37790,7269,048
– Gross Shorts:11,305133,7247,122
– Long to Short Ratio:4.6 to 10.7 to 11.3 to 1
NET POSITION TREND:
– Strength Index Score (3 Year Range Pct):74.330.217.2
– Strength Index Reading (3 Year Range):BullishBearishBearish-Extreme
NET POSITION MOVEMENT INDEX:
– 6-Week Change in Strength Index:9.2-10.610.2


SOYBEANS Futures:

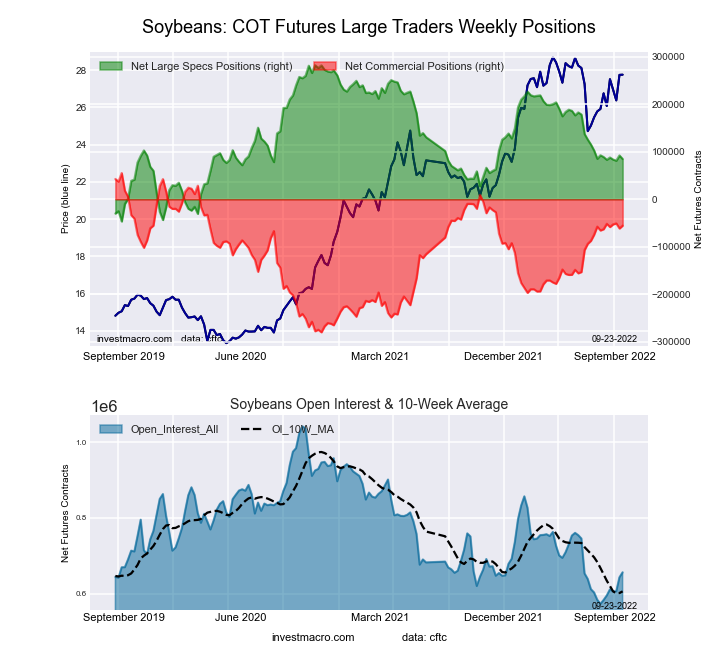
SOYBEANS Futures COT ChartThe SOYBEANS large speculator standing this week reached a net position of 84,773 contracts in the data reported through Tuesday. This was a weekly reduction of -7,337 contracts from the previous week which had a total of 92,110 net contracts.

This week’s current strength score (the trader positioning range over the past three years, measured from 0 to 100) shows the speculators are currently Bearish with a score of 39.4 percent. The commercials are Bullish with a score of 69.6 percent and the small traders (not shown in chart) are Bearish with a score of 21.5 percent.

SOYBEANS Futures StatisticsSPECULATORSCOMMERCIALSSMALL TRADERS
– Percent of Open Interest Longs:24.354.66.2
– Percent of Open Interest Shorts:11.463.010.7
– Net Position:84,773-55,485-29,288
– Gross Longs:159,789358,17240,819
– Gross Shorts:75,016413,65770,107
– Long to Short Ratio:2.1 to 10.9 to 10.6 to 1
NET POSITION TREND:
– Strength Index Score (3 Year Range Pct):39.469.621.5
– Strength Index Reading (3 Year Range):BearishBullishBearish
NET POSITION MOVEMENT INDEX:
– 6-Week Change in Strength Index:-1.32.3-5.7


SOYBEAN OIL Futures:

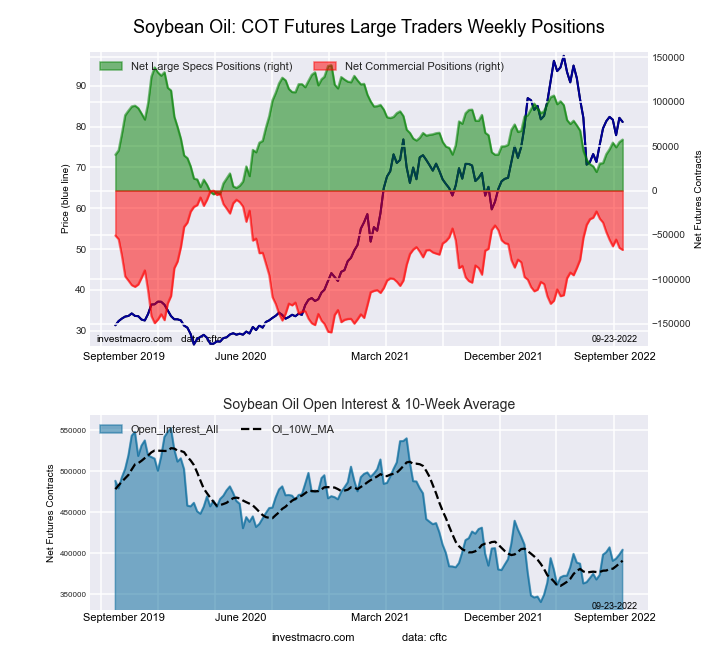
SOYBEAN OIL Futures COT ChartThe SOYBEAN OIL large speculator standing this week reached a net position of 57,411 contracts in the data reported through Tuesday. This was a weekly rise of 2,830 contracts from the previous week which had a total of 54,581 net contracts.

This week’s current strength score (the trader positioning range over the past three years, measured from 0 to 100) shows the speculators are currently Bearish with a score of 42.4 percent. The commercials are Bullish with a score of 58.2 percent and the small traders (not shown in chart) are Bearish with a score of 48.3 percent.

SOYBEAN OIL Futures StatisticsSPECULATORSCOMMERCIALSSMALL TRADERS
– Percent of Open Interest Longs:22.150.37.9
– Percent of Open Interest Shorts:7.966.85.6
– Net Position:57,411-66,7409,329
– Gross Longs:89,528203,40331,920
– Gross Shorts:32,117270,14322,591
– Long to Short Ratio:2.8 to 10.8 to 11.4 to 1
NET POSITION TREND:
– Strength Index Score (3 Year Range Pct):42.458.248.3
– Strength Index Reading (3 Year Range):BearishBullishBearish
NET POSITION MOVEMENT INDEX:
– 6-Week Change in Strength Index:18.2-19.316.3


SOYBEAN MEAL Futures:

SOYBEAN MEAL Futures COT ChartThe SOYBEAN MEAL large speculator standing this week reached a net position of 126,470 contracts in the data reported through Tuesday. This was a weekly rise of 12,293 contracts from the previous week which had a total of 114,177 net contracts.

This week’s current strength score (the trader positioning range over the past three years, measured from 0 to 100) shows the speculators are currently Bullish-Extreme with a score of 97.9 percent. The commercials are Bearish-Extreme with a score of 4.0 percent and the small traders (not shown in chart) are Bullish with a score of 64.4 percent.

SOYBEAN MEAL Futures StatisticsSPECULATORSCOMMERCIALSSMALL TRADERS
– Percent of Open Interest Longs:35.239.912.9
– Percent of Open Interest Shorts:3.078.66.4
– Net Position:126,470-151,85425,384
– Gross Longs:138,080156,67750,445
– Gross Shorts:11,610308,53125,061
– Long to Short Ratio:11.9 to 10.5 to 12.0 to 1
NET POSITION TREND:
– Strength Index Score (3 Year Range Pct):97.94.064.4
– Strength Index Reading (3 Year Range):Bullish-ExtremeBearish-ExtremeBullish
NET POSITION MOVEMENT INDEX:
– 6-Week Change in Strength Index:8.0-8.712.2


LIVE CATTLE Futures:

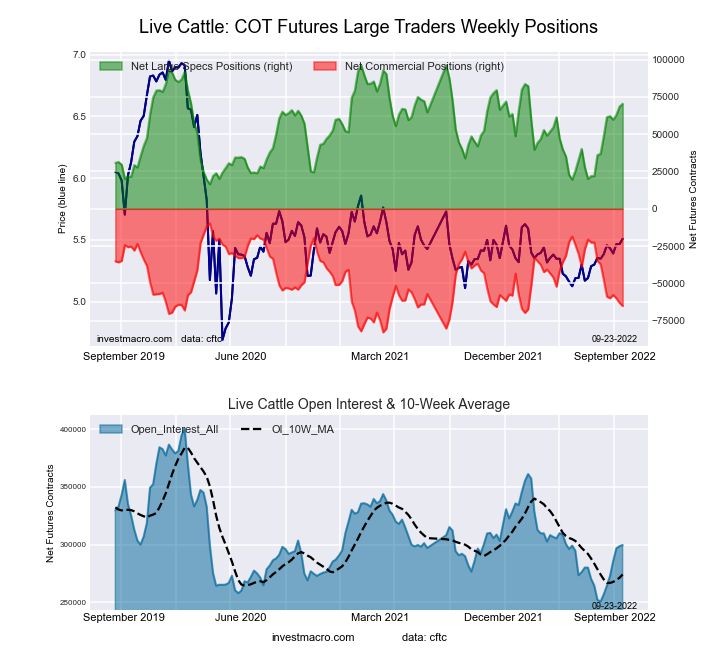
LIVE CATTLE Futures COT ChartThe LIVE CATTLE large speculator standing this week reached a net position of 70,367 contracts in the data reported through Tuesday. This was a weekly rise of 1,947 contracts from the previous week which had a total of 68,420 net contracts.

This week’s current strength score (the trader positioning range over the past three years, measured from 0 to 100) shows the speculators are currently Bullish with a score of 67.6 percent. The commercials are Bearish with a score of 24.2 percent and the small traders (not shown in chart) are Bullish with a score of 75.4 percent.

LIVE CATTLE Futures StatisticsSPECULATORSCOMMERCIALSSMALL TRADERS
– Percent of Open Interest Longs:40.232.410.9
– Percent of Open Interest Shorts:16.754.112.7
– Net Position:70,367-65,032-5,335
– Gross Longs:120,43296,99832,801
– Gross Shorts:50,065162,03038,136
– Long to Short Ratio:2.4 to 10.6 to 10.9 to 1
NET POSITION TREND:
– Strength Index Score (3 Year Range Pct):67.624.275.4
– Strength Index Reading (3 Year Range):BullishBearishBullish
NET POSITION MOVEMENT INDEX:
– 6-Week Change in Strength Index:27.3-24.1-17.4


LEAN HOGS Futures:

LEAN HOGS Futures COT ChartThe LEAN HOGS large speculator standing this week reached a net position of 50,115 contracts in the data reported through Tuesday. This was a weekly lift of 10,953 contracts from the previous week which had a total of 39,162 net contracts.

This week’s current strength score (the trader positioning range over the past three years, measured from 0 to 100) shows the speculators are currently Bullish with a score of 61.3 percent. The commercials are Bearish with a score of 44.4 percent and the small traders (not shown in chart) are Bullish with a score of 52.2 percent.

LEAN HOGS Futures StatisticsSPECULATORSCOMMERCIALSSMALL TRADERS
– Percent of Open Interest Longs:42.834.39.2
– Percent of Open Interest Shorts:18.854.313.3
– Net Position:50,115-41,565-8,550
– Gross Longs:89,17871,38519,095
– Gross Shorts:39,063112,95027,645
– Long to Short Ratio:2.3 to 10.6 to 10.7 to 1
NET POSITION TREND:
– Strength Index Score (3 Year Range Pct):61.344.452.2
– Strength Index Reading (3 Year Range):BullishBearishBullish
NET POSITION MOVEMENT INDEX:
– 6-Week Change in Strength Index:-0.12.8-11.7


COTTON Futures:

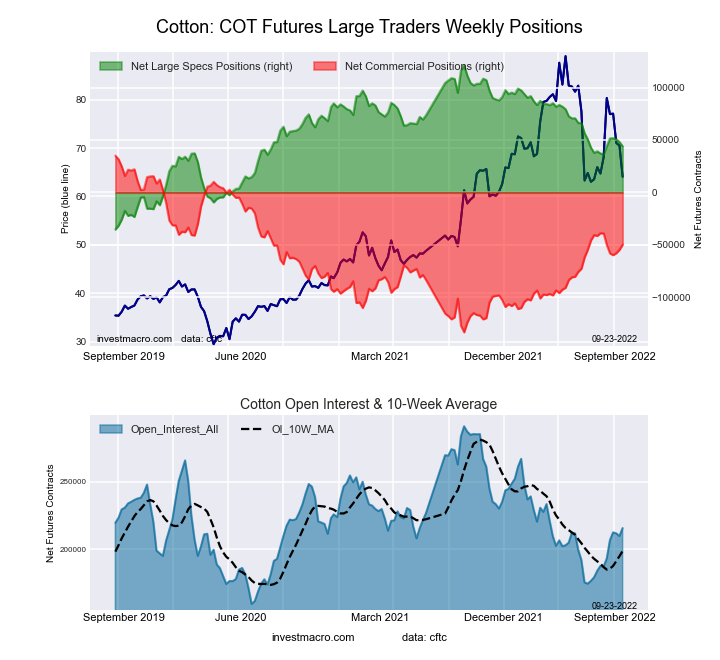
COTTON Futures COT ChartThe COTTON large speculator standing this week reached a net position of 43,954 contracts in the data reported through Tuesday. This was a weekly decline of -4,086 contracts from the previous week which had a total of 48,040 net contracts.

This week’s current strength score (the trader positioning range over the past three years, measured from 0 to 100) shows the speculators are currently Bearish with a score of 46.5 percent. The commercials are Bullish with a score of 53.8 percent and the small traders (not shown in chart) are Bearish with a score of 47.6 percent.

COTTON Futures StatisticsSPECULATORSCOMMERCIALSSMALL TRADERS
– Percent of Open Interest Longs:33.147.56.8
– Percent of Open Interest Shorts:12.770.54.1
– Net Position:43,954-49,7135,759
– Gross Longs:71,269102,27614,638
– Gross Shorts:27,315151,9898,879
– Long to Short Ratio:2.6 to 10.7 to 11.6 to 1
NET POSITION TREND:
– Strength Index Score (3 Year Range Pct):46.553.847.6
– Strength Index Reading (3 Year Range):BearishBullishBearish
NET POSITION MOVEMENT INDEX:
– 6-Week Change in Strength Index:5.3-6.919.3


COCOA Futures:

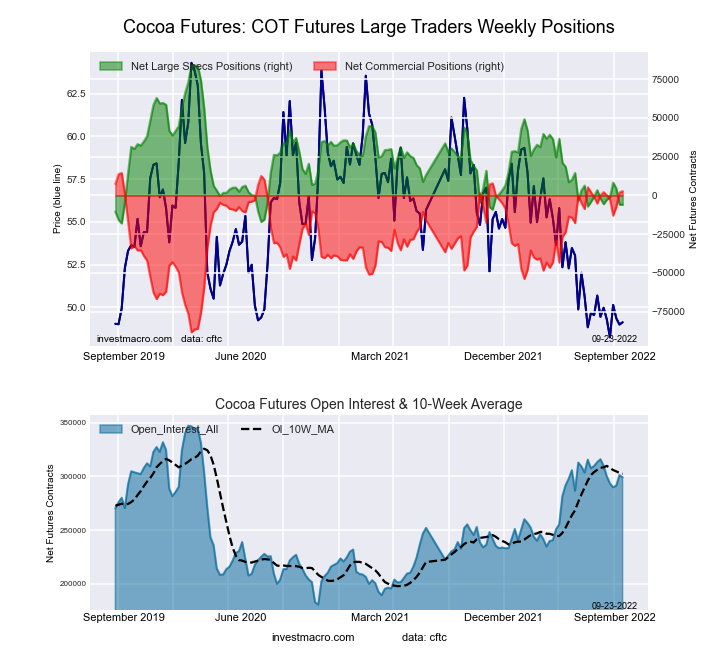
COCOA Futures COT ChartThe COCOA large speculator standing this week reached a net position of -5,941 contracts in the data reported through Tuesday. This was a weekly decrease of -67 contracts from the previous week which had a total of -5,874 net contracts.

This week’s current strength score (the trader positioning range over the past three years, measured from 0 to 100) shows the speculators are currently Bearish-Extreme with a score of 11.0 percent. The commercials are Bullish-Extreme with a score of 90.3 percent and the small traders (not shown in chart) are Bearish with a score of 28.1 percent.

COCOA Futures StatisticsSPECULATORSCOMMERCIALSSMALL TRADERS
– Percent of Open Interest Longs:32.746.34.6
– Percent of Open Interest Shorts:34.745.43.5
– Net Position:-5,9412,7793,162
– Gross Longs:97,755138,57213,754
– Gross Shorts:103,696135,79310,592
– Long to Short Ratio:0.9 to 11.0 to 11.3 to 1
NET POSITION TREND:
– Strength Index Score (3 Year Range Pct):11.090.328.1
– Strength Index Reading (3 Year Range):Bearish-ExtremeBullish-ExtremeBearish
NET POSITION MOVEMENT INDEX:
– 6-Week Change in Strength Index:-0.40.6-2.5


WHEAT Futures:

WHEAT Futures COT ChartThe WHEAT large speculator standing this week reached a net position of -4,029 contracts in the data reported through Tuesday. This was a weekly gain of 4,099 contracts from the previous week which had a total of -8,128 net contracts.

This week’s current strength score (the trader positioning range over the past three years, measured from 0 to 100) shows the speculators are currently Bearish-Extreme with a score of 13.8 percent. The commercials are Bullish with a score of 73.9 percent and the small traders (not shown in chart) are Bullish with a score of 79.5 percent.

WHEAT Futures StatisticsSPECULATORSCOMMERCIALSSMALL TRADERS
– Percent of Open Interest Longs:31.039.69.9
– Percent of Open Interest Shorts:32.536.112.0
– Net Position:-4,0299,982-5,953
– Gross Longs:88,644113,05528,213
– Gross Shorts:92,673103,07334,166
– Long to Short Ratio:1.0 to 11.1 to 10.8 to 1
NET POSITION TREND:
– Strength Index Score (3 Year Range Pct):13.873.979.5
– Strength Index Reading (3 Year Range):Bearish-ExtremeBullishBullish
NET POSITION MOVEMENT INDEX:
– 6-Week Change in Strength Index:-0.80.12.9


Article By InvestMacroReceive our weekly COT Newsletter

*COT Report: The COT data, released weekly to the public each Friday, is updated through the most recent Tuesday (data is 3 days old) and shows a quick view of how large speculators or non-commercials (for-profit traders) were positioned in the futures markets.

The CFTC categorizes trader positions according to commercial hedgers (traders who use futures contracts for hedging as part of the business), non-commercials (large traders who speculate to realize trading profits) and nonreportable traders (usually small traders/speculators) as well as their open interest (contracts open in the market at time of reporting). See CFTC criteria here.
S&P500 Mini Futures led the Stock Market Speculator Bets before Fed Rate hike

By InvestMacro

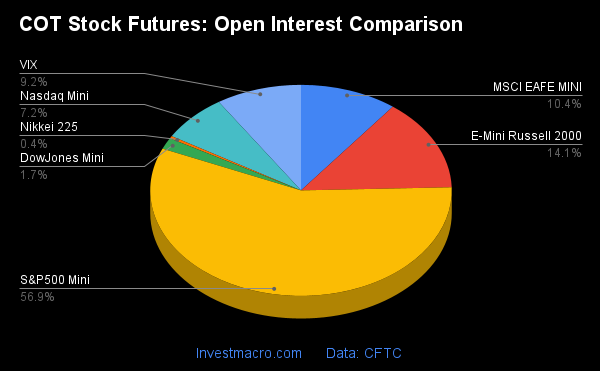
Stock Market Open Interest

Here are the latest charts and statistics for the Commitment of Traders (COT) data published by the Commodities Futures Trading Commission (CFTC).

The latest COT data is updated through Tuesday September 20th and shows a quick view of how large traders (for-profit speculators and commercial entities) were positioned in the futures markets.

The COT data this week is from the day before the US Federal Reserve raised the benchmark interest rate 75 basis points to the 3 to 3.25 percent range. This data shows the trader positioning prior to the rate hike and considering the way the stock markets have gone since Wednesday, positions could have been reversed shortly after.

S&P500 Mini & VIX lead the Weekly Speculator Changes

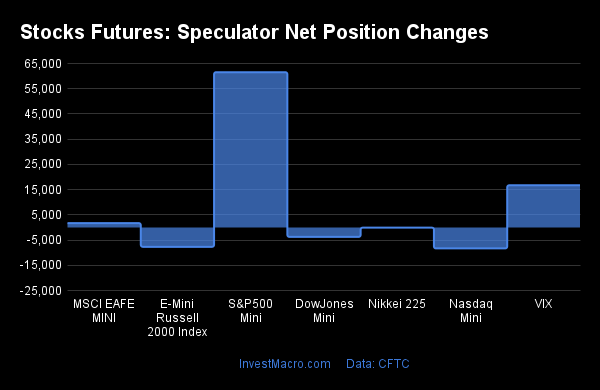
Stocks Futures Speculator Net Position Changes

The COT stock market speculator bets were slightly lower through Tuesday as three out of the seven stock markets we cover had higher positioning this week while the other four markets had lower contracts.

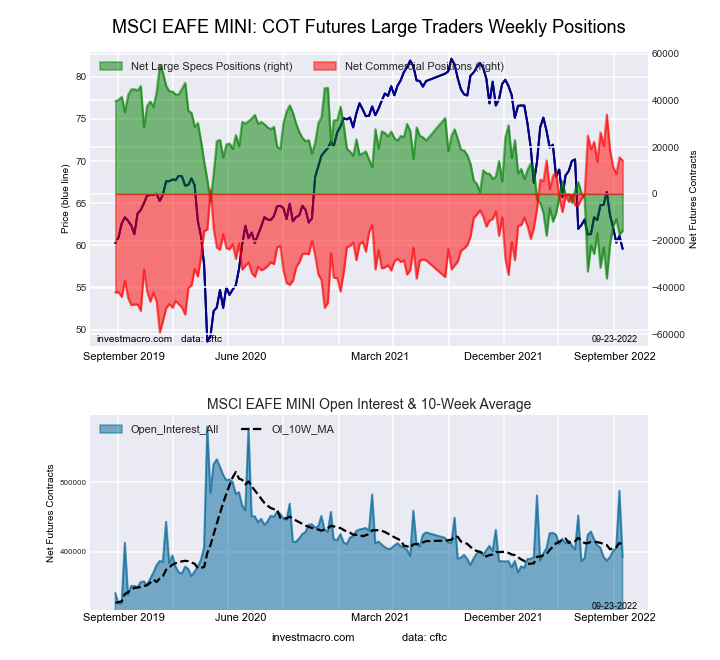
Leading the gains for stock markets was the S&P500 Mini (61,553 contracts) with the VIX (16,728 contracts) and MSCI EAFE Mini (1,723 contracts) also showing positive weeks.

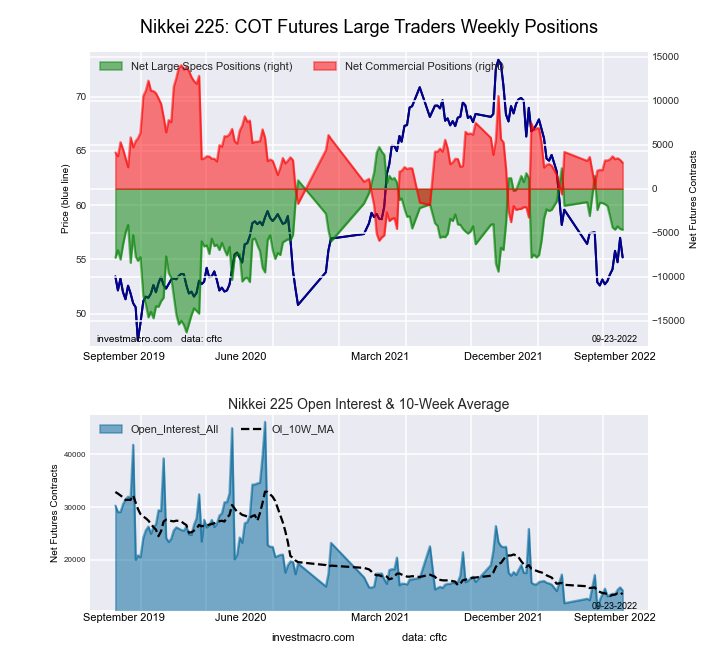
The stock markets with declines in speculator bets this week were the Nasdaq Mini (-8,321 contracts), Russell 2000 Mini (-7,686 contracts), Dow Jones Industrial Average Mini (-3,748 contracts) and the Nikkei 225 USD (-78 contracts) also registering lower bets on the week.

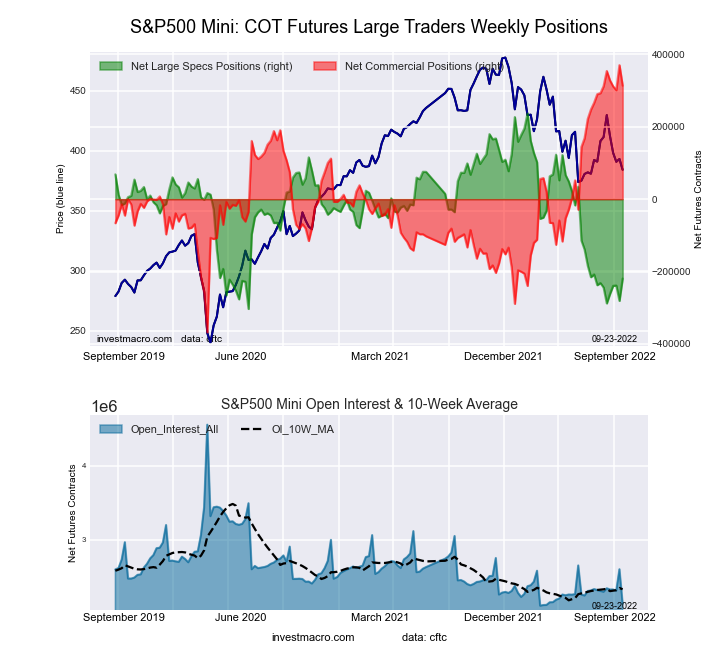
Highlighting the COT stocks data was the SP500 Mini speculator bets that jumped this week by over +60,000 contracts. This was the fourth week in the past five weeks that bets had improved for the SP-Mini. The positioning was likely heavily influenced by the Fed interest rate decision coming the day after (Wednesday) the data was collected. Digging into the data showed that the positive result for the SP500 Mini net positioning was due to a large number of traders reducing their gross short positions (by -75,190 contracts) on Tuesday. Speculators also reduced their gross long positions but by a much smaller number for the week (by -13,637 contracts). Overall, the SP500 Mini net position at -219,451 contracts remains extremely bearish and has been in a negative bearish position for the past fourteen straight weeks, dating back to June 21st.


Data Snapshot of Stock Market Traders | Columns Legend
Sep-20-2022OIOI-IndexSpec-NetSpec-IndexCom-NetCOM-IndexSmalls-NetSmalls-Index
S&P500-Mini2,141,0221-219,45116313,69892-94,2477
Nikkei 22514,15110-4,641552,949441,69250
Nasdaq-Mini271,815553,4857721,58240-25,0674
DowJones-Mini65,49021-15,4341815,84080-40636
VIX345,34140-81,7986890,84233-9,04448
Nikkei 225 Yen42,355181043418,61174-18,71536


Strength Scores

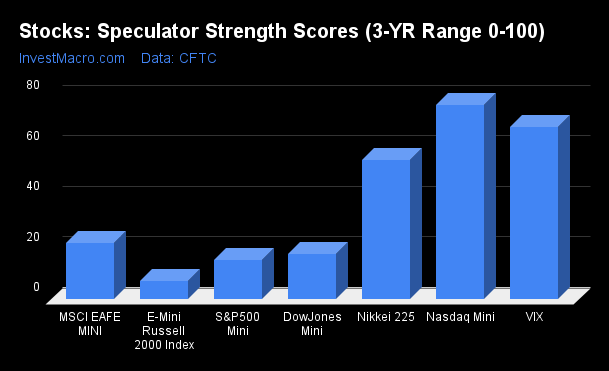
Strength Scores (a normalized measure of Speculator positions over a 3-Year range, from 0 to 100 where above 80 is extreme bullish and below 20 is extreme bearish) showed that the Nasdaq-Mini (77.0 percent) and the VIX (68.3 percent) lead the stock markets for the week. The Nikkei USD (55.4 percent) comes in as the next highest stocks market in strength scores.

On the downside, the Russell2000-Mini (7.4 percent), the S&P500-Mini (15.5 percent) and the DowJones-Mini (17.8 percent) come in at the lowest strength levels and are all in extreme bearish territory (below 20 percent).

Stock Strength Scores

Strength Statistics:
VIX (68.3 percent) vs VIX previous week (59.9 percent)
S&P500-Mini (15.5 percent) vs S&P500-Mini previous week (4.1 percent)
DowJones-Mini (17.8 percent) vs DowJones-Mini previous week (22.9 percent)
Nasdaq-Mini (77.0 percent) vs Nasdaq-Mini previous week (81.6 percent)
Russell2000-Mini (7.4 percent) vs Russell2000-Mini previous week (11.7 percent)
Nikkei USD (55.4 percent) vs Nikkei USD previous week (55.8 percent)
EAFE-Mini (22.4 percent) vs EAFE-Mini previous week (20.5 percent)

Strength Trends

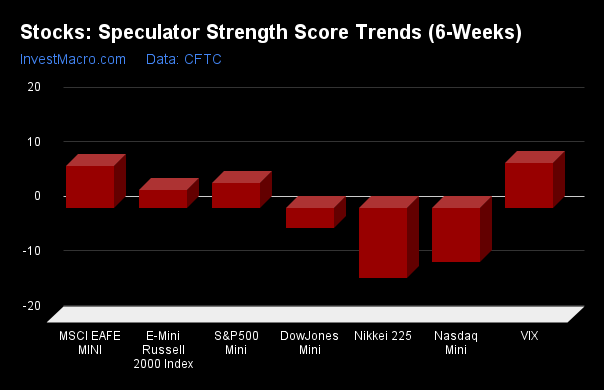
Strength Score Trends (or move index, calculates the 6-week changes in strength scores) showed that the VIX (8.2 percent) and the EAFE-Mini (7.8 percent) lead the past six weeks trends for stocks this week. The S&P500-Mini (4.6 percent) and the Russell2000-Mini (3.4 percent) fill out the other positive movers in the latest trends data.

The Nikkei USD (-12.8 percent) leads the downside trend scores currently while the next market with lower trend scores were the Nasdaq-Mini (-9.8 percent) followed by the DowJones-Mini (-3.6 percent).

Stocks Strength Trends

Strength Trend Statistics:
VIX (8.2 percent) vs VIX previous week (0.2 percent)
S&P500-Mini (4.6 percent) vs S&P500-Mini previous week (-9.1 percent)
DowJones-Mini (-3.6 percent) vs DowJones-Mini previous week (9.0 percent)
Nasdaq-Mini (-9.8 percent) vs Nasdaq-Mini previous week (-7.2 percent)
Russell2000-Mini (3.4 percent) vs Russell2000-Mini previous week (11.7 percent)
Nikkei USD (-12.8 percent) vs Nikkei USD previous week (-13.4 percent)
EAFE-Mini (7.8 percent) vs EAFE-Mini previous week (15.4 percent)


Individual Markets:

VIX Volatility Futures:

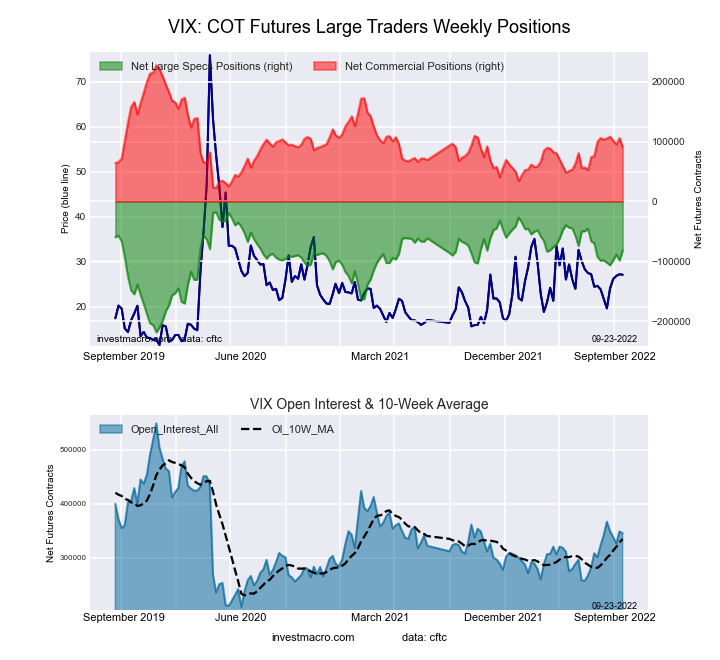
VIX Volatility Futures COT ChartThe VIX Volatility large speculator standing this week recorded a net position of -81,798 contracts in the data reported through Tuesday. This was a weekly boost of 16,728 contracts from the previous week which had a total of -98,526 net contracts.

This week’s current strength score (the trader positioning range over the past three years, measured from 0 to 100) shows the speculators are currently Bullish with a score of 68.3 percent. The commercials are Bearish with a score of 33.3 percent and the small traders (not shown in chart) are Bearish with a score of 47.5 percent.

VIX Volatility Futures StatisticsSPECULATORSCOMMERCIALSSMALL TRADERS
– Percent of Open Interest Longs:13.056.66.3
– Percent of Open Interest Shorts:36.730.38.9
– Net Position:-81,79890,842-9,044
– Gross Longs:45,066195,41321,807
– Gross Shorts:126,864104,57130,851
– Long to Short Ratio:0.4 to 11.9 to 10.7 to 1
NET POSITION TREND:
– Strength Index Score (3 Year Range Pct):68.333.347.5
– Strength Index Reading (3 Year Range):BullishBearishBearish
NET POSITION MOVEMENT INDEX:
– 6-Week Change in Strength Index:8.2-6.0-20.0


S&P500 Mini Futures:

SP500 Mini Futures COT ChartThe S&P500 Mini large speculator standing this week recorded a net position of -219,451 contracts in the data reported through Tuesday. This was a weekly gain of 61,553 contracts from the previous week which had a total of -281,004 net contracts.

This week’s current strength score (the trader positioning range over the past three years, measured from 0 to 100) shows the speculators are currently Bearish-Extreme with a score of 15.5 percent. The commercials are Bullish-Extreme with a score of 92.3 percent and the small traders (not shown in chart) are Bearish-Extreme with a score of 6.6 percent.

S&P500 Mini Futures StatisticsSPECULATORSCOMMERCIALSSMALL TRADERS
– Percent of Open Interest Longs:10.378.68.6
– Percent of Open Interest Shorts:20.663.913.0
– Net Position:-219,451313,698-94,247
– Gross Longs:221,1581,681,942184,903
– Gross Shorts:440,6091,368,244279,150
– Long to Short Ratio:0.5 to 11.2 to 10.7 to 1
NET POSITION TREND:
– Strength Index Score (3 Year Range Pct):15.592.36.6
– Strength Index Reading (3 Year Range):Bearish-ExtremeBullish-ExtremeBearish-Extreme
NET POSITION MOVEMENT INDEX:
– 6-Week Change in Strength Index:4.60.2-5.5


Dow Jones Mini Futures:

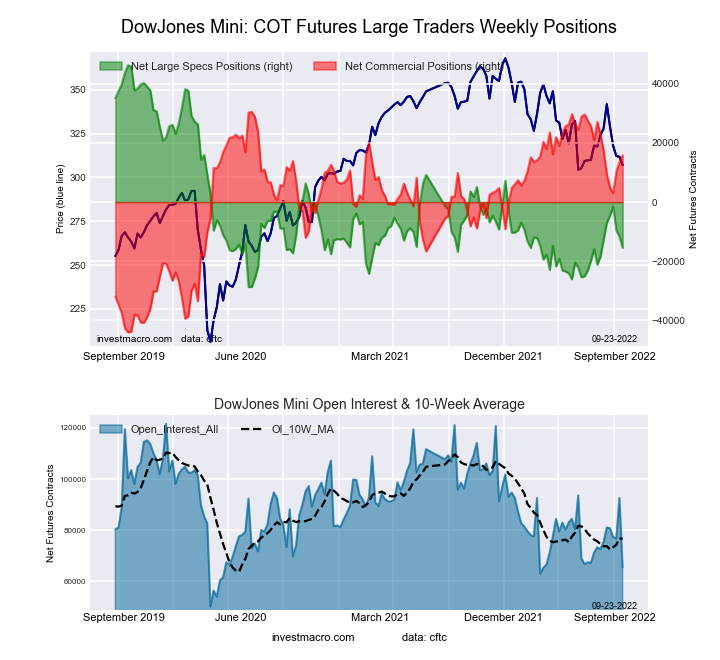
Dow Jones Mini Futures COT ChartThe Dow Jones Mini large speculator standing this week recorded a net position of -15,434 contracts in the data reported through Tuesday. This was a weekly decline of -3,748 contracts from the previous week which had a total of -11,686 net contracts.

This week’s current strength score (the trader positioning range over the past three years, measured from 0 to 100) shows the speculators are currently Bearish-Extreme with a score of 17.8 percent. The commercials are Bullish-Extreme with a score of 80.2 percent and the small traders (not shown in chart) are Bearish with a score of 36.3 percent.

Dow Jones Mini Futures StatisticsSPECULATORSCOMMERCIALSSMALL TRADERS
– Percent of Open Interest Longs:23.458.417.8
– Percent of Open Interest Shorts:47.034.218.5
– Net Position:-15,43415,840-406
– Gross Longs:15,31638,24011,687
– Gross Shorts:30,75022,40012,093
– Long to Short Ratio:0.5 to 11.7 to 11.0 to 1
NET POSITION TREND:
– Strength Index Score (3 Year Range Pct):17.880.236.3
– Strength Index Reading (3 Year Range):Bearish-ExtremeBullish-ExtremeBearish
NET POSITION MOVEMENT INDEX:
– 6-Week Change in Strength Index:-3.6-1.821.7


Nasdaq Mini Futures:

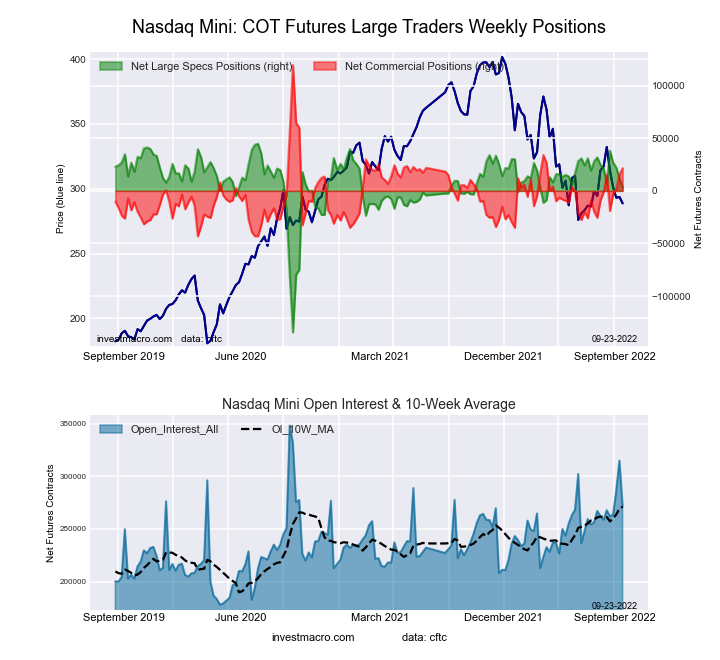
Nasdaq Mini Futures COT ChartThe Nasdaq Mini large speculator standing this week recorded a net position of 3,485 contracts in the data reported through Tuesday. This was a weekly decrease of -8,321 contracts from the previous week which had a total of 11,806 net contracts.

This week’s current strength score (the trader positioning range over the past three years, measured from 0 to 100) shows the speculators are currently Bullish with a score of 77.0 percent. The commercials are Bearish with a score of 39.8 percent and the small traders (not shown in chart) are Bearish-Extreme with a score of 4.4 percent.

Nasdaq Mini Futures StatisticsSPECULATORSCOMMERCIALSSMALL TRADERS
– Percent of Open Interest Longs:27.160.910.5
– Percent of Open Interest Shorts:25.853.019.7
– Net Position:3,48521,582-25,067
– Gross Longs:73,741165,61928,531
– Gross Shorts:70,256144,03753,598
– Long to Short Ratio:1.0 to 11.1 to 10.5 to 1
NET POSITION TREND:
– Strength Index Score (3 Year Range Pct):77.039.84.4
– Strength Index Reading (3 Year Range):BullishBearishBearish-Extreme
NET POSITION MOVEMENT INDEX:
– 6-Week Change in Strength Index:-9.814.0-9.9


Russell 2000 Mini Futures:

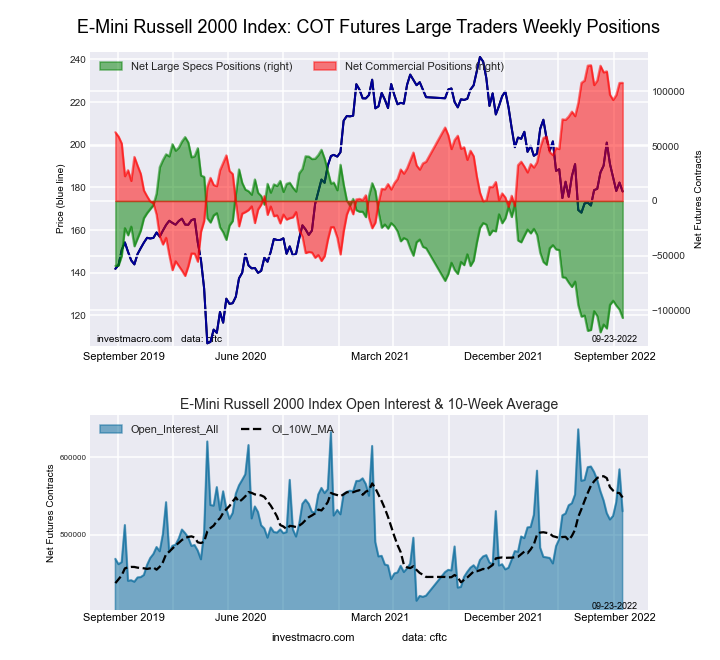
Russell 2000 Mini Futures COT ChartThe Russell 2000 Mini large speculator standing this week recorded a net position of -106,838 contracts in the data reported through Tuesday. This was a weekly lowering of -7,686 contracts from the previous week which had a total of -99,152 net contracts.

This week’s current strength score (the trader positioning range over the past three years, measured from 0 to 100) shows the speculators are currently Bearish-Extreme with a score of 7.4 percent. The commercials are Bullish-Extreme with a score of 91.6 percent and the small traders (not shown in chart) are Bearish with a score of 24.2 percent.

Russell 2000 Mini Futures StatisticsSPECULATORSCOMMERCIALSSMALL TRADERS
– Percent of Open Interest Longs:6.188.74.1
– Percent of Open Interest Shorts:26.368.34.3
– Net Position:-106,838107,880-1,042
– Gross Longs:32,486470,31921,997
– Gross Shorts:139,324362,43923,039
– Long to Short Ratio:0.2 to 11.3 to 11.0 to 1
NET POSITION TREND:
– Strength Index Score (3 Year Range Pct):7.491.624.2
– Strength Index Reading (3 Year Range):Bearish-ExtremeBullish-ExtremeBearish
NET POSITION MOVEMENT INDEX:
– 6-Week Change in Strength Index:3.4-5.010.9


Nikkei Stock Average (USD) Futures:

Nikkei Stock Average (USD) Futures COT ChartThe Nikkei Stock Average (USD) large speculator standing this week recorded a net position of -4,641 contracts in the data reported through Tuesday. This was a weekly decline of -78 contracts from the previous week which had a total of -4,563 net contracts.

This week’s current strength score (the trader positioning range over the past three years, measured from 0 to 100) shows the speculators are currently Bullish with a score of 55.4 percent. The commercials are Bearish with a score of 44.4 percent and the small traders (not shown in chart) are Bearish with a score of 49.6 percent.

Nikkei Stock Average Futures StatisticsSPECULATORSCOMMERCIALSSMALL TRADERS
– Percent of Open Interest Longs:12.253.334.2
– Percent of Open Interest Shorts:45.032.522.3
– Net Position:-4,6412,9491,692
– Gross Longs:1,7297,5484,844
– Gross Shorts:6,3704,5993,152
– Long to Short Ratio:0.3 to 11.6 to 11.5 to 1
NET POSITION TREND:
– Strength Index Score (3 Year Range Pct):55.444.449.6
– Strength Index Reading (3 Year Range):BullishBearishBearish
NET POSITION MOVEMENT INDEX:
– 6-Week Change in Strength Index:-12.8-1.337.0


MSCI EAFE Mini Futures:

MSCI EAFE Mini Futures COT ChartThe MSCI EAFE Mini large speculator standing this week recorded a net position of -15,709 contracts in the data reported through Tuesday. This was a weekly lift of 1,723 contracts from the previous week which had a total of -17,432 net contracts.

This week’s current strength score (the trader positioning range over the past three years, measured from 0 to 100) shows the speculators are currently Bearish with a score of 22.4 percent. The commercials are Bullish with a score of 78.9 percent and the small traders (not shown in chart) are Bearish with a score of 31.5 percent.

MSCI EAFE Mini Futures StatisticsSPECULATORSCOMMERCIALSSMALL TRADERS
– Percent of Open Interest Longs:5.392.12.0
– Percent of Open Interest Shorts:9.388.51.7
– Net Position:-15,70914,2601,449
– Gross Longs:20,659360,9398,009
– Gross Shorts:36,368346,6796,560
– Long to Short Ratio:0.6 to 11.0 to 11.2 to 1
NET POSITION TREND:
– Strength Index Score (3 Year Range Pct):22.478.931.5
– Strength Index Reading (3 Year Range):BearishBullishBearish
NET POSITION MOVEMENT INDEX:
– 6-Week Change in Strength Index:7.8-6.7-7.9


Article By InvestMacroReceive our weekly COT Newsletter

*COT Report: The COT data, released weekly to the public each Friday, is updated through the most recent Tuesday (data is 3 days old) and shows a quick view of how large speculators or non-commercials (for-profit traders) were positioned in the futures markets.

The CFTC categorizes trader positions according to commercial hedgers (traders who use futures contracts for hedging as part of the business), non-commercials (large traders who speculate to realize trading profits) and nonreportable traders (usually small traders/speculators) as well as their open interest (contracts open in the market at time of reporting). See CFTC criteria here.
WTI Crude Oil leads Energy Speculator Bet Changes this week

By InvestMacro

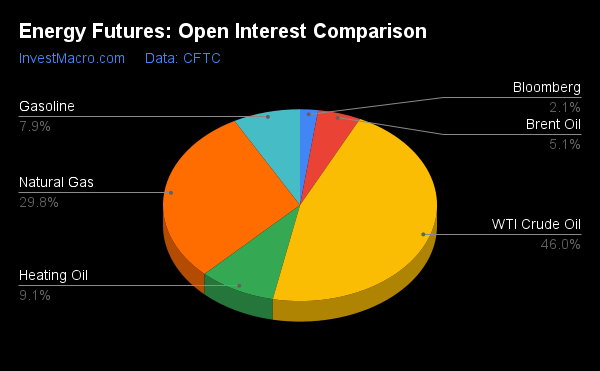
Energy Futures Open Interest OI Comparison

Here are the latest charts and statistics for the Commitment of Traders (COT) data published by the Commodities Futures Trading Commission (CFTC).

The latest COT data is updated through Tuesday September 20th and shows a quick view of how large traders (for-profit speculators and commercial hedgers) were positioned in the futures markets.

WTI Crude Oil leads the Weekly Speculator Changes

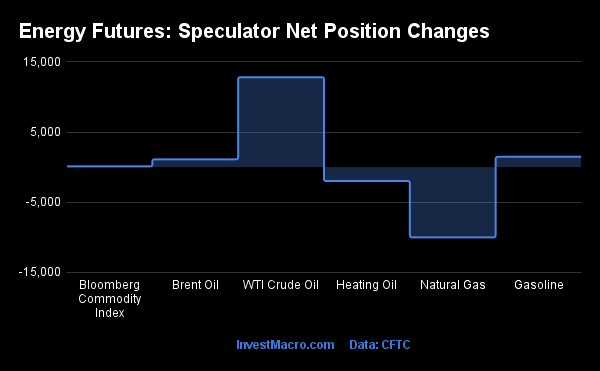
The COT energy market speculator bets were a little higher this week as four out of the six energy markets we cover had higher positioning this week while the other two markets had lower contracts.

Leading the gains for energy markets was WTI Crude Oil (12,821 contracts) with Gasoline (1,481 contracts), Brent Crude Oil (1,120 contracts) and Bloomberg Commodity Index (117 contracts) also showing positive weeks.

The energy markets leading the declines in speculator bets this week were Natural Gas (-9,996 contracts) with Heating Oil (-1,967 contracts) also registering lower bets on the week.


Data Snapshot of Commodity Market Traders | Columns Legend
Sep-20-2022OIOI-IndexSpec-NetSpec-IndexCom-NetCOM-IndexSmalls-NetSmalls-Index
WTI Crude1,481,5451239,8788-261,5689421,69036
Gold469,395565,7220-75,4281009,7060
Silver132,1070-1,64012-5,629907,2694
Copper163,0584-20,2862223,21582-2,9298
Palladium5,9931-1,081171,26182-18033
Platinum62,900272,39012-5,496893,1065
Natural Gas960,2361-155,71132121,3086934,40362
Brent164,02511-37,9034836,732541,17125
Heating Oil292,6343214,09763-25,9414411,84439
Soybeans656,3101884,77339-55,48570-29,28822
Corn1,330,8419305,67769-241,23838-64,4396
Coffee191,433541,07274-42,998301,92617
Sugar744,972837,34544-35,86061-1,4856
Wheat285,5670-4,029149,98274-5,95380


Strength Scores

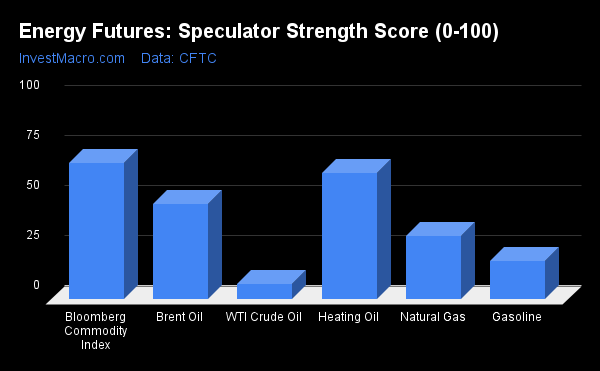
Strength Scores (a normalized measure of Speculator positions over a 3-Year range, from 0 to 100 where above 80 is extreme bullish and below 20 is extreme bearish) showed that the Bloomberg Commodity Index (68.0 percent) and Heating Oil (63.2 percent) lead the energy category this week and are the only two markets above their midpoint of the past three years (50 percent).

On the downside, WTI Crude Oil (7.7 percent) and Gasoline (19.1 percent) come in at the lowest strength levels currently and are in bearish extreme positions (below 20 percent). Natural Gas (31.8 percent) and Brent Crude Oil (47.6 percent) are the next lowest strength scores.

Strength Statistics:
WTI Crude Oil (7.7 percent) vs WTI Crude Oil previous week (4.3 percent)
Brent Crude Oil (47.6 percent) vs Brent Crude Oil previous week (45.7 percent)
Natural Gas (31.8 percent) vs Natural Gas previous week (34.8 percent)
Gasoline (19.1 percent) vs Gasoline previous week (17.6 percent)
Heating Oil (63.2 percent) vs Heating Oil previous week (66.1 percent)
Bloomberg Commodity Index (68.0 percent) vs Bloomberg Commodity Index previous week (67.6 percent)

Strength Trends

Strength Score Trends (or move index, calculates the 6-week changes in strength scores) show that the Bloomberg Commodity Index (8.9 percent) leads the past six weeks trends for energy this week. WTI Crude Oil (7.7 percent) and Gasoline (1.6 percent) fill out the other positive movers in the latest trends data.

Heating Oil (-15.3 percent) leads the downside trend scores currently while the next markets with lower trend scores were Natural Gas (-9.1 percent) followed by Brent Crude Oil (-6.2 percent).


Strength Trend Statistics:
WTI Crude Oil (7.7 percent) vs WTI Crude Oil previous week (-7.0 percent)
Brent Crude Oil (-6.2 percent) vs Brent Crude Oil previous week (-10.5 percent)
Natural Gas (-9.1 percent) vs Natural Gas previous week (-6.2 percent)
Gasoline (1.6 percent) vs Gasoline previous week (-5.2 percent)
Heating Oil (-15.3 percent) vs Heating Oil previous week (-8.8 percent)
Bloomberg Commodity Index (8.9 percent) vs Bloomberg Commodity Index previous week (8.4 percent)


Individual COT Market Charts:

WTI Crude Oil Futures:

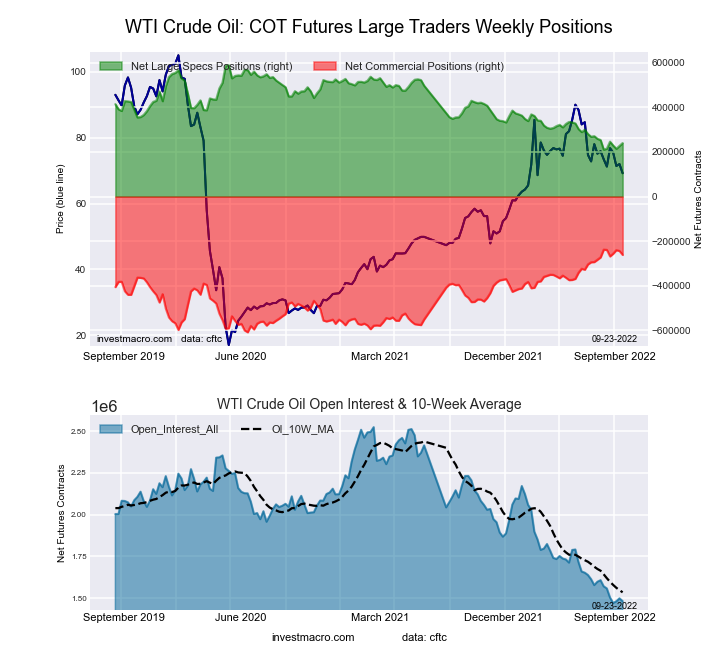
WTI Crude Oil Futures COT ChartThe WTI Crude Oil Futures large speculator standing this week equaled a net position of 239,878 contracts in the data reported through Tuesday. This was a weekly increase of 12,821 contracts from the previous week which had a total of 227,057 net contracts.

This week’s current strength score (the trader positioning range over the past three years, measured from 0 to 100) shows the speculators are currently Bearish-Extreme with a score of 7.7 percent. The commercials are Bullish-Extreme with a score of 93.7 percent and the small traders (not shown in chart) are Bearish with a score of 36.2 percent.

WTI Crude Oil Futures StatisticsSPECULATORSCOMMERCIALSSMALL TRADERS
– Percent of Open Interest Longs:23.139.84.9
– Percent of Open Interest Shorts:6.957.43.5
– Net Position:239,878-261,56821,690
– Gross Longs:342,588589,44573,243
– Gross Shorts:102,710851,01351,553
– Long to Short Ratio:3.3 to 10.7 to 11.4 to 1
NET POSITION TREND:
– Strength Index Score (3 Year Range Pct):7.793.736.2
– Strength Index Reading (3 Year Range):Bearish-ExtremeBullish-ExtremeBearish
NET POSITION MOVEMENT INDEX:
– 6-Week Change in Strength Index:7.7-6.3-9.5


Brent Crude Oil Futures:

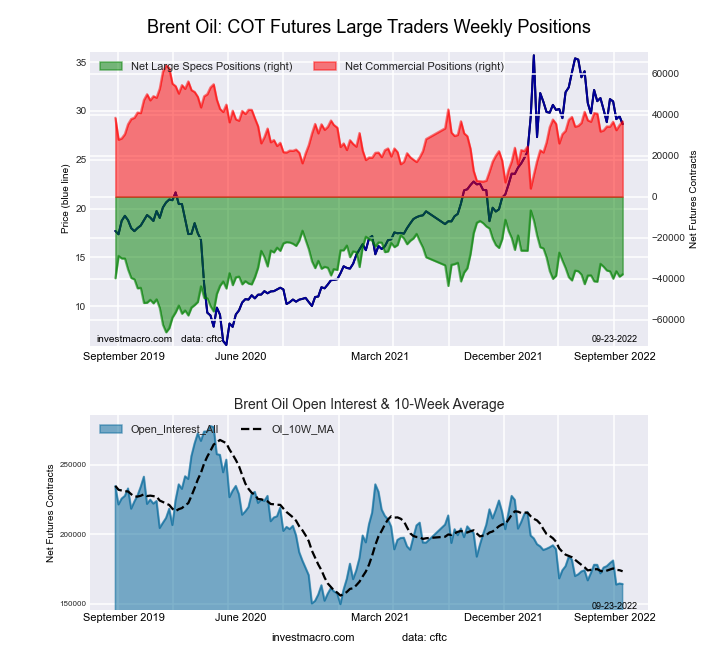
Brent Last Day Crude Oil Futures COT ChartThe Brent Crude Oil Futures large speculator standing this week equaled a net position of -37,903 contracts in the data reported through Tuesday. This was a weekly gain of 1,120 contracts from the previous week which had a total of -39,023 net contracts.

This week’s current strength score (the trader positioning range over the past three years, measured from 0 to 100) shows the speculators are currently Bearish with a score of 47.6 percent. The commercials are Bullish with a score of 54.4 percent and the small traders (not shown in chart) are Bearish with a score of 25.1 percent.

Brent Crude Oil Futures StatisticsSPECULATORSCOMMERCIALSSMALL TRADERS
– Percent of Open Interest Longs:15.653.74.7
– Percent of Open Interest Shorts:38.831.34.0
– Net Position:-37,90336,7321,171
– Gross Longs:25,66388,0067,706
– Gross Shorts:63,56651,2746,535
– Long to Short Ratio:0.4 to 11.7 to 11.2 to 1
NET POSITION TREND:
– Strength Index Score (3 Year Range Pct):47.654.425.1
– Strength Index Reading (3 Year Range):BearishBullishBearish
NET POSITION MOVEMENT INDEX:
– 6-Week Change in Strength Index:-6.27.2-8.5


Natural Gas Futures:

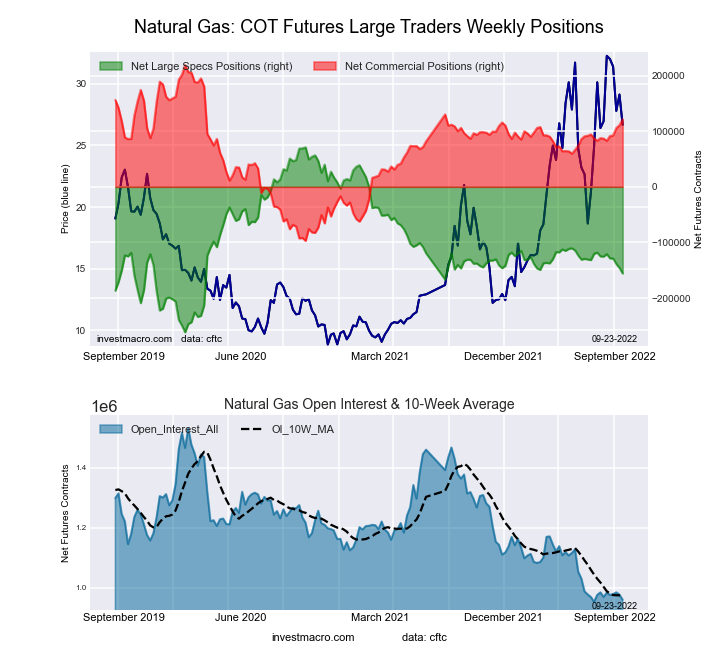
Natural Gas Futures COT ChartThe Natural Gas Futures large speculator standing this week equaled a net position of -155,711 contracts in the data reported through Tuesday. This was a weekly fall of -9,996 contracts from the previous week which had a total of -145,715 net contracts.

This week’s current strength score (the trader positioning range over the past three years, measured from 0 to 100) shows the speculators are currently Bearish with a score of 31.8 percent. The commercials are Bullish with a score of 69.2 percent and the small traders (not shown in chart) are Bullish with a score of 61.6 percent.

Natural Gas Futures StatisticsSPECULATORSCOMMERCIALSSMALL TRADERS
– Percent of Open Interest Longs:15.943.56.9
– Percent of Open Interest Shorts:32.230.83.3
– Net Position:-155,711121,30834,403
– Gross Longs:153,110417,43166,185
– Gross Shorts:308,821296,12331,782
– Long to Short Ratio:0.5 to 11.4 to 12.1 to 1
NET POSITION TREND:
– Strength Index Score (3 Year Range Pct):31.869.261.6
– Strength Index Reading (3 Year Range):BearishBullishBullish
NET POSITION MOVEMENT INDEX:
– 6-Week Change in Strength Index:-9.110.9-10.1


Gasoline Blendstock Futures:

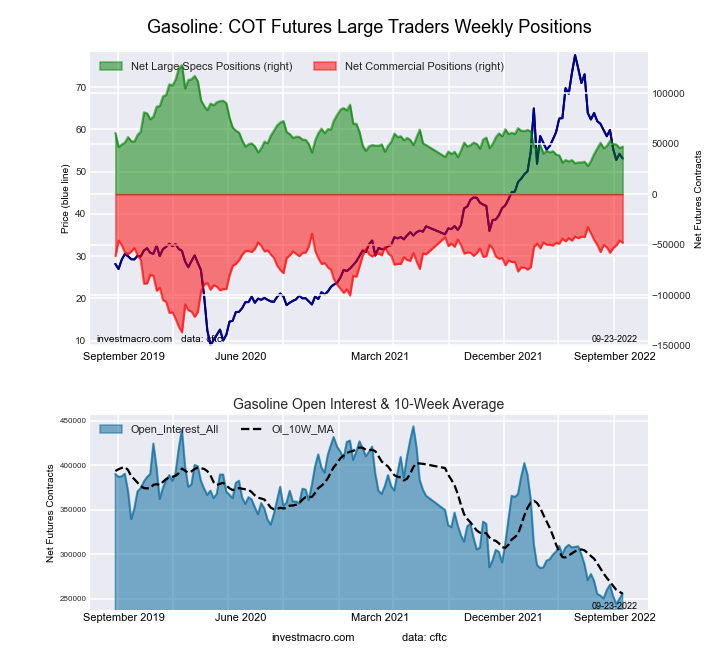
RBOB Gasoline Energy Futures COT ChartThe Gasoline Blendstock Futures large speculator standing this week equaled a net position of 47,073 contracts in the data reported through Tuesday. This was a weekly advance of 1,481 contracts from the previous week which had a total of 45,592 net contracts.

This week’s current strength score (the trader positioning range over the past three years, measured from 0 to 100) shows the speculators are currently Bearish-Extreme with a score of 19.1 percent. The commercials are Bullish-Extreme with a score of 85.1 percent and the small traders (not shown in chart) are Bearish with a score of 20.2 percent.

Nasdaq Mini Futures StatisticsSPECULATORSCOMMERCIALSSMALL TRADERS
– Percent of Open Interest Longs:30.549.67.2
– Percent of Open Interest Shorts:12.168.56.8
– Net Position:47,073-48,1921,119
– Gross Longs:77,904126,88718,448
– Gross Shorts:30,831175,07917,329
– Long to Short Ratio:2.5 to 10.7 to 11.1 to 1
NET POSITION TREND:
– Strength Index Score (3 Year Range Pct):19.185.120.2
– Strength Index Reading (3 Year Range):Bearish-ExtremeBullish-ExtremeBearish
NET POSITION MOVEMENT INDEX:
– 6-Week Change in Strength Index:1.62.0-24.2


#2 Heating Oil NY-Harbor Futures:

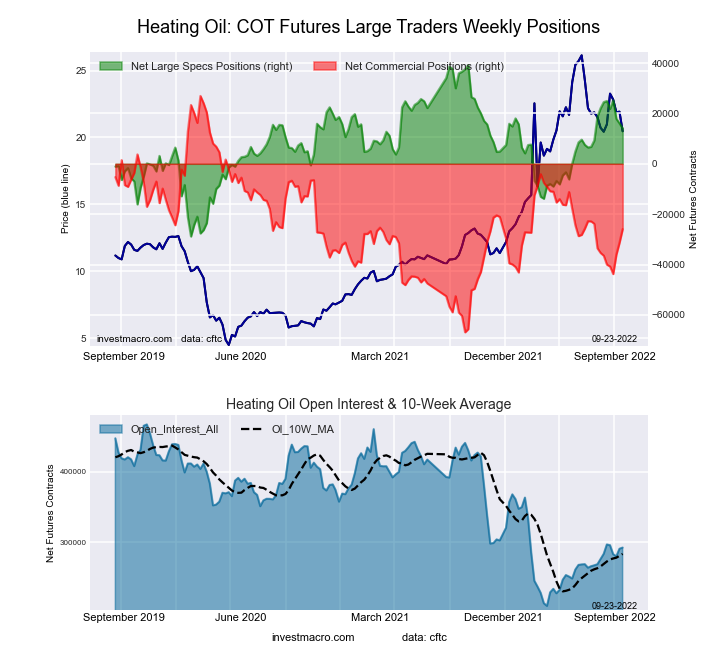
NY Harbor Heating Oil Energy Futures COT ChartThe #2 Heating Oil NY-Harbor Futures large speculator standing this week equaled a net position of 14,097 contracts in the data reported through Tuesday. This was a weekly fall of -1,967 contracts from the previous week which had a total of 16,064 net contracts.

This week’s current strength score (the trader positioning range over the past three years, measured from 0 to 100) shows the speculators are currently Bullish with a score of 63.2 percent. The commercials are Bearish with a score of 43.6 percent and the small traders (not shown in chart) are Bearish with a score of 39.4 percent.

Heating Oil Futures StatisticsSPECULATORSCOMMERCIALSSMALL TRADERS
– Percent of Open Interest Longs:13.854.713.3
– Percent of Open Interest Shorts:9.063.69.3
– Net Position:14,097-25,94111,844
– Gross Longs:40,428160,16539,038
– Gross Shorts:26,331186,10627,194
– Long to Short Ratio:1.5 to 10.9 to 11.4 to 1
NET POSITION TREND:
– Strength Index Score (3 Year Range Pct):63.243.639.4
– Strength Index Reading (3 Year Range):BullishBearishBearish
NET POSITION MOVEMENT INDEX:
– 6-Week Change in Strength Index:-15.311.2-0.6


Bloomberg Commodity Index Futures:

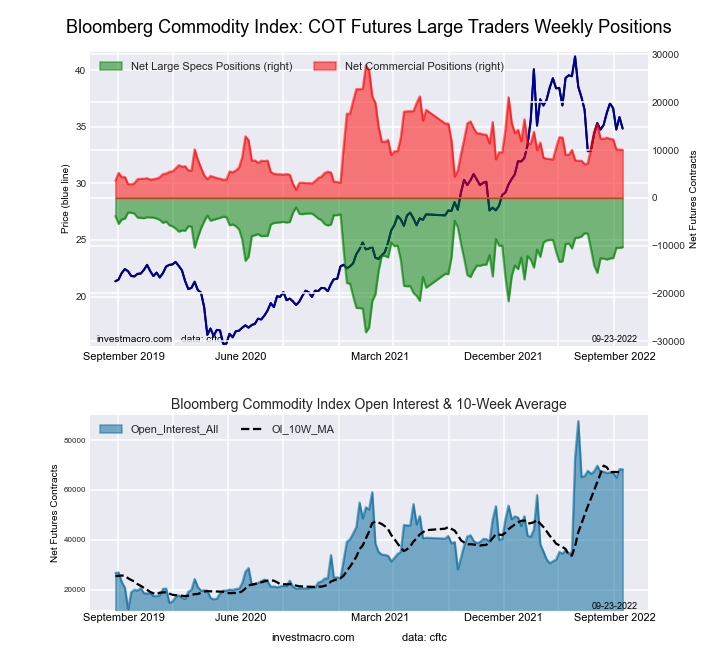
Bloomberg Commodity Index Futures COT ChartThe Bloomberg Commodity Index Futures large speculator standing this week equaled a net position of -10,317 contracts in the data reported through Tuesday. This was a weekly lift of 117 contracts from the previous week which had a total of -10,434 net contracts.

This week’s current strength score (the trader positioning range over the past three years, measured from 0 to 100) shows the speculators are currently Bullish with a score of 68.0 percent. The commercials are Bearish with a score of 31.9 percent and the small traders (not shown in chart) are Bearish with a score of 20.7 percent.

Bloomberg Index Futures StatisticsSPECULATORSCOMMERCIALSSMALL TRADERS
– Percent of Open Interest Longs:25.270.00.5
– Percent of Open Interest Shorts:40.355.30.1
– Net Position:-10,31710,031286
– Gross Longs:17,20047,853361
– Gross Shorts:27,51737,82275
– Long to Short Ratio:0.6 to 11.3 to 14.8 to 1
NET POSITION TREND:
– Strength Index Score (3 Year Range Pct):68.031.920.7
– Strength Index Reading (3 Year Range):BullishBearishBearish
NET POSITION MOVEMENT INDEX:
– 6-Week Change in Strength Index:8.9-9.00.2


Article By InvestMacroReceive our weekly COT Newsletter

*COT Report: The COT data, released weekly to the public each Friday, is updated through the most recent Tuesday (data is 3 days old) and shows a quick view of how large speculators or non-commercials (for-profit traders) were positioned in the futures markets.

The CFTC categorizes trader positions according to commercial hedgers (traders who use futures contracts for hedging as part of the business), non-commercials (large traders who speculate to realize trading profits) and nonreportable traders (usually small traders/speculators) as well as their open interest (contracts open in the market at time of reporting). See CFTC criteria here.
Murrey Math Lines 23.09.2022 (Brent, S&P 500)

Article By RoboForex.com

BRENT

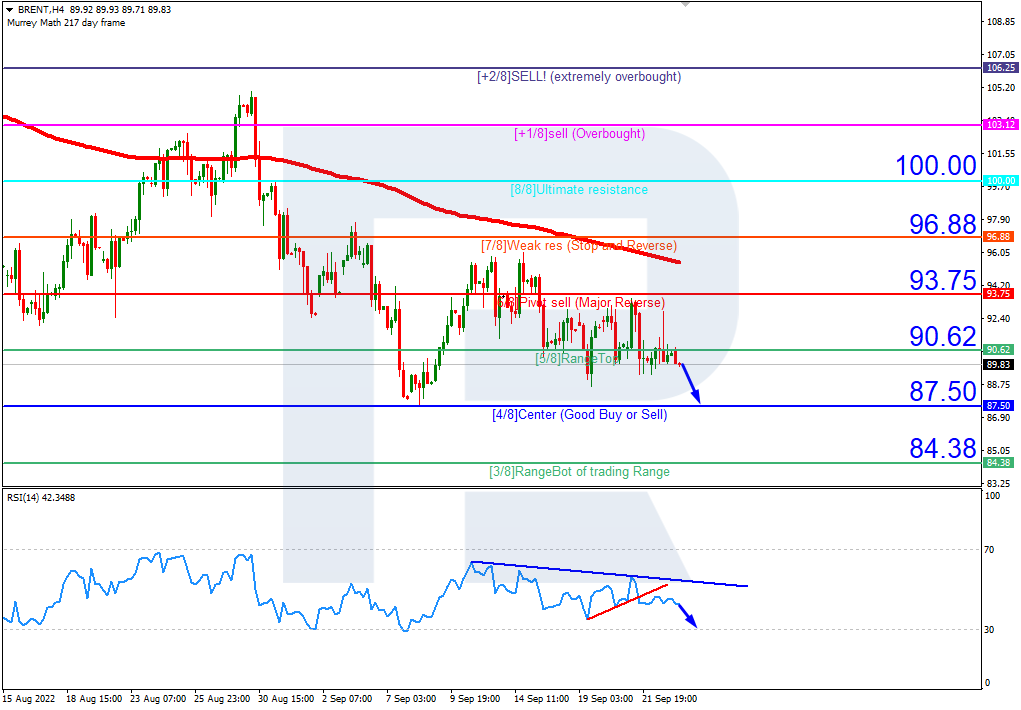
As we can see in the H4 chart, Brent is trading below the 200-day Moving Average it to indicate a possible descending tendency. The Relative Strength Index has rebounded from the descending trendline; it is still moving downwards. In this case, the pair is expected to continue falling towards the support at 4/8 (87.50). However, this scenario may be cancelled if the price breaks the resistance at 5/8 (90.62) to the upside. After that, the instrument may move upwards to reach 6/8 (93.75).
BRENTH4
Risk Warning: the result of previous trading operations do not guarantee the same results in the future

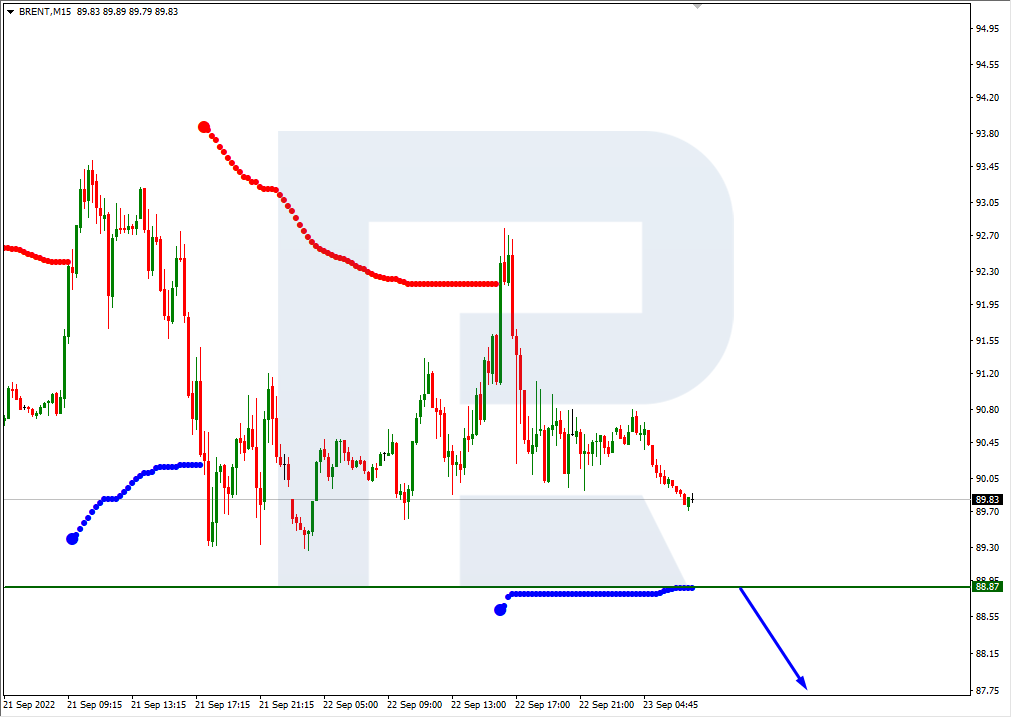
In the M15 chart, the pair may break the downside line of the VoltyChannel indicator and, as a result, continue its decline.

BRENT_M15
Risk Warning: the result of previous trading operations do not guarantee the same results in the future

S&P 500

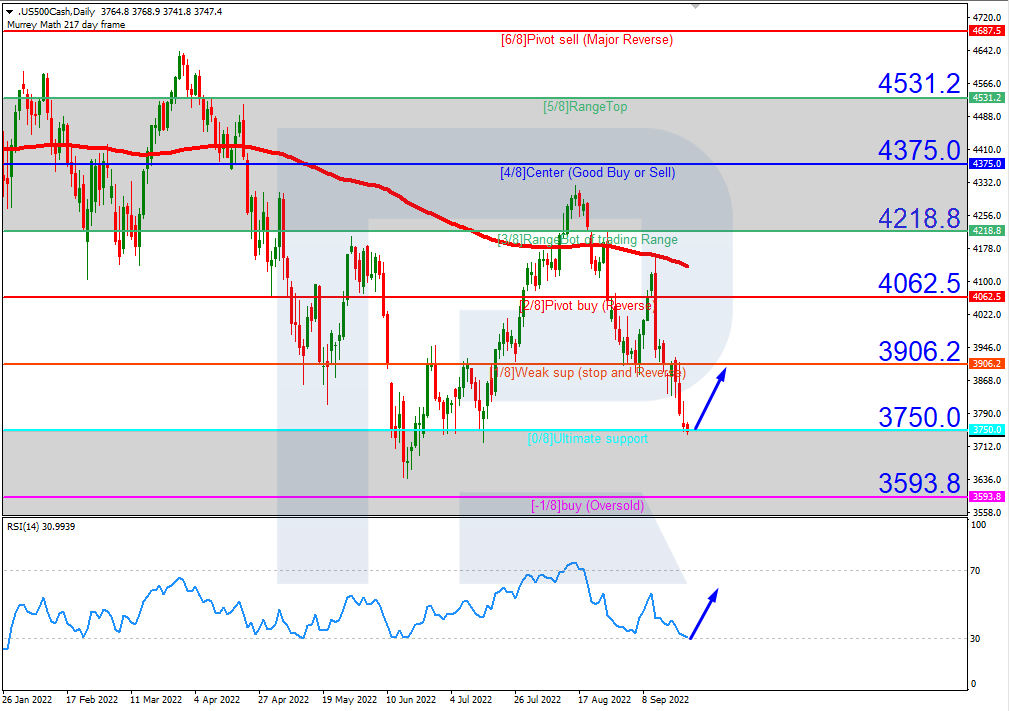
In the H4 chart, the S&P 500 index has reached the “oversold area”. The Relative Strength Index is testing 30, confirming that the asset is oversold. In this case, the price is expected to rebound from 0/8 (3750.0) and resume moving upwards to reach the resistance at 1/8 (3906.2). However, this scenario may no longer be valid if the price breaks the support at 0/8 (3770.0) to the downside. After that, the instrument may continue fall towards -1/8 (3595.8).

S&P 500_H4
Risk Warning: the result of previous trading operations do not guarantee the same results in the future

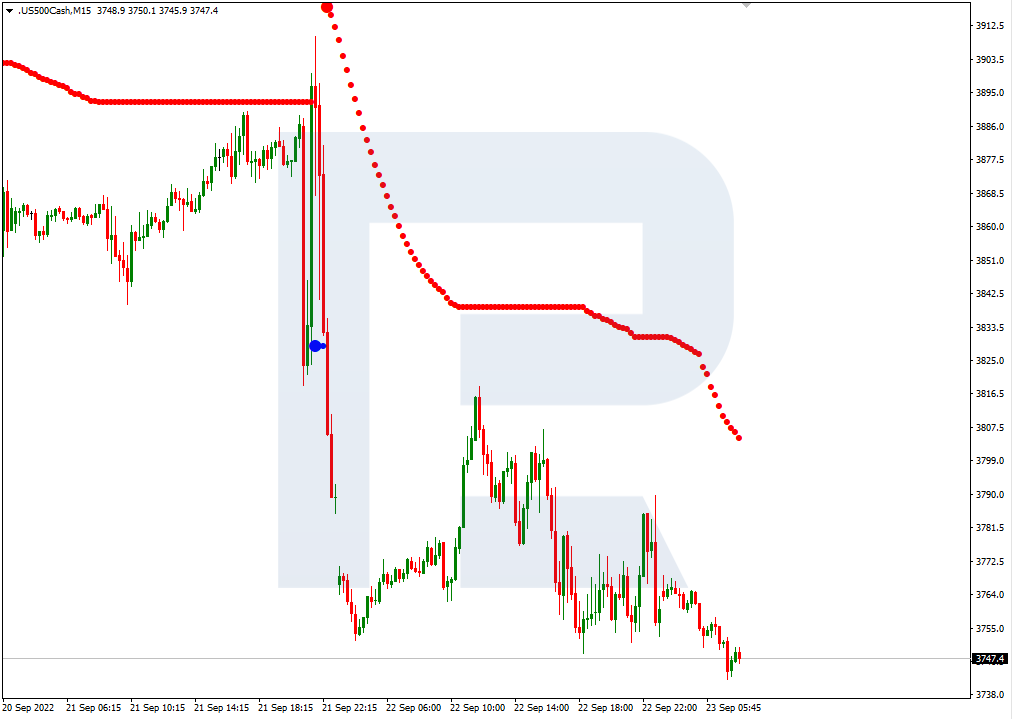
As we can see in the M15 chart, the upside line of the VoltyChannel indicator is pretty far away from the price, that’s why the pair may resume trading upwards only after rebounding from 0/8 in the H4 chart.

S&P 500_M15

Article By RoboForex.com

Attention!
Forecasts presented in this section only reflect the author’s private opinion and should not be considered as guidance for trading. RoboForex LP bears no responsibility for trading results based on trading recommendations described in these analytical reviews.

The cryptocurrency market digest (BTC, ETH). Overview for 23.09.2022

Article By RoboForex.com

The BTC is trying to recover, but its hopes were shipwrecked. Yesterday, the major crypto gained almost 4%, but today it is retreating to $19,065. We’ve already told earlier that important support level at $18,000-$19000 “survived”. However, the BTC still stands a good chance to reach this range, because there are no good reasons to buy it.

To reverse and start a proper growth, the BTC must fix above $21,500, and $22,000 would be even better.

The BTC’s still has a strong correlation with the S&P 500 index, which is expected to continue falling. Investors aren’t interested in risky assets right now due to negative external background.

Ripple: the struggle continues

The SEC’s lawsuit against Ripple won’t be brought into a jury courtб because the judge has enough proof to deliver a verdict. It’s a good sign for Ripple: it means that the parties have no controversy on particular facts. Yesterday, the XRP leaped up 30%; today it gained almost 4%.

Ethereum merge didn’t help NFT

NFT projects got no positive boost after the Ethereum upgrade. This assumption was made based on the fact that Ethereum dominates as a basis for NFT projects in most cases. Lack of interest to NFT is unusual: the upgrade to PoS was expected to attract potential investors.

Novogratz: the low in ETH is ahead

Billionaire Mike Novogratz believes that after successful upgrade of Ethereum, the ETH is very close to the bottom. However, he isn’t expecting a dramatic decline in the BTC.

Article By RoboForex.com

Attention!
Forecasts presented in this section only reflect the author’s private opinion and should not be considered as guidance for trading. RoboForex LP bears no responsibility for trading results based on trading recommendations described in these analytical reviews.

The Analytical Overview of the Main Currency Pairs on 2022.09.22

By JustForex

The EUR/USD currency pair

Technical indicators of the currency pair:
  • Prev Open: 0.9965
  • Prev Close: 0.9836
  • % chg. over the last day: -1.31 %

The Federal Reserve unanimously raised its target range for Fed funds by 75 basis points and raised its rate hike forecasts. The Fed Funds rate for the end of 2022 is now expected to be 4.4%, indicating a high probability of another 75bp increase in November and 50bp in December. Monetary policy is expected to tighten further in 2023 and the year-end rate is expected to be 4.6% before falling to 3.9% in 2024 and 2.9% in 2025, with the long-term forecast remaining at 2.5%. The US Federal Reserve cut annualized GDP growth in Q4 2022 to 0.2% from 1.7% and in 2023 to 1.2% from 1.7%. And while the markets expected the 0.75% increase, this further aggressive attitude of the US Fed was a surprise. As the dollar index rose, the euro fell to a 20-year low.

Trading recommendations
  • Support levels: 0.9800
  • Resistance levels: 0.9949, 1.0048, 1.0111, 1.0162, 1.0230

From the technical point of view, the trend on the EUR/USD currency pair on the hourly time frame has changed to bearish. The price is trading below the moving averages, and sellers’ pressure is still high. The MACD indicator is deeply negative, but divergence can be seen on several timeframes. It is best to look for sell trades from the resistance level of 0.9949. Buy trades can be considered from the round level of 0.9800, but only with confirmation.

Alternative scenario: if the price breaks out through the resistance level of 1.0111 and fixes above it, the uptrend will likely resume.

EUR/USD
News feed for 2022.09.22:
  • – US Initial Jobless Claims (w/w) at 15:30 (GMT+3).

The GBP/USD currency pair

Technical indicators of the currency pair:
  • Prev Open: 1.1368
  • Prev Close: 1.1262
  • % chg. over the last day: -0.94 %

The Bank of England will hold its monetary policy meeting today. Analysts forecast that the central bank will raise the interest rate by 0.5%. A 0.75% hike is also being considered, but with the new UK government looking to cap household energy bills for the next two years, such a move is considered unlikely. At the moment, the British pound is under pressure from a rise in the dollar index, especially after the Fed’s aggressive plans to further tighten monetary policy by raising interest rates until the second half of 2023. As the dollar index rose, the pound sterling fell to a 37-year low.

Trading recommendations
  • Support levels: 1.1200
  • Resistance levels: 1.1363, 1.1449, 1.1626, 1.1693, 1.1816, 1.1901, 1.1994

From the technical point of view, the trend on the GBP/USD currency pair on the hourly time frame is bearish. At the moment, the price is trading below the moving averages, and sellers’ pressure remains. The MACD indicator is in the negative zone, but there is a divergence, and it is getting stronger. Sell trades are better to look for on the intraday time frames, and the nearest resistance level is 1.1363. Buy trades can be considered from the round level of 1.1200, but only with confirmation.

Alternative scenario: if the price breaks out of the 1.1626 resistance level and fixes above it, the uptrend will likely resume.

GBP/USD
News feed for 2022.09.22:
  • – UK BoE Interest Rate Decision at 14:00 (GMT+3);
  • – UK MPC Meeting Minutes at 14:00 (GMT+3).

The USD/JPY currency pair

Technical indicators of the currency pair:
  • Prev Open: 143.71
  • Prev Close: 144.06
  • % chg. over the last day: +0.24 %

The Japanese yen showed surprising resilience to the dollar index gains yesterday, indicating that traders see a threat of intervention by the Bank of Japan to strengthen the Japanese yen. The Bank of Japan’s zero interest rate stance, even as inflation in Japan has reached its highest annual rate in nearly eight years, has traders betting that the central bank will eventually have to abandon an extensive bond-buying project that has kept 10-year bond yields at zero. At its meeting today, the central bank kept all key elements of its policy unchanged.

Trading recommendations
  • Support levels: 142.10, 141.00, 139.61, 138.78, 137.65, 136.80, 135.20
  • Resistance levels: 145.00

From the technical point of view, the medium-term trend on the currency pair USD/JPY is bullish. The MACD indicator is in the positive zone, and there is slight pressure from buyers. Under such market conditions, buy trades can be searched for on intraday time frames but with confirmation. Selling can be sought from the resistance level of 145.00, but only with additional confirmation, as fundamentally, USD/JPY quotes are inclined to grow.

Alternative scenario: If the price fixes below 142.10, the downtrend will likely resume.

USD/JPY
News feed for 2022.09.22:
  • – Japan BoJ Outlook Report (Tentative);
  • – Japan BoJ Interest Rate Decision (Tentative);
  • – Japan BoJ Press Conference at 09:30 (GMT+3).

The USD/CAD currency pair

Technical indicators of the currency pair:
  • Prev Open: 1.3365
  • Prev Close: 1.3366
  • % chg. over the last day: +0.76 %

The Canadian dollar has reached a two-year low. The Canadian currency is declining for two main reasons. The first is that the dollar index reached a 20-year high on the back of aggressive actions of the US Federal Reserve. The second is that oil is declining due to higher inventories as well as expectations of lower economic activity. When there is a lot of uncertainty about the global outlook, investors tend to look for safe assets such as the US dollar, bonds, and gold.

Trading recommendations
  • Support levels: 1.3390, 1.3298, 1.3212, 1.3053, 1.2990, 1.2958, 1.2936, 1.2900
  • Resistance levels: 1.3531, 1.3561

From the point of view of technical analysis, the trend on the USD/CAD currency pair is bullish. The MACD indicator has become positive, there is buying pressure, but the divergence is increasing. The price has reached the daily resistance zone. Under such market conditions, buy trades should be considered on the lower time frames from the support level of 1.3390. The best way to sell is to consider the resistance level of 1.3531 or 1.3561, but only after an additional confirmation in the form of a false breakout.

Alternative scenario: if the price breaks down and consolidates below the 1.3212 support level, the downtrend will likely resume.

USD/CAD
There is no news feed for today.

By JustForex


This article reflects a personal opinion and should not be interpreted as an investment advice, and/or offer, and/or a persistent request for carrying out financial transactions, and/or a guarantee, and/or a forecast of future events.

Global indices continue to be under pressure due to monetary policy tightening by leading central banks

By JustForex

The US indices continue to be under pressure due to the aggressive roadmap of the US Federal Reserve. At the close of trading on Tuesday, the Dow Jones index (US30) decreased by 0.35%, while the S&P 500 index (US500) lost 0.84%. The NASDAQ Technology Index (US100) fell by 1.37% yesterday.

Ahead of the Fed’s remaining meetings in 2022, analysts believe there will likely be another 75 basis point hike in November before the pace slows to 50 basis points in December as the Fed approaches the rate cap in early 2023. The Fed is likely to leave the discount rate at this capped level for a while before the economy eventually slows down. The gap between fighting inflation and adapting to growth is becoming increasingly difficult as the Fed hopes to cut the discount rate to neutral.

Equity markets in Europe mostly fell yesterday. Germany’s DAX (DE30) fell by 1.84%, France’s CAC 40 (FR40) decreased by 1.87%, Spain’s IBEX 35 (ES35) lost 1.24%, Britain’s FTSE 100 (UK100) closed down by 1.08%.

The Bank of England raised the interest rate to the highest level in 14 years. Money markets now expect another 50 basis point increase in November. The current issues affecting the Bank of England are a weak pound, fiscal policy, high energy prices, a technical recession with two consecutive quarters of GDP contraction, and a hawkish Federal Reserve stance. Experts believe that financial support from the UK government may stabilize inflationary pressures in the short term but will lead to higher inflation in the medium and long term.

The Swiss National Bankм(SNB) raised interest rates by 75 basis points to push the official borrowing rate into positive territory for the first time in more than a decade. The SNB said it could not rule out further rate hikes to ensure price stability over the medium term and was prepared to be active in the foreign exchange market as needed. The SNB now expects GDP growth to be 2% this year, down half a percent from the last meeting. The central bank also noted that inflation, which was 3.5% in August, is likely to remain elevated.

Norway’s Central Bank raised its interest rate by 50 basis points and signaled that another increase is likely in November. The bank’s interest rate has reached 2.25%. Meanwhile, the inflation forecast has been revised upward, peaking at 3% in 2023 and remaining at that level through 2024.

The US Federal Reserve’s 0.75% interest rate hike Wednesday was widely expected, but the central bank’s concurrent forecast was perhaps even more hawkish than expected. That pushed US Treasury bond yields to an 11-year peak, which is more bad news for unprofitable assets such as precious metals. The overall fundamental backdrop looks unfavorable for gold, given that it has recently been largely traded as a risk asset rather than a safe-haven asset.

Buyers in the oil market are hopeful that Vladimir Putin will reduce the supply of oil in Russia so much that prices per barrel will return to triple digits. But the Federal Reserve’s influence on the flow of funds through interest rates is proving tighter than anticipated. The European Union has stepped up its plans to impose a price ceiling on Russian oil, a measure aimed at weakening Moscow’s ability to finance the war in Ukraine. Also yesterday, Nigeria’s Oil Minister Timipre Marlin Silva, speaking on behalf of the OPEC+ producers’ alliance, threatened to cut global oil production if prices continue to fall.

Moscow’s decision to partially mobilize Russian military reservists marks the biggest escalation of the Ukrainian conflict since it began. Some Russians have rushed to the country’s borders to avoid mobilization. In southeastern Ukraine, attacks from Russia have intensified, coming on the eve of pseudo-referendums planned there by Moscow’s separatists.

Asian markets traded lower yesterday. Japan’s Nikkei 225 (JP225) decreased by 0.58%, Hong Kong’s Hang Seng (HK50) ended Thursday down by 1.61%, and Australia’s S&P/ASX 200 (AU200) closed the day by 1.56%.

Japan intervened in currency to support the yen for the first time since 1998, trying to stem a 20 percent drop in the yen against the dollar this year amid a widening policy divergence with the US. Japan’s Ministry of Finance said the Central Bank would defend the 145 USD/JPY level.

Singapore’s Core Consumer Price Index (CPI) rose year-over-year to 5.1% in August, exceeding expectations of 5% and up from 4.8% in July. Spending on food and transportation contributed the most to price pressures in August. The island nation imports nearly all of its fuel and grain. The Central Bank of Singapore (MAS) has tightened policy three times this year and is likely to continue to do so to offset increased inflationary pressures.

S&P 500 (F) (US500) 3,757.99  −31.94  (−0.84%)

Dow Jones (US30) 30,076.68 −107.10 (−0.35%)

DAX (DE40) 12,531.63 −235.52 (−1.84%)

FTSE 100 (UK100) 7,159.52 −78.12 (−1.08%)

USD Index 111.29 +0.65 (+0.58%)

Important events for today:
  • – Australia Manufacturing PMI (m/m) at 02:00 (GMT+3);
  • – Japan BoJ Interest Rate Decision (Tentative);
  • – Singapore Consumer Price Index (m/m) at 08:00 (GMT+3);
  • – Australia Services PMI (m/m) at  :00 (GMT+3);
  • – Eurozone Spanish GDP (q/q) at 10:00 (GMT+3);
  • – Eurozone France Manufacturing PMI (m/m) at 10:15 (GMT+3);
  • – Eurozone France Services PMI (m/m) at 10:15 (GMT+3);
  • – Eurozone German Manufacturing PMI (m/m) at 10:30 (GMT+3);
  • – Eurozone German Services PMI (m/m) at 10:30 (GMT+3);
  • – Eurozone Manufacturing PMI (m/m) at 11:00 (GMT+3);
  • – Eurozone Services PMI (m/m) at 11:00 (GMT+3);
  • – UK Manufacturing PMI (m/m) at 11:30 (GMT+3);
  • – UK Services PMI (m/m) at 11:30 (GMT+3);
  • – Canada Retail Sales (m/m) at 15:30 (GMT+3);
  • – US Manufacturing PMI (m/m) at 16:45 (GMT+3);
  • – US Services PMI (m/m) at 16:45 (GMT+3);
  • – Switzerland SNB Chairman Jordan Speaks at 18:30 (GMT+3);
  • – US Fed Chair Powell Speaks at 21:00 (GMT+3).

By JustForex


This article reflects a personal opinion and should not be interpreted as an investment advice, and/or offer, and/or a persistent request for carrying out financial transactions, and/or a guarantee, and/or a forecast of future events.

Week Ahead: Hawkish “Fed speak” may lift USD Index to fresh two-year high

By ForexTime

Hawkish Fed officials, fresh out of the just-concluded FOMC meeting, are set to swoop in en masse on global financial markets in the coming week.

Traders and investors worldwide will be closely monitoring the slew of speeches by officials out of the world’s most influential central bank, amid these other major economic data releases and events in the final days of Q3 2022:
Monday, September 26

  • EUR: Germany September IFO business climate and expectations
  • EUR: ECB President Christine Lagarde speech
  • USD: Speeches by Boston Fed President Susan Collins, Atlanta Fed President Raphael Bostic, and Cleveland Fed President Loretta Mester

Tuesday, September 27

  • CNH: China August industrial profits
  • USD: Speeches by Fed Chair Jerome Powell, Chicago Fed President Charles Evans, St. Louis Fed President James Bullard
  • Brent: OPEC to publish World Oil Outlook

Wednesday, September 28

  • AUD: Australia August retail sales
  • EUR: ECB President Christine Lagarde speech
  • US crude: EIA weekly oil inventory report
  • USD: Speeches by San Francisco Fed President Mary Daly, Atlanta Fed President Rafael Bostic, Chicago Fed President Charles Evans

Thursday, September 29

  • NZD: New Zealand September consumer confidence
  • AUD: Australia August job vacancies
  • EUR: Germany September CPI, Eurozone September economic confidence
  • USD: US weekly initial jobless claims, 2Q GDP (final)
  • USD: Speeches by Cleveland Fed President Loretta Mester and San Francisco Fed President Mary Daly
  • Nike quarterly earnings

Friday, September 30

  • NZD: New Zealand September consumer confidence
  • JPY: Japan August jobless rate, retail sales, industrial production
  • CNH: China September PMIs
  • EUR: Eurozone August unemployment rate, September inflation
  • GBP: UK 2Q GDP (final)
  • USD: Speeches by Fed Vice Chair Lael Brainard and New York Fed President John Williams
  • Tesla’s AI day

Earlier this week, the US Federal Reserve signalled its intent to send US interest rates even higher than expected.

Such policy signals then spurred the US dollar onto greater heights, while dragging many of its major peers to fresh lows, including:

  • EURUSD: trading below parity, lowest since 2002
  • GBPUSD: trading below 1.13, lowest since 1985
  • USDJPY: spiked briefly above 145, Yen’s weakest against US dollar since 1998 (before USDJPY eased back lower due to currency intervention by Japan’s Ministry of Finance).

READ MORE: Why FX markets react to central banks?

And there’s still room for the US dollar to climb even higher.

This is because, somewhat oddly, markets have yet to fully price in another 75-basis point hike for the next FOMC meeting in early November. And that’s despite the hawkish signals out of the just-concluded FOMC meeting earlier this week.

The odds for a fourth consecutive 75bps hike (at November FOMC meeting) currently stand at 85.6% at the time of writing.

And if those odds are ramped up closer to 100%, encouraged by Fed officials who continue banging on the same hawkish drums in the coming week in drilling home the message that US interest rates will continue to push higher and stay elevated for longer in the central bank’s quest to quash stubbornly-high inflation, that may well push the equally-weighted USD index to the 1.25 mark, levels not seen since the onset of the global pandemic in 2020.

Furthermore, if there’s also a ramping up of geopolitical tensions in the days ahead, that should spur more demand for the greenback as a safe haven asset.

But first, we could see an immediate pullback for this USD index, seeing as its relative strength index is on the cusp of breaking into overbought territory.


Forex-Time-LogoArticle by ForexTime

ForexTime Ltd (FXTM) is an award winning international online forex broker regulated by CySEC 185/12 www.forextime.com