
By InvestMacro
Here are the latest charts and statistics for the Commitment of Traders (COT) data published by the Commodities Futures Trading Commission (CFTC).
The latest COT data is updated through Tuesday September 20th and shows a quick view of how large traders (for-profit speculators and commercial entities) were positioned in the futures markets.
Large drop in Gold bets leads Weekly Speculator Changes
The COT precious metals speculator bets were higher overall this week as three out of the five metals markets we cover had higher positioning this week while the other two markets had lower contracts.
Free Reports:
 Download Our Metatrader 4 Indicators – Put Our Free MetaTrader 4 Custom Indicators on your charts when you join our Weekly Newsletter
 Get our Weekly Commitment of Traders Reports - See where the biggest traders (Hedge Funds and Commercial Hedgers) are positioned in the futures markets on a weekly basis.
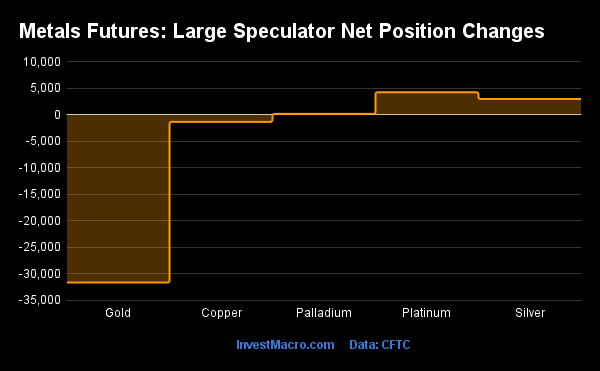
Leading the gains for the precious metals markets was Platinum (4,269 contracts) with Silver (3,000 contracts) and Palladium (192 contracts) also showing positive weeks.
The metals markets leading the declines in speculator bets this week were Gold (-31,622 contracts) with Copper (-1,300 contracts) also registering lower bets on the week.
Highlighting the COT Metals data this week was the sharp and continued decline in the Gold futures bets. Speculators dropped their Gold net positions this week by largest one-week amount in the past thirty-three weeks. The Gold position has now fallen for six straight weeks and by a total of -77,129 contracts over that 6-week time period. This bearishness has pushed the overall net positioning to a total of just +65,722 contracts, marking the lowest overall standing for Gold since April 23rd of 2019, a span of 178 weeks. The current investing environment has been a challenging one for Gold and the futures price this week touched the lowest level since April of 2020. Gold closed the week down over 1.6% and right around the $1,655.60 level.
| Sep-20-2022 | OI | OI-Index | Spec-Net | Spec-Index | Com-Net | COM-Index | Smalls-Net | Smalls-Index |
|---|---|---|---|---|---|---|---|---|
| WTI Crude | 1,481,545 | 1 | 239,878 | 8 | -261,568 | 94 | 21,690 | 36 |
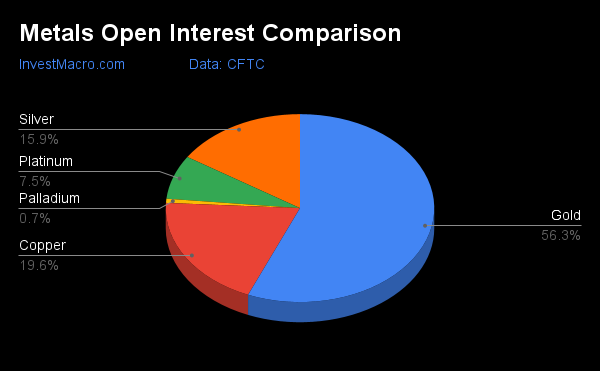
| Gold | 469,395 | 5 | 65,722 | 0 | -75,428 | 100 | 9,706 | 0 |
| Silver | 132,107 | 0 | -1,640 | 12 | -5,629 | 90 | 7,269 | 4 |
| Copper | 163,058 | 4 | -20,286 | 22 | 23,215 | 82 | -2,929 | 8 |
| Palladium | 5,993 | 1 | -1,081 | 17 | 1,261 | 82 | -180 | 33 |
| Platinum | 62,900 | 27 | 2,390 | 12 | -5,496 | 89 | 3,106 | 5 |
| Natural Gas | 960,236 | 1 | -155,711 | 32 | 121,308 | 69 | 34,403 | 62 |
| Brent | 164,025 | 11 | -37,903 | 48 | 36,732 | 54 | 1,171 | 25 |
| Heating Oil | 292,634 | 32 | 14,097 | 63 | -25,941 | 44 | 11,844 | 39 |
| Soybeans | 656,310 | 18 | 84,773 | 39 | -55,485 | 70 | -29,288 | 22 |
| Corn | 1,330,841 | 9 | 305,677 | 69 | -241,238 | 38 | -64,439 | 6 |
| Coffee | 191,433 | 5 | 41,072 | 74 | -42,998 | 30 | 1,926 | 17 |
| Sugar | 744,972 | 8 | 37,345 | 44 | -35,860 | 61 | -1,485 | 6 |
| Wheat | 285,567 | 0 | -4,029 | 14 | 9,982 | 74 | -5,953 | 80 |
Strength Scores
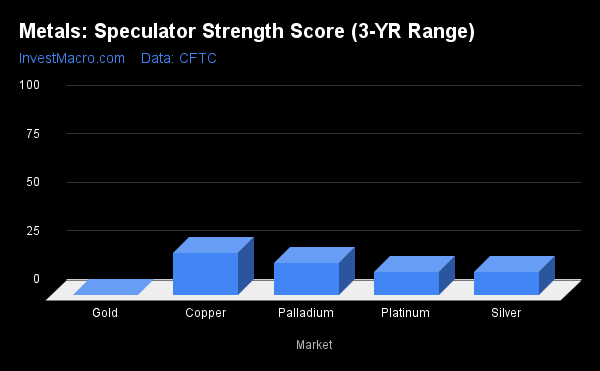
Strength scores (a measure of the 3-Year range of Speculator positions, from 0 to 100 where above 80 is extreme bullish and below 20 is extreme bearish) showed that Copper (21.7 percent) leads the metals markets with a score that is just outside an extreme bearish position of under 20 percent.
All of the other metals markets we cover continue to have scores under 20 percent with Gold at the lowest with 0.0 percent or the lowest level in three years. Silver (12.3 percent) is up over three percent from last week followed by Platinum (12.3 percent) and Palladium (16.8 percent). Platinum and Palladium are also higher than last week’s scores.
Strength Statistics:
Gold (0.0 percent) vs Gold previous week (11.0 percent)
Silver (12.3 percent) vs Silver previous week (9.0 percent)
Copper (21.7 percent) vs Copper previous week (22.7 percent)
Platinum (12.3 percent) vs Platinum previous week (6.6 percent)
Palladium (16.8 percent) vs Palladium previous week (15.7 percent)
Strength Trends
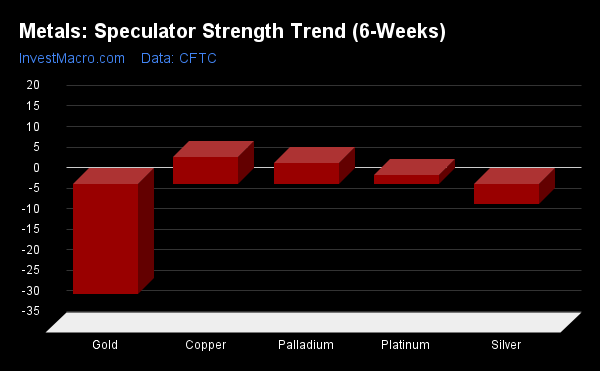
Strength Score Trends (or move index, calculates the 6-week changes in strength scores) showed that Copper (6.4 percent) leads the past six weeks trends for metals this week. Palladium (5.0 percent) and Platinum (2.1 percent) fill out the other positive movers in the latest trends data.
Gold (-26.8 percent) leads the downside trend scores with a big negative jump from last week’s -9.4 percent trend score and is followed by Silver at a trend score of -5.0 percent.
Move Statistics:
Gold (-26.8 percent) vs Gold previous week (-9.4 percent)
Silver (-5.0 percent) vs Silver previous week (-6.2 percent)
Copper (6.4 percent) vs Copper previous week (6.6 percent)
Platinum (2.1 percent) vs Platinum previous week (0.9 percent)
Palladium (5.0 percent) vs Palladium previous week (7.2 percent)
Individual COT Metals Market Charts:
Gold Comex Futures:
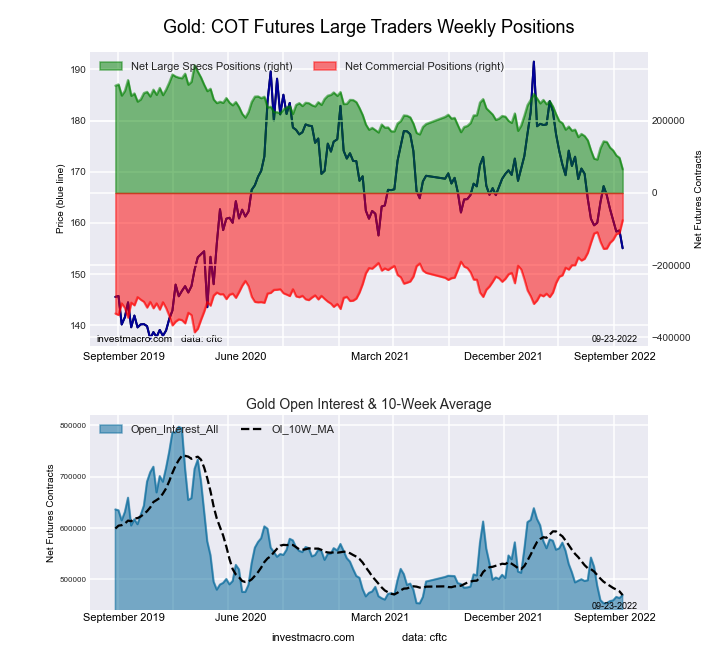 The Gold Comex Futures large speculator standing this week came in at a net position of 65,722 contracts in the data reported through Tuesday. This was a weekly fall of -31,622 contracts from the previous week which had a total of 97,344 net contracts.
This week’s current strength score (the trader positioning range over the past three years, measured from 0 to 100) shows the speculators are currently Bearish-Extreme with a score of 0.0 percent. The commercials are Bullish-Extreme with a score of 100.0 percent and the small traders (not shown in chart) are Bearish-Extreme with a score of 0.0 percent.
| Gold Futures Statistics | SPECULATORS | COMMERCIALS | SMALL TRADERS |
| – Percent of Open Interest Longs: | 45.7 | 30.2 | 8.6 |
| – Percent of Open Interest Shorts: | 31.7 | 46.3 | 6.6 |
| – Net Position: | 65,722 | -75,428 | 9,706 |
| – Gross Longs: | 214,557 | 141,862 | 40,500 |
| – Gross Shorts: | 148,835 | 217,290 | 30,794 |
| – Long to Short Ratio: | 1.4 to 1 | 0.7 to 1 | 1.3 to 1 |
| NET POSITION TREND: | |||
| – Strength Index Score (3 Year Range Pct): | 0.0 | 100.0 | 0.0 |
| – Strength Index Reading (3 Year Range): | Bearish-Extreme | Bullish-Extreme | Bearish-Extreme |
| NET POSITION MOVEMENT INDEX: | |||
| – 6-Week Change in Strength Index: | -26.8 | 25.5 | -5.2 |
Silver Comex Futures:
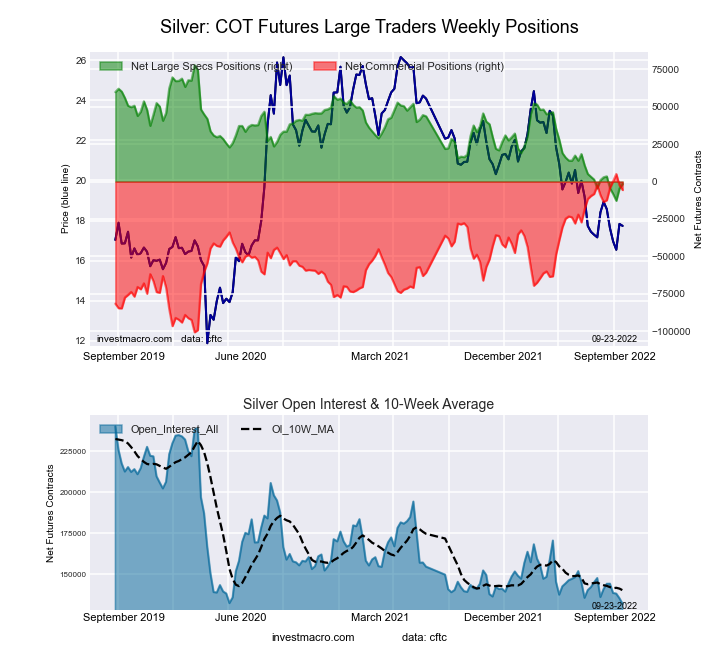 The Silver Comex Futures large speculator standing this week came in at a net position of -1,640 contracts in the data reported through Tuesday. This was a weekly lift of 3,000 contracts from the previous week which had a total of -4,640 net contracts.
This week’s current strength score (the trader positioning range over the past three years, measured from 0 to 100) shows the speculators are currently Bearish-Extreme with a score of 12.3 percent. The commercials are Bullish-Extreme with a score of 89.9 percent and the small traders (not shown in chart) are Bearish-Extreme with a score of 4.2 percent.
| Silver Futures Statistics | SPECULATORS | COMMERCIALS | SMALL TRADERS |
| – Percent of Open Interest Longs: | 39.6 | 38.3 | 16.2 |
| – Percent of Open Interest Shorts: | 40.8 | 42.6 | 10.7 |
| – Net Position: | -1,640 | -5,629 | 7,269 |
| – Gross Longs: | 52,323 | 50,661 | 21,383 |
| – Gross Shorts: | 53,963 | 56,290 | 14,114 |
| – Long to Short Ratio: | 1.0 to 1 | 0.9 to 1 | 1.5 to 1 |
| NET POSITION TREND: | |||
| – Strength Index Score (3 Year Range Pct): | 12.3 | 89.9 | 4.2 |
| – Strength Index Reading (3 Year Range): | Bearish-Extreme | Bullish-Extreme | Bearish-Extreme |
| NET POSITION MOVEMENT INDEX: | |||
| – 6-Week Change in Strength Index: | -5.0 | 7.5 | -16.6 |
Copper Grade #1 Futures:
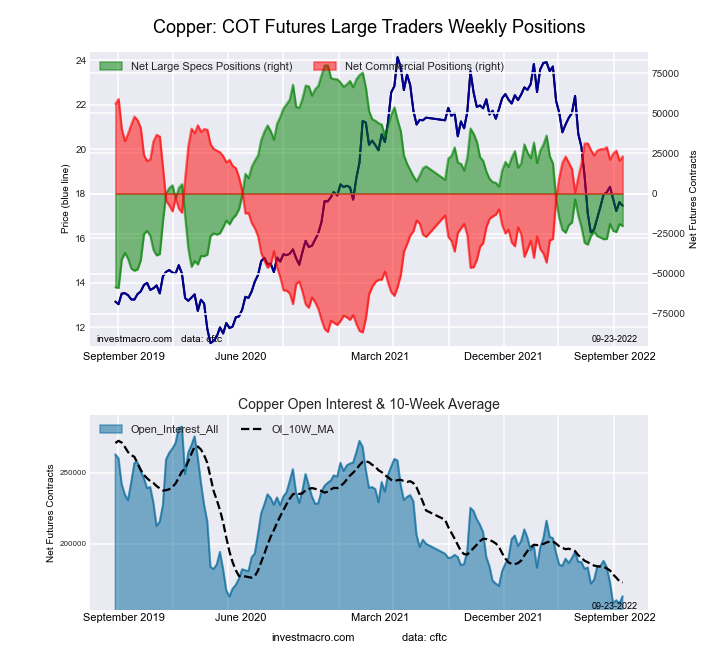 The Copper Grade #1 Futures large speculator standing this week came in at a net position of -20,286 contracts in the data reported through Tuesday. This was a weekly decrease of -1,300 contracts from the previous week which had a total of -18,986 net contracts.
This week’s current strength score (the trader positioning range over the past three years, measured from 0 to 100) shows the speculators are currently Bearish with a score of 21.7 percent. The commercials are Bullish-Extreme with a score of 81.6 percent and the small traders (not shown in chart) are Bearish-Extreme with a score of 8.4 percent.
| Copper Futures Statistics | SPECULATORS | COMMERCIALS | SMALL TRADERS |
| – Percent of Open Interest Longs: | 28.7 | 50.7 | 8.1 |
| – Percent of Open Interest Shorts: | 41.1 | 36.5 | 9.9 |
| – Net Position: | -20,286 | 23,215 | -2,929 |
| – Gross Longs: | 46,773 | 82,693 | 13,179 |
| – Gross Shorts: | 67,059 | 59,478 | 16,108 |
| – Long to Short Ratio: | 0.7 to 1 | 1.4 to 1 | 0.8 to 1 |
| NET POSITION TREND: | |||
| – Strength Index Score (3 Year Range Pct): | 21.7 | 81.6 | 8.4 |
| – Strength Index Reading (3 Year Range): | Bearish | Bullish-Extreme | Bearish-Extreme |
| NET POSITION MOVEMENT INDEX: | |||
| – 6-Week Change in Strength Index: | 6.4 | -3.3 | -21.4 |
Platinum Futures:
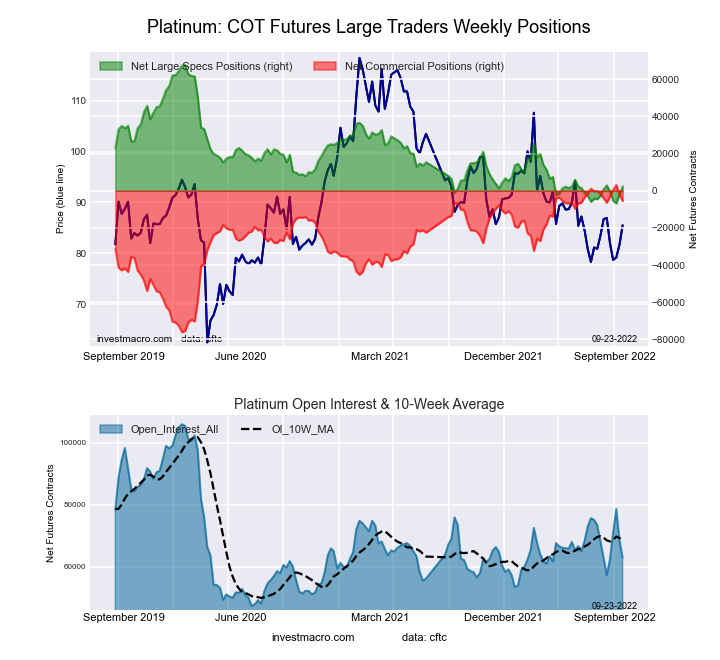 The Platinum Futures large speculator standing this week came in at a net position of 2,390 contracts in the data reported through Tuesday. This was a weekly gain of 4,269 contracts from the previous week which had a total of -1,879 net contracts.
This week’s current strength score (the trader positioning range over the past three years, measured from 0 to 100) shows the speculators are currently Bearish-Extreme with a score of 12.3 percent. The commercials are Bullish-Extreme with a score of 89.1 percent and the small traders (not shown in chart) are Bearish-Extreme with a score of 5.2 percent.
| Platinum Futures Statistics | SPECULATORS | COMMERCIALS | SMALL TRADERS |
| – Percent of Open Interest Longs: | 44.1 | 38.6 | 11.8 |
| – Percent of Open Interest Shorts: | 40.3 | 47.3 | 6.9 |
| – Net Position: | 2,390 | -5,496 | 3,106 |
| – Gross Longs: | 27,756 | 24,281 | 7,432 |
| – Gross Shorts: | 25,366 | 29,777 | 4,326 |
| – Long to Short Ratio: | 1.1 to 1 | 0.8 to 1 | 1.7 to 1 |
| NET POSITION TREND: | |||
| – Strength Index Score (3 Year Range Pct): | 12.3 | 89.1 | 5.2 |
| – Strength Index Reading (3 Year Range): | Bearish-Extreme | Bullish-Extreme | Bearish-Extreme |
| NET POSITION MOVEMENT INDEX: | |||
| – 6-Week Change in Strength Index: | 2.1 | -1.8 | -1.4 |
Palladium Futures:
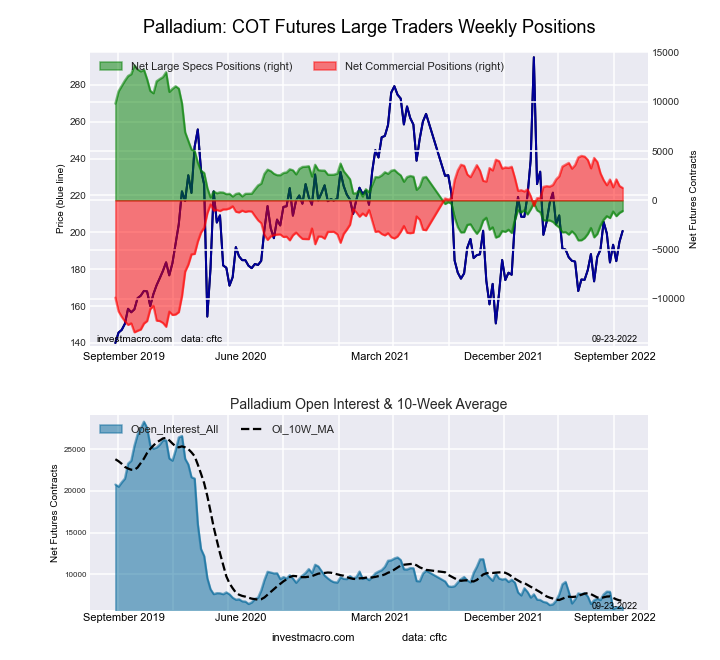 The Palladium Futures large speculator standing this week came in at a net position of -1,081 contracts in the data reported through Tuesday. This was a weekly advance of 192 contracts from the previous week which had a total of -1,273 net contracts.
This week’s current strength score (the trader positioning range over the past three years, measured from 0 to 100) shows the speculators are currently Bearish-Extreme with a score of 16.8 percent. The commercials are Bullish-Extreme with a score of 81.8 percent and the small traders (not shown in chart) are Bearish with a score of 33.4 percent.
| Palladium Futures Statistics | SPECULATORS | COMMERCIALS | SMALL TRADERS |
| – Percent of Open Interest Longs: | 22.9 | 59.9 | 15.5 |
| – Percent of Open Interest Shorts: | 40.9 | 38.9 | 18.5 |
| – Net Position: | -1,081 | 1,261 | -180 |
| – Gross Longs: | 1,371 | 3,592 | 930 |
| – Gross Shorts: | 2,452 | 2,331 | 1,110 |
| – Long to Short Ratio: | 0.6 to 1 | 1.5 to 1 | 0.8 to 1 |
| NET POSITION TREND: | |||
| – Strength Index Score (3 Year Range Pct): | 16.8 | 81.8 | 33.4 |
| – Strength Index Reading (3 Year Range): | Bearish-Extreme | Bullish-Extreme | Bearish |
| NET POSITION MOVEMENT INDEX: | |||
| – 6-Week Change in Strength Index: | 5.0 | -4.4 | -6.1 |
Article By InvestMacro – Receive our weekly COT Newsletter
*COT Report: The COT data, released weekly to the public each Friday, is updated through the most recent Tuesday (data is 3 days old) and shows a quick view of how large speculators or non-commercials (for-profit traders) were positioned in the futures markets.
The CFTC categorizes trader positions according to commercial hedgers (traders who use futures contracts for hedging as part of the business), non-commercials (large traders who speculate to realize trading profits) and nonreportable traders (usually small traders/speculators) as well as their open interest (contracts open in the market at time of reporting). See CFTC criteria here.

- Geopolitical and macroeconomic conditions continue to pressure market sentiment Jul 20, 2026
- USD/JPY Poised to Continue Gains as Expensive Oil and Lack of Support Weigh on Yen Jul 20, 2026
- COT Metals Charts: Weekly Speculator Bets led by Copper & Steel Jul 18, 2026
- COT Bonds Charts: Weekly Speculator Bets led by 2-Year, SOFR 3M & 5-Year Bonds Jul 18, 2026
- COT Energy Charts: Weekly Speculator Bets led by Brent Oil & Heating Oil Jul 18, 2026
- COT Soft Commodities Charts: Weekly Speculator Bets led by Wheat, Corn & Soybean Meal Jul 18, 2026
- The Bank of Canada kept its interest rate unchanged. Platinum prices reached a three‑week high Jul 16, 2026
- Stock indices rose after the release of US inflation data. China’s GDP slowed sharply Jul 15, 2026
- GBP/USD Awaits Political News: What Will Happen Next Jul 15, 2026
- USD/JPY Holds at Highs: Pressure Lingers on Yen Jul 14, 2026