Chart Spotlight: Dollar General (DG)

By Ino.com

Investors may want to keep an eye on discount retailers, like Dollar General (DG).

For one, the latest pullback may be a great buy opportunity.

If you take a look at this chart, you’ll notice that Williams’ %R, Fast Stochastics, and RSI are all starting to pivot well off oversold conditions. With patience, I’d like to see the Dollar General stock retest $260 resistance, near-term from $241.65 support.

Unlock $2,600 in Investing Resources – Learn More >>

DG Chart With Trade Triangles

Source: MarketClub
 

Two, while other major retailers take a hit with inflation, Dollar General is rising because of inflation. In fact, we can see that with the company’s recent earnings report.

Not only did Dollar General report second quarter EPS of $2.98, which was better than the expected $2.94 a share, sales were up to $9.4 billion, same-store sales were up 4.6% as compared to expectations for 3.9%. The company even increased its same-store sales forecast to a range of 4% to 4.5% for the fiscal year, from a prior call for 3% to 3.5%.

Three, wealthier people are now shopping at dollar stores because of inflation.

According to Business Insider, Todd Vasos, CEO of Dollar General, said on a call with analysts that the store saw a rise in higher-income households shopping there, “which we believe reflects more consumers choosing Dollar General as they seek value.”

Plus, we have to realize consumers are “trying to make ends meet, and when you have limited funds in your wallet, the dollar stores provide the ability to do that,” added Joseph Feldman, a senior analyst at Telsey Advisory Group, as quoted by The New York Times.

In addition, analysts seem to like the DG stock, as well.

Guggenheim analyst John Heinbockel reiterated a buy on the stock. Piper Sandler raised its price target on DG to $273 from $265. Raymond James raised its target price to $285 from $160. Morgan Stanley raised its target to $270 from $250. Deutsche Bank says Dollar General is one of the few stable retailers.

Plus, Dollar General will also pay a dividend shortly.

On August 23, 2022, the Company’s Board of Directors declared a quarterly cash dividend of $0.55 per share on the Company’s common stock, payable on or before October 18, 2022 to shareholders of record on October 4, 2022.

All things considered, investors may want to use recent DG weakness as an opportunity.

Ian Cooper
INO.com Contributor

The above analysis of Dollar General (DG) was provided by financial writer Ian Cooper. Ian Cooper is not a Registered Investment Advisor or Financial Planner. This writing is for informational purposes only. It does not constitute an offer to sell, a solicitation to buy, or a recommendation regarding any securities transaction. The information contained in this writing should not be construed as financial or investment advice on any subject matter. Ian Cooper expressly disclaims all liability in respect to actions taken based on any or all of the information on this writing.

By Ino.com – See our Trader Blog, INO TV Free & Market Analysis Alerts

Source: Chart Spotlight: Dollar General (DG)

Japanese Candlesticks Analysis 05.09.2022 (GOLD, NZDUSD, GBPUSD)

Article By RoboForex.com

XAUUSD, “Gold vs US Dollar”

Near the support level, gold has formed yet another reversal pattern Hammer. Currently, going by the pattern, the pair might end up in an ascending impulse. The goal of growth can be 1720.50. However, the quotes might still fall to 1690.50 and continue the downtrend without testing the resistance level.

XAUUSD
Risk Warning: the result of previous trading operations do not guarantee the same results in the future

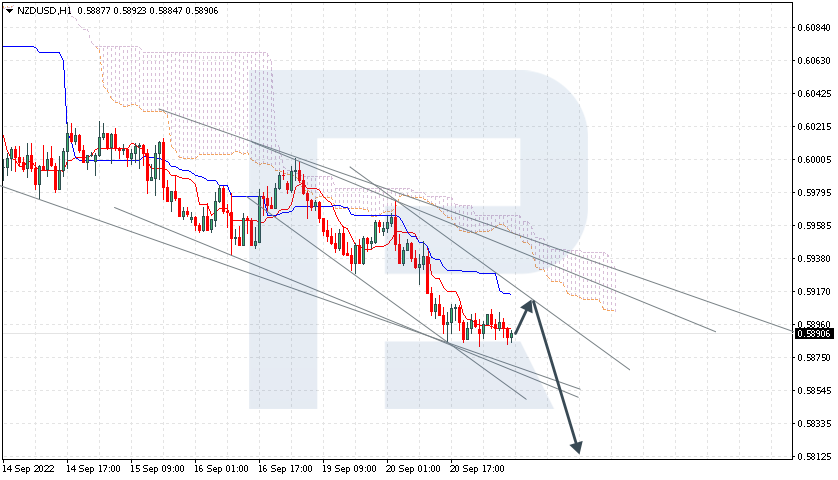
NZDUSD, “New Zealand Dollar vs US Dollar”

On H4, at the support level, the pair has formed an Engulfing reversal pattern. Going by the pattern, the pair might currently end up with an ascending impulse. The goal of growth might be 0.6190. After the resistance level is broken away, the quotes might continue the uptrend. However, the price can pull back to 0.6045 before continuing growth.

NZDUSD
Risk Warning: the result of previous trading operations do not guarantee the same results in the future

GBPUSD, “Great Britain Pound vs US Dollar”

On H4, at the support level, the pair has formed a Doji reversal pattern. Currently, the pair can go by the pattern in an ascending impulse. The goal of growth can be the resistance level of 1.1570; then, if the price bounces off it, the price will have a chance for further falling. However, the price might fall directly to 1.1350 without testing the resistance level.

GBPUSD

Article By RoboForex.com

Attention!
Forecasts presented in this section only reflect the author’s private opinion and should not be considered as guidance for trading. RoboForex LP bears no responsibility for trading results based on trading recommendations described in these analytical reviews.

The cryptocurrency market digest (BTC, Etherium). Overview for 05.09.2022

Article By RoboForex.com

The BTC is going down smoothly. On Monday, 5 September, it is retreating to 19,854 USD. Over the last two weeks, the BTC has secured inside a flat of 19,500-20,560 USD. To begin some noticeable growth, the crypto needs to secure above 22,000 USD. In all other cases, the main scenario will imply a smooth decline to 18,000 USD at least.

Sales in the US stock market are unlikely to stop. To tell you the truth, there is virtually nothing that could stop them: after mixed statistics on the US employment market appeared, platforms started waiting for the September meeting of the Fed. The employment sector is stressed, though it is not yet visible in all the indices. However, the Fed will hardly be sympathetic to the problems of the labour market and will keep on increasing the interest rate until inflation gets back under control.

On Monday, markets will be calm because of the Labour Day.

The capitalisation of the crypto market today is estimated as 957.44 billion USD. The BTC takes up 39.6%, the ETH – 20.03%, and the Tether – 6.94%.

Buterin: Terra leaves for good

The co-founder of Ethereum Vitalik Buterin thinks that the default of Terra Form Labs provides some advantages for the crypto market. For example, the decline of prices revealed some problems that have been around since the very start of the crypto industry. And yet only during a crisis it became obvious that models of algorithmic stablecoins are irrelevant.

Ethereum 2.0: network activity renews highs

There is a bit more than a week left until the update of the Ethereum network, and the anticipation of the PoS algorithm has heated up network activity. For example, the number of unique addresses grew to 204.57 billion; the index grew by 2 million over a month. According to Etherscan data, the network has been acquiring 70 thousand addresses a day.

Tesla, Blockstream, and Block will mine BTC

Three companies – Tesla, Blockstream, and Block – are going to join forces in mining the BTC using solar energy. They plan to build a data centre in Texas; investments are estimated for 12 million USD. This new project might be a part of the concept of using 100% renewable energy for mining the BTC.

Article By RoboForex.com

Attention!
Forecasts presented in this section only reflect the author’s private opinion and should not be considered as guidance for trading. RoboForex LP bears no responsibility for trading results based on trading recommendations described in these analytical reviews.

The Analytical Overview of the Main Currency Pairs on 2022.09.05

By JustForex

The EUR/USD currency pair

Technical indicators of the currency pair:
  • Prev Open: 0.9943
  • Prev Close: 0.9950
  • % chg. over the last day: +0.07 %

Friday’s employment report (Non-Farm Payrolls) for August was mixed: while the economy added more jobs than expected, wage growth slowed, and the unemployment rate rose. Thus, investors are still trying to determine which interest rate hike (50 bps or 75 bps) the US Federal Reserve will choose at its next meeting. Today is a bank holiday in the USA, that’s why volatility will be low during the American session. On the other hand, in the European session, there will be a lot of economic data on the business activity in the service sector.

Trading recommendations
  • Support levels: 0.9912
  • Resistance levels: 0.9988, 1.0016, 1.0112, 1.0046, 1.0077, 1.0111, 1.0150

From the technical point of view, the trend on the EUR/USD currency pair on the hourly time frame is bearish. EUR/USD quotes are trading below parity again. Technically, there is a formation of a wide balance with a range of 0.9912-1.0077. The MACD indicator is negative again, and the selling pressure remains, but there are the first signs of divergence. Under such market conditions, it is best to look for buy trades on intraday time frames after a false breakdown of the support level of 0.9912, because a lot of liquidity has accumulated behind this level. Sell trades can be considered from the resistance levels of 0.9988 or 1.0016, but only after the additional confirmation.

if the price breaks out of the 1.0077 resistance level and fixes above, the uptrend will likely resume.

EUR/USD
News feed for 2022.09.05:
  • – Spanish Service PMI (m/m) at 10:15 (GMT+3);
  • – Italian Service PMI (m/m) at 10:45 (GMT+3);
  • – French Service PMI (m/m) at 10:50 (GMT+3);
  • – German Service PMI (m/m) at 10:55 (GMT+3);
  • – Eurozone Service PMI (m/m) at 11:00 (GMT+3);
  • – Eurozone Retail Sales (m/m) at 12:00 (GMT+3).

The GBP/USD currency pair

Technical indicators of the currency pair:
  • Prev Open: 1.1541
  • Prev Close: 1.1496
  • % chg. over the last day: -0.39 %

The widening of the interest rate differential is one of the main reasons why GBP/USD quotes are falling. The actions taken by the Bank of England have so far failed to compensate for the downward pressure on the currency due to the increasingly acute balance of payments problem caused by the energy crisis. Britain is a large net importer of energy, and the sharp rise in oil and gas prices this year has adversely affected its terms of trade, leading to a record current account deficit for the country in the first quarter. This current account deficit is likely to be complemented by a growing budget deficit if Foreign Secretary Liz Truss (the favorite according to the polls) wins the vote, the results of which will be announced Monday.

Trading recommendations
  • Support levels: 1.1500, 1.1400
  • Resistance levels: 1.1558, 1.1669, 1.1816, 1.1901, 1.1994, 1.2035, 1.2167

From the technical point of view, the trend on the GBP/USD currency pair on the hourly time frame is bearish. Throughout last week the British pound was declining against the US dollar. At the moment the price is trading below the moving averages, the MACD indicator is in the negative zone, but the divergence is increasing. At the moment, it is best to look for sell trades on intraday time frames, the nearest resistance level is 1.1558. Buy trades can be considered from the support level of 1.1500, but only after an additional confirmation in the form of a reverse initiative.

Alternative scenario: if the price breaks out through the 1.1817 resistance level and fixes above, the uptrend will likely resume.

GBP/USD
News feed for 2022.09.05:
  • – UK Service PMI (m/m) at 11:30 (GMT+3).

The USD/JPY currency pair

Technical indicators of the currency pair:
  • Prev Open: 140.11
  • Prev Close: 140.20
  • % chg. over the last day: +0.04 %

The USD/JPY traded almost unchanged on Friday. The price is now near the level of 140, which was last seen in 1998. There is increasing pressure on Japanese officials to support the currency. At the moment, the Bank of Japan is pursuing an ultra-soft monetary policy and is keeping interest rates below 0, while the US Federal Reserve is in a cycle of rate hikes. If the Japanese government does not interfere in its monetary policy, USD/JPY will continue to rise.

Trading recommendations
  • Support levels: 139.61, 138.78, 137.65, 136.80, 135.20
  • Resistance levels: 141.00, 142.00

From the technical point of view, the medium-term trend on the currency pair USD/JPY is bullish. The price is trading above the average lines, and the buyers’ pressure is still there. The MACD indicator remains positive, but there are signs of divergence, which means that a technical correction will take place soon. Under such market conditions buy trades can be sought from the support level of 139.60, but with additional confirmation. Sell deals can be considered on the intraday time frames, but only with additional confirmation, as fundamentally, USD/JPY quotes are inclined to grow.

Alternative scenario: If the price fixes below 137.65, the downtrend will likely resume.

USD/JPY
News feed for 2022.09.05:
  • – Japan Service PMI (m/m) at 03:30 (GMT+3).

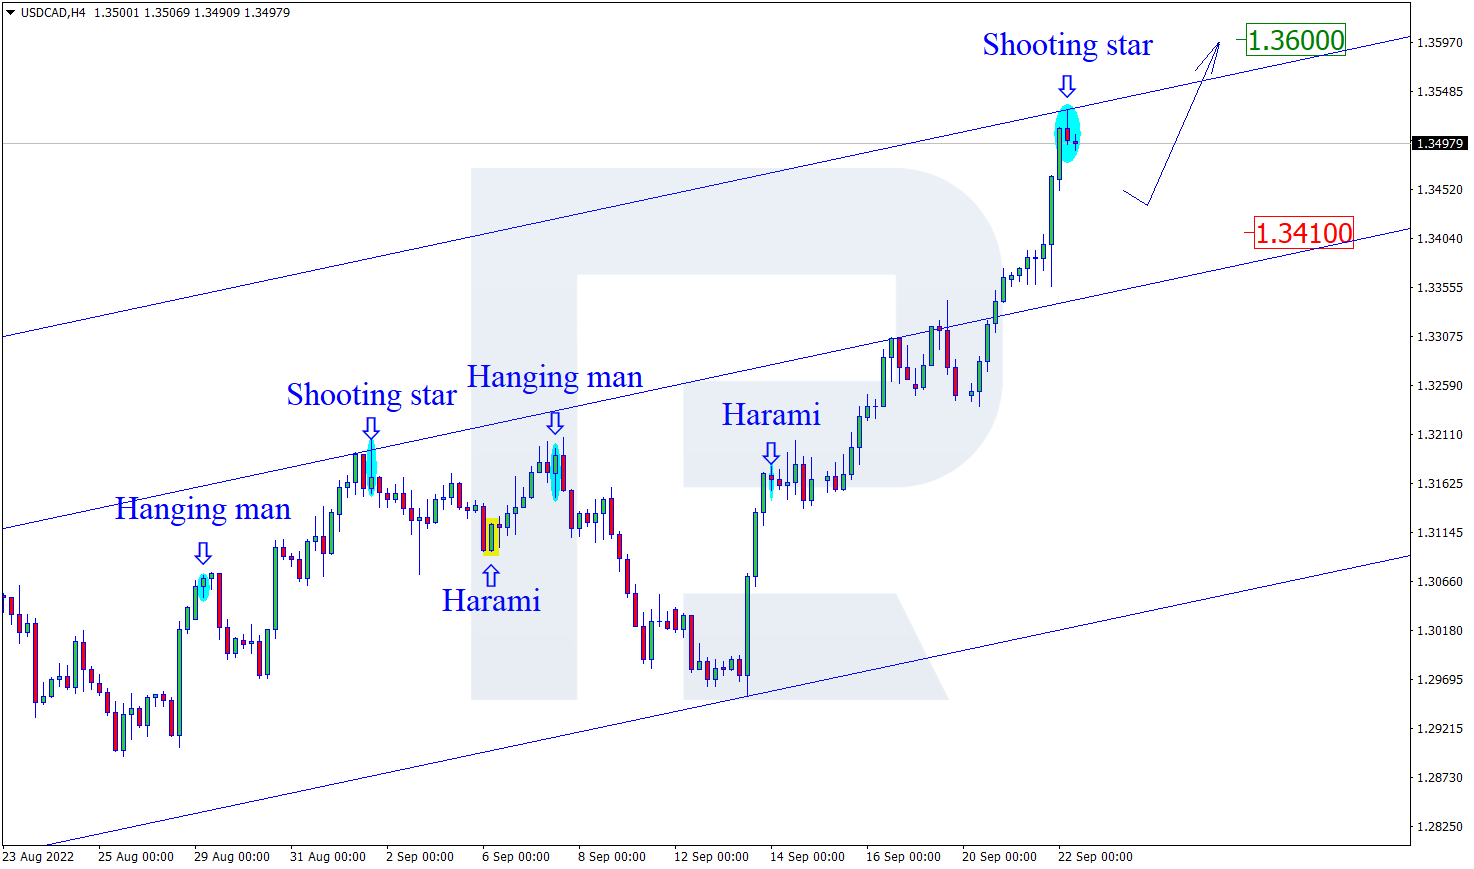
The USD/CAD currency pair

Technical indicators of the currency pair:
  • Prev Open: 1.3156
  • Prev Close: 1.3124
  • % chg. over the last day: +0.24 %

According to preliminary data from Statistics Canada, the Canadian economy contracted in July after four consecutive quarters of growth. The country’s annualized economic growth rate was 3.3% in the second quarter, below the federal agency’s preliminary estimate of a 4.6% annualized rate. Some experts have warned that the sluggish second-quarter numbers are an early sign that the country is headed for a recession. Economists usually define recession as two consecutive quarters of negative GDP.

Trading recommendations
  • Support levels: 1.3077, 1.3020, 1.2989, 1.2958, 1.2936, 1.2900
  • Resistance levels: 1.3220

From the point of view of technical analysis, the trend on the USD/CAD currency pair is bullish. The price is now trading above the moving averages. Now the price is trading at the level of moving averages, the indicator MACD has become negative, and the price is correcting. Under such market conditions, buy trades should be considered on the lower time frames from the support level of 1.3077 or 1.3020, but only with confirmation. For sell deals, it is better to consider the resistance level of 1.3220, but only after a false breakout, as the level has already been tested and a lot of liquidity has been formed above the level.

Alternative scenario: if the price breaks down and consolidates below the 1.2989 support level, the downtrend will likely resume.

USD/CAD
There is no news feed for today.

By JustForex


This article reflects a personal opinion and should not be interpreted as an investment advice, and/or offer, and/or a persistent request for carrying out financial transactions, and/or a guarantee, and/or a forecast of future events.

Europe’s energy crisis intensifies again. Britain chooses a new prime minister

By JustForex

The US stock indices ended the week lower on Friday, as early gains amid a report on Nonfarm Payrolls were overshadowed by worries about the energy crisis in Europe. The US economy added 315,000 jobs in August, still a solid indicator showing that the economy remains resilient despite rising interest rates, high inflation, and sluggish consumer spending. Friday’s government report also showed that the unemployment rate rose to 3.7% from a low of 3.5%. Analysts believe the decline in US job gains in August may help the Fed’s fight against inflation. At the close of trading on Friday the Dow Jones index (US30) decreased by 1.07% (-2.70% for the week) and the S& P 500 (US500) lost 1.07% (-2.73% for the week). The Technology Sector Index NASDAQ (US100) fell by 0.31% (-1.06% for the week).

Equity markets in Europe were mostly up on Friday. German DAX (DE30) gained 3.33% (+1.65% for the week), French CAC 40 (FR40) jumped by 2.21% (-0.51% for the week), Spanish IBEX 35 (ES35) added 1.62% (-0.48% for the week) and British FTSE 100 (UK100) closed the day up 1.86% (-2.65% for the week).

The UK lagged behind India to become the world’s sixth-largest economy, dealing another blow to the government in London, which has been struggling with a steep drop in the cost of living. Britain’s fall in the international rankings is not a pleasant backdrop for the new prime minister. British Foreign Secretary Liz Truss said Sunday that she would take immediate action in her first week in office to address rising energy bills and increased energy supplies if appointed prime minister. Truss said she would bravely fight the falling economy, repeating her promise to stimulate growth to fix a long list of problems. The Sunday Times newspaper, citing insiders at the Treasury Department, said the cost of Truss’ plan would easily exceed 100 billion pounds ($115 billion), most of which would be added to government borrowing. The winner with the most Conservative votes will be announced on Monday, and the next day the new prime minister will meet with Queen Elizabeth and ask her to form a government.

Oil prices declined over the summer amid uncertainty about demand prospects due to China’s COVID-19 restraint and as central banks around the world raised interest rates to combat rising inflation, affecting the global economic outlook. The Organization of Petroleum Exporting Countries and its allies, including Russia, are scheduled to meet Monday. Energy traders will be paying close attention to the event, especially after Saudi Arabia raised the possibility of production cuts. OPEC+ last week revised its market balances for this year and now sees demand lagging supply by 400,000 BPD versus the 900,000 BPD previously projected. The producer group expects a market deficit of 300,000 BPD in the baseline scenario for 2023.

This week, the escalating energy dispute between Russia and the West will draw investors’ attention. Moscow has closed its main gas pipeline to Germany for an indefinite period. The closure of the Nord Stream pipeline, which Russia says will last as long as it takes to make repairs, has exacerbated fears of a winter gas shortage that could lead to a recession in major economies and lead to energy rationing. Europe accused Russia of using energy as a weapon in what Moscow called an “economic war” with the West following Russia’s invasion of Ukraine. Moscow blamed Western sanctions and technical problems for supply disruptions.

Asian markets traded lower last week. Japan’s Nikkei 225 (JP225) decreased by 1.81% for the week, Hong Kong’s Hang Seng (HK50) was down by 2.55% for the week, and Australia’s S& P/ASX 200 (AU200) closed down by 3.88% for the week.

In the commodities market, orange juice futures showed the largest rise in price by the end of the week (+5.44%). Futures on gasoline (-13.73%), cotton (-12.3%), copper (-8.01%), Brent oil (-7.63%), WTI oil (-6.24%), palladium (-4.71%), lumber (-4.65%), silver (-4.46%), coffee (-4.14%), natural gas (-3.96%), and soybeans (-2.84%) showed the biggest drop.

S&P 500 (F) (US500) 3,924.26 −42.59 (−1.07%)

Dow Jones (US30) 31,318.44 −337.98 (−1.07%)

DAX (DE40) 13,050.27 +420.0 (+3.33%)

FTSE 100 (UK100) 7,281.19 +132.69 (+1.86%)

USD Index 109.61 -0.08 (-0.07%)

Important events for today:
  • – Japan Service PMI (m/m) at 03:30 (GMT+3);
  • – Australia Retail Sales (m/m) at 04:30 (GMT+3);
  • – Switzerland GDP (q/q) at 10:00 (GMT+3);
  • – Spanish Service PMI (m/m) at 10:15 (GMT+3);
  • – Italian Service PMI (m/m) at 10:45 (GMT+3);
  • – French Service PMI (m/m) at 10:50 (GMT+3);
  • – German Service PMI (m/m) at 10:55 (GMT+3);
  • – Eurozone Service PMI (m/m) at 11:00 (GMT+3);
  • – UK Service PMI (m/m) at 11:30 (GMT+3);
  • – Eurozone Retail Sales (m/m) at 12:00 (GMT+3);
  • – OPEC+ Meeting (m/m) at 13:00 (GMT+3).

By JustForex


This article reflects a personal opinion and should not be interpreted as an investment advice, and/or offer, and/or a persistent request for carrying out financial transactions, and/or a guarantee, and/or a forecast of future events.

Trade Of The Week: Can ECB Hawks Rescue Euro Bulls?

By ForexTime 

– The fierce war against inflation is set to continue this week with more central banks heavily armed, locked, and loaded for battle.

Our focus falls on the European Central Bank (ECB) which is expected to unleash a monetary bazooka in the form of a 75-basis point rate increase! Such a move will place the ECB among the ranks of 40+ central banks that have increased rates by 75bp or more in one go this year in the face of soaring inflation.

Before we take a deep dive into what to expect from the ECB meeting on Thursday, it is worth keeping in mind that the Eurozone economy remains vulnerable and faces the growing risk of recession. The unsavoury combination of ongoing geopolitical tensions, untamed inflation, and energy crisis continues to darken the outlook for Europe with the latest development revolving around Russia’s Gazprom dumping salt into the wound.

Interestingly the euro was able to hold its ground versus most G10 currencies in August excluding the dollar. However, things are not looking too pretty quarter-to-date with the euro down roughly 5.6% against the king of the currency space.

Since the EURUSD secured a solid daily close below parity back in late August, prices have struggled to push higher thanks to technical and fundamental factors.

The outlook for the EURUSD remains bearish on the daily, weekly, and monthly timeframe with prices wobbling above 0.9900 as of writing. Given how the ECB is expected to join the jumbo hike club, could this be enough to cushion the downside and rescue euro bulls?

The low down…

Eurozone inflation hit a new record high in August at 9.1%.

This was higher than the 8.9% witnessed in July and above the 9% market forecast. With inflation hitting such lofty and uncomfortable levels, market expectations intensified over the ECB adopting an aggressive approach toward rates in an effort to cap inflation. According to Bloomberg, traders and predicting a 66% probability of a 75 bp rate hike in September. It does not end here.

Last Friday, Gazprom made a last-minute decision to suspend natural gas flows through the Nord Stream 1 pipeline – ultimately worsening the squeeze on Europe’s energy supplies. This move is likely to expose the economy to downside shocks and create more uncertainty and fuel inflationary pressures as gas prices soar.

What to expect from ECB?

Before thinking about what to expect from the ECB on Thursday, there are a couple of things to keep in mind before the big day. ECB hawks are certainly in the building but the question is how much resolve they have to tame inflation. It’s worth keeping in mind that the latest ECB economic forecasts could offer fresh insight into inflation expectations. It will be interesting to see what the central bank has to say about the energy crises and whether this will push the Eurozone into recession. Let’s not forget about the depreciating euro and how it could impact the central bank’s policy outlook.

Possible outcomes on Thursday

  • ECB hikes rates by 75 basis points and strikes hawkish tone opening doors to further jumbo hikes. This move may inject euro bulls with fresh inspiration, pushing the EURUSD back above parity towards 1.0100. However, upside gains may be capped by the gloomy outlook for the Eurozone.
  • ECB hikes rates by 75 bp but expresses concern over the economic outlook, reducing bets of more aggressive hikes down the road. Euro pops higher but bears seize control – limiting gains below parity
  • ECB surprises markets with a 50 bp hike and strikes dovish tone, this could excite euro bears – triggering a selloff that breaches the 0.9900 floor.

EURUSD: The path of least resistance south…

As the subtitle says, the path of least resistance for the EURUSD points south.

Earlier we identified how the currency pair was bearish on the daily, weekly and monthly timeframe. Looking at the weekly timeframe, prices are respecting a bearish channel and trading well below the 50-, 100- and 200-week Simple Moving Average. Sustained weakness below parity could trigger a selloff towards 0.9700 and 0.9600, respectively. A strong weekly move back above 1.1000 may suggest an incline towards 1.0200.

Zooming in on the daily, prices remain bearish but there could be a period of consolidation if 0.9900 proves to be reliable support. A solid daily close below this level could trigger a selloff towards 0.9700. Should 0.9900 prove to be reliable support, a rebound towards parity and potentially higher could be on the cards before bears re-enter the scene.


Forex-Time-LogoArticle by ForexTime

ForexTime Ltd (FXTM) is an award winning international online forex broker regulated by CySEC 185/12 www.forextime.com

Australian dollar, Brazilian Real lead Forex Speculators bets while Euro bets hit 130-week low

By InvestMacro | COT | Data Tables | COT Leaders | Downloads | COT Newsletter

Currency Futures Open Interest Comparison

Here are the latest charts and statistics for the Commitment of Traders (COT) data published by the Commodities Futures Trading Commission (CFTC).

The latest COT Reports data is updated through Tuesday August 30th and shows a quick view of how large traders (for-profit speculators and commercial entities) were positioned in the futures markets. All currency positions are in direct relation to the US dollar where, for example, a bet for the euro is a bet that the euro will rise versus the dollar while a bet against the euro will be a bet that the euro will decline versus the dollar.

Australian dollar, Brazilian Real lead the Weekly Speculator Changes

Currency Futures Large Speculator Net Position Changes

The COT currency market speculator bets were mostly higher this week as seven out of the eleven currency markets we cover had higher positioning while the other four markets had lower speculator contracts.

Leading the gains for the currency markets was the Australian dollar (2,635 contracts) with the Brazilian real (2,494 contracts), Mexican peso (2,286 contracts), Canadian dollar (952 contracts), US Dollar Index (416 contracts), Bitcoin (332 contracts) and the Swiss franc (143 contracts) also having higher bets on the week.

The currencies leading the declines in speculator bets this week were the Euro (-3,567 contracts) and the Japanese yen (-2,724 contracts) with the New Zealand dollar (-1,650 contracts) and the British pound sterling (-1,204 contracts) also registering lower bets on the week.

Currency Speculator Positioning Notes:

Highlighting the COT Reports (Week 35) changes this week was the Brazilian real’s gains in speculator bets. The Brazilian currency has now seen higher bullish bets in three out of the past four weeks and in five out of the past seven weeks as well. Speculators had previous strong sentiment for the real in February and March with bullish bets hitting an all-time record high in March above the +50,000 contracts level. However, the bullish strength only last a few months as sharp declines hit the real in July and resulted in a net bearish position of -1,130 contracts on August 2nd. Since then, speculators have started to build back their bullish positions and pushed the current standing to +8,859 contracts this week.

Australian dollar contracts rose this week but are looking like just a small rebound after a long bearish streak. The Aussie speculator bets had fallen for six straight weeks and pushed the overall net position to the most bearish level since March 8th, a span of twenty-four weeks. Overall, the Australian dollar’s speculative position has now been in a bearish standing for sixty-seven straight weeks, dating back to May 25th of 2021.

The Swiss franc speculator positions this week improved for a fourth consecutive week and are now at the least bearish level in just about a year. The overall net standing for the franc has been in a bearish position for fifty-one straight weeks, dating back to September 14th of last year.

Finally, the Euro net speculator position declined for a third consecutive week this week and has fallen by a total of -13,140 contracts over that time-frame. These declines have dropped the Euro’s net standing, currently at -47,676 contracts, to the most bearish level in the past one hundred and thirty weeks, dating back to March 10th of 2020. The EUR/USD exchange rate has fallen back to below parity after testing these levels in July. The currency pair currently trades near 20-year lows and closed the week at the 0.9956 exchange rate.


Data Snapshot of Forex Market Traders | Columns Legend
Aug-30-2022OIOI-IndexSpec-NetSpec-IndexCom-NetCOM-IndexSmalls-NetSmalls-Index
USD Index60,1848935,51584-38,538153,02350
EUR720,08190-47,6762028,8608418,8166
GBP262,00485-29,1704951,49863-22,3280
JPY247,03087-41,5314361,28766-19,75613
CHF47,16835-2,2625115,47168-13,20913
CAD158,1653624,17967-29,039454,86040
AUD169,26759-57,3933262,50366-5,11040
NZD44,37633-3,124666,53340-3,40912
MXN206,82352-29,0301525,765843,26557
RUB20,93047,54331-7,15069-39324
BRL66,706638,85959-10,922412,06389
Bitcoin14,440841,296100-1,32703114


Bitcoin and US Dollar Index lead the Strength Scores

Strength Scores (a normalized measure of Speculator positions over a 3-Year range, from 0 to 100 where above 80 is extreme bullish and below 20 is extreme bearish) showed that Bitcoin Futures (100.0 percent) and the US Dollar Index (84.2 percent) lead the currency markets and are both in bullish extreme positions (above 80 percent). The Canadian Dollar (66.5 percent) and the New Zealand Dollar (66.0 percent) come in as the next highest in the currency markets in strength scores.

On the downside, the Mexican Peso (15.0 percent) comes in at the lowest strength level currently and is in a bearish extreme level (below 20 percent). The next lowest is the Euro (20.4 percent) followed by the Australian Dollar (31.6 percent) and the Japanese Yen (43.3 percent).

Strength Statistics:
US Dollar Index (84.2 percent) vs US Dollar Index previous week (83.5 percent)
EuroFX (20.4 percent) vs EuroFX previous week (21.5 percent)
British Pound Sterling (49.1 percent) vs British Pound Sterling previous week (50.1 percent)
Japanese Yen (43.3 percent) vs Japanese Yen previous week (45.0 percent)
Swiss Franc (50.8 percent) vs Swiss Franc previous week (50.4 percent)
Canadian Dollar (66.5 percent) vs Canadian Dollar previous week (65.4 percent)
Australian Dollar (31.6 percent) vs Australian Dollar previous week (29.2 percent)
New Zealand Dollar (66.0 percent) vs New Zealand Dollar previous week (68.8 percent)
Mexican Peso (15.0 percent) vs Mexican Peso previous week (14.0 percent)
Brazil Real (59.1 percent) vs Brazil Real previous week (56.6 percent)
Bitcoin (100.0 percent) vs Bitcoin previous week (94.2 percent)

Bitcoin, Swiss Franc and British Pound lead the 6-Week Strength Trends

Currency Futures Speculator Strength Trends (6-Weeks)

Strength Score Trends (or move index, calculates the 6-week changes in strength scores) show that Bitcoin (31.6 percent) leads the past six weeks trends for the currency markets this week. The Swiss Franc (21.9 percent), the British Pound Sterling (21.9 percent) and the Canadian Dollar (19.7 percent) fill out the other top movers in the latest trends data.

The Australian Dollar (-13.2 percent) leads the downside trend scores currently while the next market with lower trend scores were the US Dollar Index (-5.9 percent) followed by the Euro (-1.5 percent).

Strength Trend Statistics:
US Dollar Index (-5.9 percent) vs US Dollar Index previous week (-5.4 percent)
EuroFX (-1.5 percent) vs EuroFX previous week (-5.8 percent)
British Pound Sterling (21.9 percent) vs British Pound Sterling previous week (24.3 percent)
Japanese Yen (10.9 percent) vs Japanese Yen previous week (13.1 percent)
Swiss Franc (21.9 percent) vs Swiss Franc previous week (16.0 percent)
Canadian Dollar (19.7 percent) vs Canadian Dollar previous week (22.1 percent)
Australian Dollar (-13.2 percent) vs Australian Dollar previous week (-17.1 percent)
New Zealand Dollar (0.9 percent) vs New Zealand Dollar previous week (6.4 percent)
Mexican Peso (0.7 percent) vs Mexican Peso previous week (-3.4 percent)
Brazil Real (-1.6 percent) vs Brazil Real previous week (-3.8 percent)
Bitcoin (31.6 percent) vs Bitcoin previous week (19.9 percent)


Individual Markets:

US Dollar Index Futures:

US Dollar Index Forex Futures COT ChartThe US Dollar Index large speculator standing this week came in at a net position of 35,515 contracts in the data reported through Tuesday. This was a weekly lift of 416 contracts from the previous week which had a total of 35,099 net contracts.

This week’s current strength score (the trader positioning range over the past three years, measured from 0 to 100) shows the speculators are currently Bullish-Extreme with a score of 84.2 percent. The commercials are Bearish-Extreme with a score of 14.6 percent and the small traders (not shown in chart) are Bearish with a score of 49.6 percent.

US DOLLAR INDEX StatisticsSPECULATORSCOMMERCIALSSMALL TRADERS
– Percent of Open Interest Longs:85.93.09.0
– Percent of Open Interest Shorts:26.867.14.0
– Net Position:35,515-38,5383,023
– Gross Longs:51,6721,8225,431
– Gross Shorts:16,15740,3602,408
– Long to Short Ratio:3.2 to 10.0 to 12.3 to 1
NET POSITION TREND:
– Strength Index Score (3 Year Range Pct):84.214.649.6
– Strength Index Reading (3 Year Range):Bullish-ExtremeBearish-ExtremeBearish
NET POSITION MOVEMENT INDEX:
– 6-Week Change in Strength Index:-5.94.76.5


Euro Currency Futures:

Euro Currency Futures COT ChartThe Euro Currency large speculator standing this week came in at a net position of -47,676 contracts in the data reported through Tuesday. This was a weekly fall of -3,567 contracts from the previous week which had a total of -44,109 net contracts.

This week’s current strength score (the trader positioning range over the past three years, measured from 0 to 100) shows the speculators are currently Bearish with a score of 20.4 percent. The commercials are Bullish-Extreme with a score of 84.2 percent and the small traders (not shown in chart) are Bearish-Extreme with a score of 5.6 percent.

EURO Currency StatisticsSPECULATORSCOMMERCIALSSMALL TRADERS
– Percent of Open Interest Longs:28.157.211.2
– Percent of Open Interest Shorts:34.753.28.6
– Net Position:-47,67628,86018,816
– Gross Longs:202,258411,68480,871
– Gross Shorts:249,934382,82462,055
– Long to Short Ratio:0.8 to 11.1 to 11.3 to 1
NET POSITION TREND:
– Strength Index Score (3 Year Range Pct):20.484.25.6
– Strength Index Reading (3 Year Range):BearishBullish-ExtremeBearish-Extreme
NET POSITION MOVEMENT INDEX:
– 6-Week Change in Strength Index:-1.53.2-10.8


British Pound Sterling Futures:

British Pound Sterling Futures COT ChartThe British Pound Sterling large speculator standing this week came in at a net position of -29,170 contracts in the data reported through Tuesday. This was a weekly lowering of -1,204 contracts from the previous week which had a total of -27,966 net contracts.

This week’s current strength score (the trader positioning range over the past three years, measured from 0 to 100) shows the speculators are currently Bearish with a score of 49.1 percent. The commercials are Bullish with a score of 62.9 percent and the small traders (not shown in chart) are Bearish-Extreme with a score of 0.0 percent.

BRITISH POUND StatisticsSPECULATORSCOMMERCIALSSMALL TRADERS
– Percent of Open Interest Longs:22.366.07.1
– Percent of Open Interest Shorts:33.546.315.7
– Net Position:-29,17051,498-22,328
– Gross Longs:58,477172,79618,706
– Gross Shorts:87,647121,29841,034
– Long to Short Ratio:0.7 to 11.4 to 10.5 to 1
NET POSITION TREND:
– Strength Index Score (3 Year Range Pct):49.162.90.0
– Strength Index Reading (3 Year Range):BearishBullishBearish-Extreme
NET POSITION MOVEMENT INDEX:
– 6-Week Change in Strength Index:21.9-11.6-21.2


Japanese Yen Futures:

Japanese Yen Forex Futures COT ChartThe Japanese Yen large speculator standing this week came in at a net position of -41,531 contracts in the data reported through Tuesday. This was a weekly lowering of -2,724 contracts from the previous week which had a total of -38,807 net contracts.

This week’s current strength score (the trader positioning range over the past three years, measured from 0 to 100) shows the speculators are currently Bearish with a score of 43.3 percent. The commercials are Bullish with a score of 65.6 percent and the small traders (not shown in chart) are Bearish-Extreme with a score of 13.3 percent.

JAPANESE YEN StatisticsSPECULATORSCOMMERCIALSSMALL TRADERS
– Percent of Open Interest Longs:22.166.48.7
– Percent of Open Interest Shorts:38.941.616.7
– Net Position:-41,53161,287-19,756
– Gross Longs:54,513163,99121,436
– Gross Shorts:96,044102,70441,192
– Long to Short Ratio:0.6 to 11.6 to 10.5 to 1
NET POSITION TREND:
– Strength Index Score (3 Year Range Pct):43.365.613.3
– Strength Index Reading (3 Year Range):BearishBullishBearish-Extreme
NET POSITION MOVEMENT INDEX:
– 6-Week Change in Strength Index:10.9-5.8-12.0


Swiss Franc Futures:

Swiss Franc Forex Futures COT ChartThe Swiss Franc large speculator standing this week came in at a net position of -2,262 contracts in the data reported through Tuesday. This was a weekly lift of 143 contracts from the previous week which had a total of -2,405 net contracts.

This week’s current strength score (the trader positioning range over the past three years, measured from 0 to 100) shows the speculators are currently Bullish with a score of 50.8 percent. The commercials are Bullish with a score of 68.2 percent and the small traders (not shown in chart) are Bearish-Extreme with a score of 12.8 percent.

SWISS FRANC StatisticsSPECULATORSCOMMERCIALSSMALL TRADERS
– Percent of Open Interest Longs:25.357.516.8
– Percent of Open Interest Shorts:30.124.744.8
– Net Position:-2,26215,471-13,209
– Gross Longs:11,91527,1137,906
– Gross Shorts:14,17711,64221,115
– Long to Short Ratio:0.8 to 12.3 to 10.4 to 1
NET POSITION TREND:
– Strength Index Score (3 Year Range Pct):50.868.212.8
– Strength Index Reading (3 Year Range):BullishBullishBearish-Extreme
NET POSITION MOVEMENT INDEX:
– 6-Week Change in Strength Index:21.9-6.0-16.6


Canadian Dollar Futures:

Canadian Dollar Forex Futures COT ChartThe Canadian Dollar large speculator standing this week came in at a net position of 24,179 contracts in the data reported through Tuesday. This was a weekly gain of 952 contracts from the previous week which had a total of 23,227 net contracts.

This week’s current strength score (the trader positioning range over the past three years, measured from 0 to 100) shows the speculators are currently Bullish with a score of 66.5 percent. The commercials are Bearish with a score of 44.5 percent and the small traders (not shown in chart) are Bearish with a score of 39.9 percent.

CANADIAN DOLLAR StatisticsSPECULATORSCOMMERCIALSSMALL TRADERS
– Percent of Open Interest Longs:37.139.122.1
– Percent of Open Interest Shorts:21.857.419.1
– Net Position:24,179-29,0394,860
– Gross Longs:58,70461,82135,000
– Gross Shorts:34,52590,86030,140
– Long to Short Ratio:1.7 to 10.7 to 11.2 to 1
NET POSITION TREND:
– Strength Index Score (3 Year Range Pct):66.544.539.9
– Strength Index Reading (3 Year Range):BullishBearishBearish
NET POSITION MOVEMENT INDEX:
– 6-Week Change in Strength Index:19.7-16.95.6


Australian Dollar Futures:

Australian Dollar Forex Futures COT ChartThe Australian Dollar large speculator standing this week came in at a net position of -57,393 contracts in the data reported through Tuesday. This was a weekly rise of 2,635 contracts from the previous week which had a total of -60,028 net contracts.

This week’s current strength score (the trader positioning range over the past three years, measured from 0 to 100) shows the speculators are currently Bearish with a score of 31.6 percent. The commercials are Bullish with a score of 65.5 percent and the small traders (not shown in chart) are Bearish with a score of 40.0 percent.

AUSTRALIAN DOLLAR StatisticsSPECULATORSCOMMERCIALSSMALL TRADERS
– Percent of Open Interest Longs:18.567.911.1
– Percent of Open Interest Shorts:52.431.014.1
– Net Position:-57,39362,503-5,110
– Gross Longs:31,304114,95718,758
– Gross Shorts:88,69752,45423,868
– Long to Short Ratio:0.4 to 12.2 to 10.8 to 1
NET POSITION TREND:
– Strength Index Score (3 Year Range Pct):31.665.540.0
– Strength Index Reading (3 Year Range):BearishBullishBearish
NET POSITION MOVEMENT INDEX:
– 6-Week Change in Strength Index:-13.29.92.5


New Zealand Dollar Futures:

New Zealand Dollar Forex Futures COT ChartThe New Zealand Dollar large speculator standing this week came in at a net position of -3,124 contracts in the data reported through Tuesday. This was a weekly decline of -1,650 contracts from the previous week which had a total of -1,474 net contracts.

This week’s current strength score (the trader positioning range over the past three years, measured from 0 to 100) shows the speculators are currently Bullish with a score of 66.0 percent. The commercials are Bearish with a score of 40.5 percent and the small traders (not shown in chart) are Bearish-Extreme with a score of 12.5 percent.

NEW ZEALAND DOLLAR StatisticsSPECULATORSCOMMERCIALSSMALL TRADERS
– Percent of Open Interest Longs:37.056.05.1
– Percent of Open Interest Shorts:44.041.312.8
– Net Position:-3,1246,533-3,409
– Gross Longs:16,40724,8612,266
– Gross Shorts:19,53118,3285,675
– Long to Short Ratio:0.8 to 11.4 to 10.4 to 1
NET POSITION TREND:
– Strength Index Score (3 Year Range Pct):66.040.512.5
– Strength Index Reading (3 Year Range):BullishBearishBearish-Extreme
NET POSITION MOVEMENT INDEX:
– 6-Week Change in Strength Index:0.9-1.11.7


Mexican Peso Futures:

Mexican Peso Futures COT ChartThe Mexican Peso large speculator standing this week came in at a net position of -29,030 contracts in the data reported through Tuesday. This was a weekly increase of 2,286 contracts from the previous week which had a total of -31,316 net contracts.

This week’s current strength score (the trader positioning range over the past three years, measured from 0 to 100) shows the speculators are currently Bearish-Extreme with a score of 15.0 percent. The commercials are Bullish-Extreme with a score of 83.5 percent and the small traders (not shown in chart) are Bullish with a score of 56.9 percent.

MEXICAN PESO StatisticsSPECULATORSCOMMERCIALSSMALL TRADERS
– Percent of Open Interest Longs:50.146.03.1
– Percent of Open Interest Shorts:64.133.51.5
– Net Position:-29,03025,7653,265
– Gross Longs:103,62395,0986,441
– Gross Shorts:132,65369,3333,176
– Long to Short Ratio:0.8 to 11.4 to 12.0 to 1
NET POSITION TREND:
– Strength Index Score (3 Year Range Pct):15.083.556.9
– Strength Index Reading (3 Year Range):Bearish-ExtremeBullish-ExtremeBullish
NET POSITION MOVEMENT INDEX:
– 6-Week Change in Strength Index:0.7-0.91.7


Brazilian Real Futures:

Brazil Real Futures COT ChartThe Brazilian Real large speculator standing this week came in at a net position of 8,859 contracts in the data reported through Tuesday. This was a weekly advance of 2,494 contracts from the previous week which had a total of 6,365 net contracts.

This week’s current strength score (the trader positioning range over the past three years, measured from 0 to 100) shows the speculators are currently Bullish with a score of 59.1 percent. The commercials are Bearish with a score of 40.6 percent and the small traders (not shown in chart) are Bullish-Extreme with a score of 88.9 percent.

BRAZIL REAL StatisticsSPECULATORSCOMMERCIALSSMALL TRADERS
– Percent of Open Interest Longs:45.649.05.3
– Percent of Open Interest Shorts:32.465.42.2
– Net Position:8,859-10,9222,063
– Gross Longs:30,44332,7193,543
– Gross Shorts:21,58443,6411,480
– Long to Short Ratio:1.4 to 10.7 to 12.4 to 1
NET POSITION TREND:
– Strength Index Score (3 Year Range Pct):59.140.688.9
– Strength Index Reading (3 Year Range):BullishBearishBullish-Extreme
NET POSITION MOVEMENT INDEX:
– 6-Week Change in Strength Index:-1.60.611.2

Bitcoin Futures:

Bitcoin Crypto Futures COT ChartThe Bitcoin large speculator standing this week came in at a net position of 1,296 contracts in the data reported through Tuesday. This was a weekly gain of 332 contracts from the previous week which had a total of 964 net contracts.

This week’s current strength score (the trader positioning range over the past three years, measured from 0 to 100) shows the speculators are currently Bullish-Extreme with a score of 100.0 percent. The commercials are Bearish-Extreme with a score of 0.0 percent and the small traders (not shown in chart) are Bearish-Extreme with a score of 13.6 percent.

BITCOIN StatisticsSPECULATORSCOMMERCIALSSMALL TRADERS
– Percent of Open Interest Longs:81.60.56.9
– Percent of Open Interest Shorts:72.69.76.7
– Net Position:1,296-1,32731
– Gross Longs:11,77775996
– Gross Shorts:10,4811,402965
– Long to Short Ratio:1.1 to 10.1 to 11.0 to 1
NET POSITION TREND:
– Strength Index Score (3 Year Range Pct):100.00.013.6
– Strength Index Reading (3 Year Range):Bullish-ExtremeBearish-ExtremeBearish-Extreme
NET POSITION MOVEMENT INDEX:
– 6-Week Change in Strength Index:31.6-61.3-12.3


Article By InvestMacroReceive our weekly COT Reports by Email

*COT Report: The COT data, released weekly to the public each Friday, is updated through the most recent Tuesday (data is 3 days old) and shows a quick view of how large speculators or non-commercials (for-profit traders) were positioned in the futures markets.

The CFTC categorizes trader positions according to commercial hedgers (traders who use futures contracts for hedging as part of the business), non-commercials (large traders who speculate to realize trading profits) and nonreportable traders (usually small traders/speculators) as well as their open interest (contracts open in the market at time of reporting). See CFTC criteria here.

Gold, Platinum and Copper Speculators lead Weekly Precious Metals Bets lower

By InvestMacro | COT | Data Tables | COT Leaders | Downloads | COT Newsletter

Metals Open Interest Comparison

Here are the latest charts and statistics for the Commitment of Traders (COT) data published by the Commodities Futures Trading Commission (CFTC).

The latest COT data is updated through Tuesday August 30th and shows a quick view of how large traders (for-profit speculators and commercial entities) were positioned in the futures markets.

Gold, Platinum and Copper lead the Weekly Speculator Changes Lower

Metals Futures Large Speculator Net Position Changes

The COT precious metals speculator bets were overall lower this week as just one out of the five metals markets we cover had higher positioning while the other four markets had lower contracts.

Leading the way for the precious metals markets this week was Palladium with a gain of 665 contracts.

The metals markets leading the declines in speculator bets this week was Gold (-8,113 contracts) with Platinum (-4,802 contracts), Copper (-4,265 contracts) and Silver (-3,771 contracts) also registering lower bets on the week.


Data Snapshot of Commodity Market Traders | Columns Legend
Aug-30-2022OIOI-IndexSpec-NetSpec-IndexCom-NetCOM-IndexSmalls-NetSmalls-Index
WTI Crude1,470,2070229,1895-256,2489527,05948
Gold459,1652117,73410-129,6799211,9452
Silver138,7146-8,27102651008,0068
Copper158,3900-23,2551924,98583-1,73015
Palladium5,8750-1,129161,32382-19433
Platinum70,74740-5,3781646994,73228
Natural Gas978,8814-128,7654092,4636036,30266
Brent180,95224-40,0134436,585543,42856
Heating Oil283,4272925,19679-43,7612518,56563
Soybeans605,924783,56240-52,79168-30,77119
Corn1,267,7350283,39766-225,75940-57,63810
Coffee193,889748,68781-50,983232,29621
Sugar752,642962,55149-72,5935410,04220
Wheat288,5450-11,499414,91481-3,41593


All Metals Strength Scores are in Bearish Extreme Levels

Metals Speculator Strength Score (3-YR Range)

Strength scores (a measure of the 3-Year range of Speculator positions, from 0 to 100 where above 80 is extreme bullish and below 20 is extreme bearish) showed that all the metals markets continue to have very weak speculator sentiment. All markets currently have bearish extreme strength scores under 20 percent. Copper (19.4 percent) is the highest and is followed by Palladium (16.5 percent) and Gold (9.6 percent). Silver (0.0 percent) is at the absolute bottom of its 3-Year range followed by Platinum (0.7 percent) which is not far away.

Strength Statistics:
Gold (9.6 percent) vs Gold previous week (12.7 percent)
Silver (0.0 percent) vs Silver previous week (4.4 percent)
Copper (19.4 percent) vs Copper previous week (22.7 percent)
Platinum (0.7 percent) vs Platinum previous week (7.3 percent)
Palladium (16.5 percent) vs Palladium previous week (12.7 percent)

Strength Trends

Metals Speculator Strength Trend (6-Weeks)

Strength Score Trends (or move index, calculates the 6-week changes in strength scores) show that Palladium (14.8 percent) leads the past six weeks trends for metals. Gold (8.7 percent) and Copper (0.5 percent) round out the other positive movers in the latest trends data.

Silver (-11.2 percent) leads the downside trend scores this week while the next market with a lower trend score was Platinum (-1.5 percent).

Move Statistics:
Gold (8.7 percent) vs Gold previous week (3.0 percent)
Silver (-11.2 percent) vs Silver previous week (-8.9 percent)
Copper (0.5 percent) vs Copper previous week (5.7 percent)
Platinum (-1.5 percent) vs Platinum previous week (7.3 percent)
Palladium (14.8 percent) vs Palladium previous week (5.7 percent)


Individual Markets:

Gold Comex Futures:

Gold Futures COT ChartThe Gold Comex Futures large speculator standing this week totaled a net position of 117,734 contracts in the data reported through Tuesday. This was a weekly decline of -8,113 contracts from the previous week which had a total of 125,847 net contracts.

This week’s current strength score (the trader positioning range over the past three years, measured from 0 to 100) shows the speculators are currently Bearish-Extreme with a score of 9.6 percent. The commercials are Bullish-Extreme with a score of 92.3 percent and the small traders (not shown in chart) are Bearish-Extreme with a score of 1.9 percent.

Gold Futures StatisticsSPECULATORSCOMMERCIALSSMALL TRADERS
– Percent of Open Interest Longs:51.227.68.5
– Percent of Open Interest Shorts:25.655.85.9
– Net Position:117,734-129,67911,945
– Gross Longs:235,314126,53538,918
– Gross Shorts:117,580256,21426,973
– Long to Short Ratio:2.0 to 10.5 to 11.4 to 1
NET POSITION TREND:
– Strength Index Score (3 Year Range Pct):9.692.31.9
– Strength Index Reading (3 Year Range):Bearish-ExtremeBullish-ExtremeBearish-Extreme
NET POSITION MOVEMENT INDEX:
– 6-Week Change in Strength Index:8.7-6.3-14.7


Silver Comex Futures:

Silver Futures COT ChartThe Silver Comex Futures large speculator standing this week totaled a net position of -8,271 contracts in the data reported through Tuesday. This was a weekly lowering of -3,771 contracts from the previous week which had a total of -4,500 net contracts.

This week’s current strength score (the trader positioning range over the past three years, measured from 0 to 100) shows the speculators are currently Bearish-Extreme with a score of 0.0 percent. The commercials are Bullish-Extreme with a score of 100.0 percent and the small traders (not shown in chart) are Bearish-Extreme with a score of 7.8 percent.

Silver Futures StatisticsSPECULATORSCOMMERCIALSSMALL TRADERS
– Percent of Open Interest Longs:35.742.216.4
– Percent of Open Interest Shorts:41.642.010.6
– Net Position:-8,2712658,006
– Gross Longs:49,46858,59222,715
– Gross Shorts:57,73958,32714,709
– Long to Short Ratio:0.9 to 11.0 to 11.5 to 1
NET POSITION TREND:
– Strength Index Score (3 Year Range Pct):0.0100.07.8
– Strength Index Reading (3 Year Range):Bearish-ExtremeBullish-ExtremeBearish-Extreme
NET POSITION MOVEMENT INDEX:
– 6-Week Change in Strength Index:-11.28.45.6


Copper Grade #1 Futures:

Copper Futures COT ChartThe Copper Grade #1 Futures large speculator standing this week totaled a net position of -23,255 contracts in the data reported through Tuesday. This was a weekly decrease of -4,265 contracts from the previous week which had a total of -18,990 net contracts.

This week’s current strength score (the trader positioning range over the past three years, measured from 0 to 100) shows the speculators are currently Bearish-Extreme with a score of 19.4 percent. The commercials are Bullish-Extreme with a score of 82.9 percent and the small traders (not shown in chart) are Bearish-Extreme with a score of 15.3 percent.

Copper Futures StatisticsSPECULATORSCOMMERCIALSSMALL TRADERS
– Percent of Open Interest Longs:29.151.88.4
– Percent of Open Interest Shorts:43.836.09.5
– Net Position:-23,25524,985-1,730
– Gross Longs:46,10582,02313,256
– Gross Shorts:69,36057,03814,986
– Long to Short Ratio:0.7 to 11.4 to 10.9 to 1
NET POSITION TREND:
– Strength Index Score (3 Year Range Pct):19.482.915.3
– Strength Index Reading (3 Year Range):Bearish-ExtremeBullish-ExtremeBearish-Extreme
NET POSITION MOVEMENT INDEX:
– 6-Week Change in Strength Index:0.50.9-10.5


Platinum Futures:

Platinum Futures COT ChartThe Platinum Futures large speculator standing this week totaled a net position of -5,378 contracts in the data reported through Tuesday. This was a weekly reduction of -4,802 contracts from the previous week which had a total of -576 net contracts.

This week’s current strength score (the trader positioning range over the past three years, measured from 0 to 100) shows the speculators are currently Bearish-Extreme with a score of 0.7 percent. The commercials are Bullish-Extreme with a score of 99.2 percent and the small traders (not shown in chart) are Bearish with a score of 28.0 percent.

Platinum Futures StatisticsSPECULATORSCOMMERCIALSSMALL TRADERS
– Percent of Open Interest Longs:41.938.912.1
– Percent of Open Interest Shorts:49.538.05.4
– Net Position:-5,3786464,732
– Gross Longs:29,63527,5018,556
– Gross Shorts:35,01326,8553,824
– Long to Short Ratio:0.8 to 11.0 to 12.2 to 1
NET POSITION TREND:
– Strength Index Score (3 Year Range Pct):0.799.228.0
– Strength Index Reading (3 Year Range):Bearish-ExtremeBullish-ExtremeBearish
NET POSITION MOVEMENT INDEX:
– 6-Week Change in Strength Index:-1.51.22.5


Palladium Futures:

Palladium Futures COT ChartThe Palladium Futures large speculator standing this week totaled a net position of -1,129 contracts in the data reported through Tuesday. This was a weekly increase of 665 contracts from the previous week which had a total of -1,794 net contracts.

This week’s current strength score (the trader positioning range over the past three years, measured from 0 to 100) shows the speculators are currently Bearish-Extreme with a score of 16.5 percent. The commercials are Bullish-Extreme with a score of 82.2 percent and the small traders (not shown in chart) are Bearish with a score of 32.6 percent.

Palladium Futures StatisticsSPECULATORSCOMMERCIALSSMALL TRADERS
– Percent of Open Interest Longs:24.259.115.9
– Percent of Open Interest Shorts:43.536.619.2
– Net Position:-1,1291,323-194
– Gross Longs:1,4243,475932
– Gross Shorts:2,5532,1521,126
– Long to Short Ratio:0.6 to 11.6 to 10.8 to 1
NET POSITION TREND:
– Strength Index Score (3 Year Range Pct):16.582.232.6
– Strength Index Reading (3 Year Range):Bearish-ExtremeBullish-ExtremeBearish
NET POSITION MOVEMENT INDEX:
– 6-Week Change in Strength Index:14.8-16.620.7


Article By InvestMacroReceive our weekly COT Reports by Email

*COT Report: The COT data, released weekly to the public each Friday, is updated through the most recent Tuesday (data is 3 days old) and shows a quick view of how large speculators or non-commercials (for-profit traders) were positioned in the futures markets.

The CFTC categorizes trader positions according to commercial hedgers (traders who use futures contracts for hedging as part of the business), non-commercials (large traders who speculate to realize trading profits) and nonreportable traders (usually small traders/speculators) as well as their open interest (contracts open in the market at time of reporting). See CFTC criteria here.

5-Year, 10-Year & 2-Year Bonds lead Weekly Speculator Bets Lower

By InvestMacro | COT | Data Tables | COT Leaders | Downloads | COT Newsletter

COT Bonds Open Interest Comparison

Here are the latest charts and statistics for the Commitment of Traders (COT) data published by the Commodities Futures Trading Commission (CFTC).

The latest COT data is updated through Tuesday August 30th (COT Week 35) and shows a quick view of how large traders (for-profit speculators and commercial entities) were positioned in the futures markets.

5-Year, 10-Year & 2-Year Bonds lead Weekly Speculator Changes Lower

Bonds Futures Speculator Net Position Changes

The COT bond market speculator bets were lower this week as just three out of the eight bond markets we cover had higher positioning while the other five markets had lower contracts.

Leading the gains for the bond markets were the Eurodollar (21,409 contracts) and the Ultra US Bond (20,439 contracts) with the Ultra 10-Year (7,103 contracts) also having a positive week.

The bond markets leading the declines in speculator bets this week were the 5-Year Bond (-61,931 contracts) and the 10-Year Bond (-58,934 contracts) with the 2-Year Bond (-40,457 contracts), the Fed Funds (-17,884 contracts) and the Long US Bond (-17,703 contracts) also registering lower bets on the week.


Data Snapshot of Bond Market Traders | Columns Legend
Aug-30-2022OIOI-IndexSpec-NetSpec-IndexCom-NetCOM-IndexSmalls-NetSmalls-Index
Eurodollar9,583,49415-2,857,40213,053,63096-196,22861
FedFunds1,861,8956984,76650-78,24650-6,52043
2-Year1,966,5128-281,60025348,41296-66,81221
Long T-Bond1,233,30250-68,8346240,7892528,04575
10-Year3,559,44534-440,1036558,95888-118,85552
5-Year4,037,08553-565,4560694,38198-128,92546


US Treasury Bond & Fed Funds Futures lead the Strength Scores

Bonds Speculator Strength Scores (3-YR Range 0-100)

Strength Scores (a normalized measure of Speculator positions over a 3-Year range, from 0 to 100 where above 80 is extreme bullish and below 20 is extreme bearish) showed that the US Treasury Bond (62.2 percent) continues to lead the bonds markets although it is cooling off from past months and from last week’s score of 67.9 percent. The Fed Funds (50.1 percent) comes in as the next highest bonds market in strength scores and the only other one above the 3-Year midpoint of 50 percent.

On the downside, the 5-Year Bond (0.0 percent), the Eurodollar (0.5 percent) and the 10-Year Bond (5.5 percent) come in as the lowest strength scores currently. All three of these markets are in bearish extreme positions (below 20 percent) and are near the bottoms of their 3-Year ranges.

Strength Statistics:
Fed Funds (50.1 percent) vs Fed Funds previous week (52.3 percent)
2-Year Bond (25.4 percent) vs 2-Year Bond previous week (33.6 percent)
5-Year Bond (0.0 percent) vs 5-Year Bond previous week (9.4 percent)
10-Year Bond (5.5 percent) vs 10-Year Bond previous week (14.5 percent)
Ultra 10-Year Bond (24.1 percent) vs Ultra 10-Year Bond previous week (22.3 percent)
US Treasury Bond (62.2 percent) vs US Treasury Bond previous week (67.9 percent)
Ultra US Treasury Bond (40.1 percent) vs Ultra US Treasury Bond previous week (31.7 percent)
Eurodollar (0.5 percent) vs Eurodollar previous week (0.1 percent)

10-Year, 5-Year & 2-Year lead Strength Trends sharply lower

Bonds Speculator Strength Score Trends (6-Weeks)

Strength Score Trends (or move index, calculates the 6-week changes in strength scores) showed that the Ultra 10-Year Bond (4.6 percent) leads the past six weeks trends for bonds and is the only positive score in the latest data.

The 10-Year Bond (-50.4 percent), the 5-Year Bond (-46.5 percent) and the 2-Year Bond (-44.1 percent) lead the downside trend scores. These three market trends are all sharply lower as the speculator sentiment has become much weaker.

Strength Trend Statistics:
Fed Funds (-3.6 percent) vs Fed Funds previous week (2.7 percent)
2-Year Bond (-44.1 percent) vs 2-Year Bond previous week (-35.7 percent)
5-Year Bond (-46.5 percent) vs 5-Year Bond previous week (-32.1 percent)
10-Year Bond (-50.4 percent) vs 10-Year Bond previous week (-41.5 percent)
Ultra 10-Year Bond (4.6 percent) vs Ultra 10-Year Bond previous week (0.6 percent)
US Treasury Bond (-8.7 percent) vs US Treasury Bond previous week (-9.1 percent)
Ultra US Treasury Bond (-4.1 percent) vs Ultra US Treasury Bond previous week (-19.6 percent)
Eurodollar (-3.9 percent) vs Eurodollar previous week (-2.8 percent)


Individual Markets:

3-Month Eurodollars Futures:

Eurodollar Bonds Futures COT ChartThe 3-Month Eurodollars large speculator standing this week equaled a net position of -2,857,402 contracts in the data reported through Tuesday. This was a weekly advance of 21,409 contracts from the previous week which had a total of -2,878,811 net contracts.

This week’s current strength score (the trader positioning range over the past three years, measured from 0 to 100) shows the speculators are currently Bearish-Extreme with a score of 0.5 percent. The commercials are Bullish-Extreme with a score of 95.6 percent and the small traders (not shown in chart) are Bullish with a score of 61.3 percent.

3-Month Eurodollars StatisticsSPECULATORSCOMMERCIALSSMALL TRADERS
– Percent of Open Interest Longs:5.869.05.6
– Percent of Open Interest Shorts:35.637.17.7
– Net Position:-2,857,4023,053,630-196,228
– Gross Longs:556,3796,613,120541,288
– Gross Shorts:3,413,7813,559,490737,516
– Long to Short Ratio:0.2 to 11.9 to 10.7 to 1
NET POSITION TREND:
– Strength Index Score (3 Year Range Pct):0.595.661.3
– Strength Index Reading (3 Year Range):Bearish-ExtremeBullish-ExtremeBullish
NET POSITION MOVEMENT INDEX:
– 6-Week Change in Strength Index:-3.92.121.5


30-Day Federal Funds Futures:

Federal Funds 30-Day Bonds Futures COT ChartThe 30-Day Federal Funds large speculator standing this week equaled a net position of 84,766 contracts in the data reported through Tuesday. This was a weekly decline of -17,884 contracts from the previous week which had a total of 102,650 net contracts.

This week’s current strength score (the trader positioning range over the past three years, measured from 0 to 100) shows the speculators are currently Bullish with a score of 50.1 percent. The commercials are Bullish with a score of 50.4 percent and the small traders (not shown in chart) are Bearish with a score of 43.1 percent.

30-Day Federal Funds StatisticsSPECULATORSCOMMERCIALSSMALL TRADERS
– Percent of Open Interest Longs:15.871.32.0
– Percent of Open Interest Shorts:11.275.52.3
– Net Position:84,766-78,246-6,520
– Gross Longs:293,5311,328,26936,739
– Gross Shorts:208,7651,406,51543,259
– Long to Short Ratio:1.4 to 10.9 to 10.8 to 1
NET POSITION TREND:
– Strength Index Score (3 Year Range Pct):50.150.443.1
– Strength Index Reading (3 Year Range):BullishBullishBearish
NET POSITION MOVEMENT INDEX:
– 6-Week Change in Strength Index:-3.63.35.1


2-Year Treasury Note Futures:

2-Year Treasury Bonds Futures COT ChartThe 2-Year Treasury Note large speculator standing this week equaled a net position of -281,600 contracts in the data reported through Tuesday. This was a weekly decrease of -40,457 contracts from the previous week which had a total of -241,143 net contracts.

This week’s current strength score (the trader positioning range over the past three years, measured from 0 to 100) shows the speculators are currently Bearish with a score of 25.4 percent. The commercials are Bullish-Extreme with a score of 96.0 percent and the small traders (not shown in chart) are Bearish with a score of 20.7 percent.

2-Year Treasury Note StatisticsSPECULATORSCOMMERCIALSSMALL TRADERS
– Percent of Open Interest Longs:5.583.07.4
– Percent of Open Interest Shorts:19.865.210.8
– Net Position:-281,600348,412-66,812
– Gross Longs:108,3971,631,374146,211
– Gross Shorts:389,9971,282,962213,023
– Long to Short Ratio:0.3 to 11.3 to 10.7 to 1
NET POSITION TREND:
– Strength Index Score (3 Year Range Pct):25.496.020.7
– Strength Index Reading (3 Year Range):BearishBullish-ExtremeBearish
NET POSITION MOVEMENT INDEX:
– 6-Week Change in Strength Index:-44.145.25.0


5-Year Treasury Note Futures:

5-Year Treasury Bonds Futures COT ChartThe 5-Year Treasury Note large speculator standing this week equaled a net position of -565,456 contracts in the data reported through Tuesday. This was a weekly fall of -61,931 contracts from the previous week which had a total of -503,525 net contracts.

This week’s current strength score (the trader positioning range over the past three years, measured from 0 to 100) shows the speculators are currently Bearish-Extreme with a score of 0.0 percent. The commercials are Bullish-Extreme with a score of 97.9 percent and the small traders (not shown in chart) are Bearish with a score of 45.6 percent.

5-Year Treasury Note StatisticsSPECULATORSCOMMERCIALSSMALL TRADERS
– Percent of Open Interest Longs:5.684.17.7
– Percent of Open Interest Shorts:19.666.910.9
– Net Position:-565,456694,381-128,925
– Gross Longs:227,4253,395,892312,291
– Gross Shorts:792,8812,701,511441,216
– Long to Short Ratio:0.3 to 11.3 to 10.7 to 1
NET POSITION TREND:
– Strength Index Score (3 Year Range Pct):0.097.945.6
– Strength Index Reading (3 Year Range):Bearish-ExtremeBullish-ExtremeBearish
NET POSITION MOVEMENT INDEX:
– 6-Week Change in Strength Index:-46.535.73.8


10-Year Treasury Note Futures:

10-Year Treasury Notes Bonds Futures COT ChartThe 10-Year Treasury Note large speculator standing this week equaled a net position of -440,103 contracts in the data reported through Tuesday. This was a weekly decline of -58,934 contracts from the previous week which had a total of -381,169 net contracts.

This week’s current strength score (the trader positioning range over the past three years, measured from 0 to 100) shows the speculators are currently Bearish-Extreme with a score of 5.5 percent. The commercials are Bullish-Extreme with a score of 88.3 percent and the small traders (not shown in chart) are Bullish with a score of 51.9 percent.

10-Year Treasury Note StatisticsSPECULATORSCOMMERCIALSSMALL TRADERS
– Percent of Open Interest Longs:6.879.59.4
– Percent of Open Interest Shorts:19.263.812.7
– Net Position:-440,103558,958-118,855
– Gross Longs:241,8722,829,749334,948
– Gross Shorts:681,9752,270,791453,803
– Long to Short Ratio:0.4 to 11.2 to 10.7 to 1
NET POSITION TREND:
– Strength Index Score (3 Year Range Pct):5.588.351.9
– Strength Index Reading (3 Year Range):Bearish-ExtremeBullish-ExtremeBullish
NET POSITION MOVEMENT INDEX:
– 6-Week Change in Strength Index:-50.445.9-13.0


Ultra 10-Year Notes Futures:

Ultra 10-Year Treasury Notes Bonds Futures COT ChartThe Ultra 10-Year Notes large speculator standing this week equaled a net position of -17,986 contracts in the data reported through Tuesday. This was a weekly lift of 7,103 contracts from the previous week which had a total of -25,089 net contracts.

This week’s current strength score (the trader positioning range over the past three years, measured from 0 to 100) shows the speculators are currently Bearish with a score of 24.1 percent. The commercials are Bullish with a score of 72.3 percent and the small traders (not shown in chart) are Bullish with a score of 56.1 percent.

Ultra 10-Year Notes StatisticsSPECULATORSCOMMERCIALSSMALL TRADERS
– Percent of Open Interest Longs:5.280.110.0
– Percent of Open Interest Shorts:6.570.518.2
– Net Position:-17,986124,783-106,797
– Gross Longs:66,8301,039,205129,753
– Gross Shorts:84,816914,422236,550
– Long to Short Ratio:0.8 to 11.1 to 10.5 to 1
NET POSITION TREND:
– Strength Index Score (3 Year Range Pct):24.172.356.1
– Strength Index Reading (3 Year Range):BearishBullishBullish
NET POSITION MOVEMENT INDEX:
– 6-Week Change in Strength Index:4.6-6.34.5


US Treasury Bonds Futures:

US Year Treasury Notes Long Bonds Futures COT ChartThe US Treasury Bonds large speculator standing this week equaled a net position of -68,834 contracts in the data reported through Tuesday. This was a weekly lowering of -17,703 contracts from the previous week which had a total of -51,131 net contracts.

This week’s current strength score (the trader positioning range over the past three years, measured from 0 to 100) shows the speculators are currently Bullish with a score of 62.2 percent. The commercials are Bearish with a score of 25.2 percent and the small traders (not shown in chart) are Bullish with a score of 74.8 percent.

US Treasury Bonds StatisticsSPECULATORSCOMMERCIALSSMALL TRADERS
– Percent of Open Interest Longs:6.473.314.1
– Percent of Open Interest Shorts:11.970.011.8
– Net Position:-68,83440,78928,045
– Gross Longs:78,532903,487173,323
– Gross Shorts:147,366862,698145,278
– Long to Short Ratio:0.5 to 11.0 to 11.2 to 1
NET POSITION TREND:
– Strength Index Score (3 Year Range Pct):62.225.274.8
– Strength Index Reading (3 Year Range):BullishBearishBullish
NET POSITION MOVEMENT INDEX:
– 6-Week Change in Strength Index:-8.76.37.1


Ultra US Treasury Bonds Futures:

Ultra US Year Treasury Notes Long Bonds Futures COT ChartThe Ultra US Treasury Bonds large speculator standing this week equaled a net position of -355,794 contracts in the data reported through Tuesday. This was a weekly boost of 20,439 contracts from the previous week which had a total of -376,233 net contracts.

This week’s current strength score (the trader positioning range over the past three years, measured from 0 to 100) shows the speculators are currently Bearish with a score of 40.1 percent. The commercials are Bullish with a score of 73.1 percent and the small traders (not shown in chart) are Bullish with a score of 51.7 percent.

Ultra US Treasury Bonds StatisticsSPECULATORSCOMMERCIALSSMALL TRADERS
– Percent of Open Interest Longs:5.681.710.8
– Percent of Open Interest Shorts:31.358.48.5
– Net Position:-355,794323,16432,630
– Gross Longs:77,8991,132,704150,042
– Gross Shorts:433,693809,540117,412
– Long to Short Ratio:0.2 to 11.4 to 11.3 to 1
NET POSITION TREND:
– Strength Index Score (3 Year Range Pct):40.173.151.7
– Strength Index Reading (3 Year Range):BearishBullishBullish
NET POSITION MOVEMENT INDEX:
– 6-Week Change in Strength Index:-4.17.6-3.9


Article By InvestMacroReceive our weekly COT Reports by Email

*COT Report: The COT data, released weekly to the public each Friday, is updated through the most recent Tuesday (data is 3 days old) and shows a quick view of how large speculators or non-commercials (for-profit traders) were positioned in the futures markets.

The CFTC categorizes trader positions according to commercial hedgers (traders who use futures contracts for hedging as part of the business), non-commercials (large traders who speculate to realize trading profits) and nonreportable traders (usually small traders/speculators) as well as their open interest (contracts open in the market at time of reporting). See CFTC criteria here.

Corn, Coffee and Cocoa lead the COT Soft Commodities Speculator bets higher this week

By InvestMacro | COT | Data Tables | COT Leaders | Downloads | COT Newsletter

Soft Commodities Open Interest Comparison

Here are the latest charts and statistics for the Commitment of Traders (COT) data published by the Commodities Futures Trading Commission (CFTC).

The latest COT data is updated through Tuesday August 30th (COT Week 35) and shows a quick view of how large traders (for-profit speculators and commercial entities) were positioned in the futures markets.

Corn, Coffee and Cocoa lead the Weekly Speculator Changes Higher

COT soft commodities speculator bets were slightly higher this week as six out of the eleven soft commodities markets we cover had higher positioning this week while the other five markets had lower contracts.

Leading the gains for soft commodities markets was Corn (20,154 contracts) and Coffee (10,054 contracts) with Cocoa (9,461 contracts), Soybean Oil (7,381 contracts), Sugar (4,464 contracts) and Cotton (282 contracts) also showing a positive weeks.

The softs markets leading the declines in speculator bets this week was Lean Hogs (-8,204 contracts) with Soybeans (-4,274 contracts), Wheat (-3,243 contracts), Live Cattle (-2,346 contracts) and Soybean Meal (-1,365 contracts) also registering lower bets on the week.

Soft Commodities Speculator Net Position Changes


Data Snapshot of Commodity Market Traders | Columns Legend
Aug-30-2022OIOI-IndexSpec-NetSpec-IndexCom-NetCOM-IndexSmalls-NetSmalls-Index
WTI Crude1,470,2070229,1895-256,2489527,05948
Gold459,1652117,73410-129,6799211,9452
Silver138,7146-8,27102651008,0068
Copper158,3900-23,2551924,98583-1,73015
Palladium5,8750-1,129161,32382-19433
Platinum70,74740-5,3781646994,73228
Natural Gas978,8814-128,7654092,4636036,30266
Brent180,95224-40,0134436,585543,42856
Heating Oil283,4272925,19679-43,7612518,56563
Soybeans605,924783,56240-52,79168-30,77119
Corn1,267,7350283,39766-225,75940-57,63810
Coffee193,889748,68781-50,983232,29621
Sugar752,642962,55149-72,5935410,04220
Wheat288,5450-11,499414,91481-3,41593


Soybean Meal and Coffee leads this week’s Strength Scores

Strength Scores (a normalized measure of Speculator positions over a 3-Year range, from 0 to 100 where above 80 is extreme bullish and below 20 is extreme bearish) showed that Soybean Meal (92.2 percent) and Coffee (80.9 percent) lead the soft commodity markets and are both in bullish extreme positions (above 80 percent). Corn (66.2 percent) comes in as the next highest soft commodity markets market in strength scores.

On the downside, Wheat (4.1 percent) comes in at the lowest strength level currently and is in a bearish extreme state (below 20 percent). Cocoa (25.8 percent) comes in as the next lowest followed by Soybeans (39.6 percent) and Soybean Oil (40.0 percent).

Soft Commodities Speculator Strength Scores
Strength Statistics:
Corn (66.2 percent) vs Corn previous week (63.7 percent)
Sugar (49.5 percent) vs Sugar previous week (48.6 percent)
Coffee (80.9 percent) vs Coffee previous week (72.2 percent)
Soybeans (39.6 percent) vs Soybeans previous week (40.9 percent)
Soybean Oil (40.0 percent) vs Soybean Oil previous week (34.9 percent)
Soybean Meal (92.2 percent) vs Soybean Meal previous week (92.9 percent)
Live Cattle (54.3 percent) vs Live Cattle previous week (57.2 percent)
Lean Hogs (53.8 percent) vs Lean Hogs previous week (62.7 percent)
Cotton (52.7 percent) vs Cotton previous week (52.5 percent)
Cocoa (25.8 percent) vs Cocoa previous week (16.5 percent)
Wheat (4.1 percent) vs Wheat previous week (8.3 percent)

Live Cattle leads the 6-Week Strength Trends

Strength Score Trends (or move index, calculates the 6-week changes in strength scores) showed that Live Cattle (47.4 percent) leads the past six weeks trends for soft commodity markets this week. Soybean Oil (18.3 percent), Coffee (17.9 percent) and Lean Hogs (14.8 percent) fill out the top movers in the latest trends data.

Wheat (-23.5 percent) leads the downside trend scores currently while the next market with lower trend scores were Sugar (-13.3 percent) followed by Soybeans (-5.8 percent).

Soft Commodities Strength Score Trends (6 Week)
Strength Trend Statistics:
Corn (9.4 percent) vs Corn previous week (2.1 percent)
Sugar (-13.3 percent) vs Sugar previous week (-9.8 percent)
Coffee (17.9 percent) vs Coffee previous week (3.7 percent)
Soybeans (-5.8 percent) vs Soybeans previous week (-8.3 percent)
Soybean Oil (18.3 percent) vs Soybean Oil previous week (11.5 percent)
Soybean Meal (8.6 percent) vs Soybean Meal previous week (9.6 percent)
Live Cattle (47.4 percent) vs Live Cattle previous week (50.4 percent)
Lean Hogs (14.8 percent) vs Lean Hogs previous week (28.7 percent)
Cotton (9.5 percent) vs Cotton previous week (6.0 percent)
Cocoa (8.7 percent) vs Cocoa previous week (3.0 percent)
Wheat (-23.5 percent) vs Wheat previous week (-16.8 percent)


Individual Markets:

CORN Futures:

CORN Futures COT ChartThe CORN large speculator standing this week equaled a net position of 283,397 contracts in the data reported through Tuesday. This was a weekly gain of 20,154 contracts from the previous week which had a total of 263,243 net contracts.

This week’s current strength score (the trader positioning range over the past three years, measured from 0 to 100) shows the speculators are currently Bullish with a score of 66.2 percent. The commercials are Bearish with a score of 39.7 percent and the small traders (not shown in chart) are Bearish-Extreme with a score of 9.9 percent.

CORN Futures StatisticsSPECULATORSCOMMERCIALSSMALL TRADERS
– Percent of Open Interest Longs:31.747.09.1
– Percent of Open Interest Shorts:9.464.813.6
– Net Position:283,397-225,759-57,638
– Gross Longs:402,312595,440115,050
– Gross Shorts:118,915821,199172,688
– Long to Short Ratio:3.4 to 10.7 to 10.7 to 1
NET POSITION TREND:
– Strength Index Score (3 Year Range Pct):66.239.79.9
– Strength Index Reading (3 Year Range):BullishBearishBearish-Extreme
NET POSITION MOVEMENT INDEX:
– 6-Week Change in Strength Index:9.4-8.6-7.6


SUGAR Futures:

SUGAR Futures COT ChartThe SUGAR large speculator standing this week equaled a net position of 62,551 contracts in the data reported through Tuesday. This was a weekly increase of 4,464 contracts from the previous week which had a total of 58,087 net contracts.

This week’s current strength score (the trader positioning range over the past three years, measured from 0 to 100) shows the speculators are currently Bearish with a score of 49.5 percent. The commercials are Bullish with a score of 54.4 percent and the small traders (not shown in chart) are Bearish with a score of 20.3 percent.

SUGAR Futures StatisticsSPECULATORSCOMMERCIALSSMALL TRADERS
– Percent of Open Interest Longs:23.353.58.8
– Percent of Open Interest Shorts:15.063.17.5
– Net Position:62,551-72,59310,042
– Gross Longs:175,450402,66466,576
– Gross Shorts:112,899475,25756,534
– Long to Short Ratio:1.6 to 10.8 to 11.2 to 1
NET POSITION TREND:
– Strength Index Score (3 Year Range Pct):49.554.420.3
– Strength Index Reading (3 Year Range):BearishBullishBearish
NET POSITION MOVEMENT INDEX:
– 6-Week Change in Strength Index:-13.313.1-5.7


COFFEE Futures:

COFFEE Futures COT ChartThe COFFEE large speculator standing this week equaled a net position of 48,687 contracts in the data reported through Tuesday. This was a weekly gain of 10,054 contracts from the previous week which had a total of 38,633 net contracts.

This week’s current strength score (the trader positioning range over the past three years, measured from 0 to 100) shows the speculators are currently Bullish-Extreme with a score of 80.9 percent. The commercials are Bearish with a score of 23.0 percent and the small traders (not shown in chart) are Bearish with a score of 20.6 percent.

COFFEE Futures StatisticsSPECULATORSCOMMERCIALSSMALL TRADERS
– Percent of Open Interest Longs:31.745.04.9
– Percent of Open Interest Shorts:6.671.33.7
– Net Position:48,687-50,9832,296
– Gross Longs:61,41687,1949,555
– Gross Shorts:12,729138,1777,259
– Long to Short Ratio:4.8 to 10.6 to 11.3 to 1
NET POSITION TREND:
– Strength Index Score (3 Year Range Pct):80.923.020.6
– Strength Index Reading (3 Year Range):Bullish-ExtremeBearishBearish
NET POSITION MOVEMENT INDEX:
– 6-Week Change in Strength Index:17.9-20.820.6


SOYBEANS Futures:

SOYBEANS Futures COT ChartThe SOYBEANS large speculator standing this week equaled a net position of 83,562 contracts in the data reported through Tuesday. This was a weekly fall of -4,274 contracts from the previous week which had a total of 87,836 net contracts.

This week’s current strength score (the trader positioning range over the past three years, measured from 0 to 100) shows the speculators are currently Bearish with a score of 39.6 percent. The commercials are Bullish with a score of 67.8 percent and the small traders (not shown in chart) are Bearish-Extreme with a score of 19.0 percent.

SOYBEANS Futures StatisticsSPECULATORSCOMMERCIALSSMALL TRADERS
– Percent of Open Interest Longs:25.755.36.2
– Percent of Open Interest Shorts:11.964.011.3
– Net Position:83,562-52,791-30,771
– Gross Longs:155,472335,04837,513
– Gross Shorts:71,910387,83968,284
– Long to Short Ratio:2.2 to 10.9 to 10.5 to 1
NET POSITION TREND:
– Strength Index Score (3 Year Range Pct):39.667.819.0
– Strength Index Reading (3 Year Range):BearishBullishBearish-Extreme
NET POSITION MOVEMENT INDEX:
– 6-Week Change in Strength Index:-5.86.5-4.4


SOYBEAN OIL Futures:

SOYBEAN OIL Futures COT ChartThe SOYBEAN OIL large speculator standing this week equaled a net position of 53,958 contracts in the data reported through Tuesday. This was a weekly boost of 7,381 contracts from the previous week which had a total of 46,577 net contracts.

This week’s current strength score (the trader positioning range over the past three years, measured from 0 to 100) shows the speculators are currently Bearish with a score of 40.0 percent. The commercials are Bullish with a score of 60.8 percent and the small traders (not shown in chart) are Bearish with a score of 46.1 percent.

SOYBEAN OIL Futures StatisticsSPECULATORSCOMMERCIALSSMALL TRADERS
– Percent of Open Interest Longs:21.251.77.6
– Percent of Open Interest Shorts:7.467.85.4
– Net Position:53,958-62,7118,753
– Gross Longs:83,033202,09529,895
– Gross Shorts:29,075264,80621,142
– Long to Short Ratio:2.9 to 10.8 to 11.4 to 1
NET POSITION TREND:
– Strength Index Score (3 Year Range Pct):40.060.846.1
– Strength Index Reading (3 Year Range):BearishBullishBearish
NET POSITION MOVEMENT INDEX:
– 6-Week Change in Strength Index:18.3-20.221.0


SOYBEAN MEAL Futures:

SOYBEAN MEAL Futures COT ChartThe SOYBEAN MEAL large speculator standing this week equaled a net position of 116,189 contracts in the data reported through Tuesday. This was a weekly lowering of -1,365 contracts from the previous week which had a total of 117,554 net contracts.

This week’s current strength score (the trader positioning range over the past three years, measured from 0 to 100) shows the speculators are currently Bullish-Extreme with a score of 92.2 percent. The commercials are Bearish-Extreme with a score of 11.3 percent and the small traders (not shown in chart) are Bearish with a score of 45.1 percent.

SOYBEAN MEAL Futures StatisticsSPECULATORSCOMMERCIALSSMALL TRADERS
– Percent of Open Interest Longs:32.443.012.0
– Percent of Open Interest Shorts:2.778.36.4
– Net Position:116,189-137,83521,646
– Gross Longs:126,866168,31646,829
– Gross Shorts:10,677306,15125,183
– Long to Short Ratio:11.9 to 10.5 to 11.9 to 1
NET POSITION TREND:
– Strength Index Score (3 Year Range Pct):92.211.345.1
– Strength Index Reading (3 Year Range):Bullish-ExtremeBearish-ExtremeBearish
NET POSITION MOVEMENT INDEX:
– 6-Week Change in Strength Index:8.6-9.110.4


LIVE CATTLE Futures:

LIVE CATTLE Futures COT ChartThe LIVE CATTLE large speculator standing this week equaled a net position of 59,731 contracts in the data reported through Tuesday. This was a weekly decrease of -2,346 contracts from the previous week which had a total of 62,077 net contracts.

This week’s current strength score (the trader positioning range over the past three years, measured from 0 to 100) shows the speculators are currently Bullish with a score of 54.3 percent. The commercials are Bearish with a score of 34.2 percent and the small traders (not shown in chart) are Bullish with a score of 77.7 percent.

LIVE CATTLE Futures StatisticsSPECULATORSCOMMERCIALSSMALL TRADERS
– Percent of Open Interest Longs:38.132.911.3
– Percent of Open Interest Shorts:17.253.112.0
– Net Position:59,731-57,725-2,006
– Gross Longs:108,97693,97432,255
– Gross Shorts:49,245151,69934,261
– Long to Short Ratio:2.2 to 10.6 to 10.9 to 1
NET POSITION TREND:
– Strength Index Score (3 Year Range Pct):54.334.277.7
– Strength Index Reading (3 Year Range):BullishBearishBullish
NET POSITION MOVEMENT INDEX:
– 6-Week Change in Strength Index:47.4-48.2-9.3


LEAN HOGS Futures:

LEAN HOGS Futures COT ChartThe LEAN HOGS large speculator standing this week equaled a net position of 43,199 contracts in the data reported through Tuesday. This was a weekly reduction of -8,204 contracts from the previous week which had a total of 51,403 net contracts.

This week’s current strength score (the trader positioning range over the past three years, measured from 0 to 100) shows the speculators are currently Bullish with a score of 53.8 percent. The commercials are Bullish with a score of 51.6 percent and the small traders (not shown in chart) are Bullish with a score of 56.2 percent.

LEAN HOGS Futures StatisticsSPECULATORSCOMMERCIALSSMALL TRADERS
– Percent of Open Interest Longs:39.036.08.9
– Percent of Open Interest Shorts:19.252.312.5
– Net Position:43,199-35,424-7,775
– Gross Longs:84,94478,50519,440
– Gross Shorts:41,745113,92927,215
– Long to Short Ratio:2.0 to 10.7 to 10.7 to 1
NET POSITION TREND:
– Strength Index Score (3 Year Range Pct):53.851.656.2
– Strength Index Reading (3 Year Range):BullishBullishBullish
NET POSITION MOVEMENT INDEX:
– 6-Week Change in Strength Index:14.8-16.20.9


COTTON Futures:

COTTON Futures COT ChartThe COTTON large speculator standing this week equaled a net position of 51,767 contracts in the data reported through Tuesday. This was a weekly lift of 282 contracts from the previous week which had a total of 51,485 net contracts.

This week’s current strength score (the trader positioning range over the past three years, measured from 0 to 100) shows the speculators are currently Bullish with a score of 52.7 percent. The commercials are Bearish with a score of 46.5 percent and the small traders (not shown in chart) are Bullish with a score of 62.1 percent.

COTTON Futures StatisticsSPECULATORSCOMMERCIALSSMALL TRADERS
– Percent of Open Interest Longs:37.043.77.2
– Percent of Open Interest Shorts:12.671.83.4
– Net Position:51,767-59,7617,994
– Gross Longs:78,59992,71715,280
– Gross Shorts:26,832152,4787,286
– Long to Short Ratio:2.9 to 10.6 to 12.1 to 1
NET POSITION TREND:
– Strength Index Score (3 Year Range Pct):52.746.562.1
– Strength Index Reading (3 Year Range):BullishBearishBullish
NET POSITION MOVEMENT INDEX:
– 6-Week Change in Strength Index:9.5-12.133.1


COCOA Futures:

COCOA Futures COT ChartThe COCOA large speculator standing this week equaled a net position of 8,311 contracts in the data reported through Tuesday. This was a weekly boost of 9,461 contracts from the previous week which had a total of -1,150 net contracts.

This week’s current strength score (the trader positioning range over the past three years, measured from 0 to 100) shows the speculators are currently Bearish with a score of 25.8 percent. The commercials are Bullish with a score of 73.3 percent and the small traders (not shown in chart) are Bearish with a score of 43.1 percent.

COCOA Futures StatisticsSPECULATORSCOMMERCIALSSMALL TRADERS
– Percent of Open Interest Longs:33.445.44.8
– Percent of Open Interest Shorts:30.649.93.2
– Net Position:8,311-12,9684,657
– Gross Longs:96,892131,59613,945
– Gross Shorts:88,581144,5649,288
– Long to Short Ratio:1.1 to 10.9 to 11.5 to 1
NET POSITION TREND:
– Strength Index Score (3 Year Range Pct):25.873.343.1
– Strength Index Reading (3 Year Range):BearishBullishBearish
NET POSITION MOVEMENT INDEX:
– 6-Week Change in Strength Index:8.7-11.630.4


WHEAT Futures:

WHEAT Futures COT ChartThe WHEAT large speculator standing this week equaled a net position of -11,499 contracts in the data reported through Tuesday. This was a weekly decline of -3,243 contracts from the previous week which had a total of -8,256 net contracts.

This week’s current strength score (the trader positioning range over the past three years, measured from 0 to 100) shows the speculators are currently Bearish-Extreme with a score of 4.1 percent. The commercials are Bullish-Extreme with a score of 80.9 percent and the small traders (not shown in chart) are Bullish-Extreme with a score of 92.7 percent.

WHEAT Futures StatisticsSPECULATORSCOMMERCIALSSMALL TRADERS
– Percent of Open Interest Longs:30.941.510.2
– Percent of Open Interest Shorts:34.936.311.4
– Net Position:-11,49914,914-3,415
– Gross Longs:89,300119,73329,557
– Gross Shorts:100,799104,81932,972
– Long to Short Ratio:0.9 to 11.1 to 10.9 to 1
NET POSITION TREND:
– Strength Index Score (3 Year Range Pct):4.180.992.7
– Strength Index Reading (3 Year Range):Bearish-ExtremeBullish-ExtremeBullish-Extreme
NET POSITION MOVEMENT INDEX:
– 6-Week Change in Strength Index:-23.516.732.6


Article By InvestMacroReceive our weekly COT Reports by Email

*COT Report: The COT data, released weekly to the public each Friday, is updated through the most recent Tuesday (data is 3 days old) and shows a quick view of how large speculators or non-commercials (for-profit traders) were positioned in the futures markets.

The CFTC categorizes trader positions according to commercial hedgers (traders who use futures contracts for hedging as part of the business), non-commercials (large traders who speculate to realize trading profits) and nonreportable traders (usually small traders/speculators) as well as their open interest (contracts open in the market at time of reporting). See CFTC criteria here.