The Analytical Overview of the Main Currency Pairs on 2022.10.17

By JustMarkets

The EUR/USD currency pair

Technical indicators of the currency pair:
  • Prev Open: 0.9772
  • Prev Close: 0.9720
  • % chg. over the last day: -0.53 %

On Friday, ECB representative Mārtiņš Kazāks pointed out that the ECB no longer needs to hang on to a large balance, so a rate hike of 75 basis points in October is appropriate, 50 BPS or 75 BPS in December. Other ECB representatives, namely Chief Economist Philip Lane and Klaas Knot from the Netherlands, are of the same opinion. At the same time, Mr. Knot said that the ECB needs to raise rates above the neutral level of 2%. At the moment, the ECB is keeping the rate at 1.25%.

Trading recommendations
  • Support levels: 0.9701
  • Resistance levels: 0.9856, 0.9961, 1.0058, 1.0111, 1.0162, 1.0230

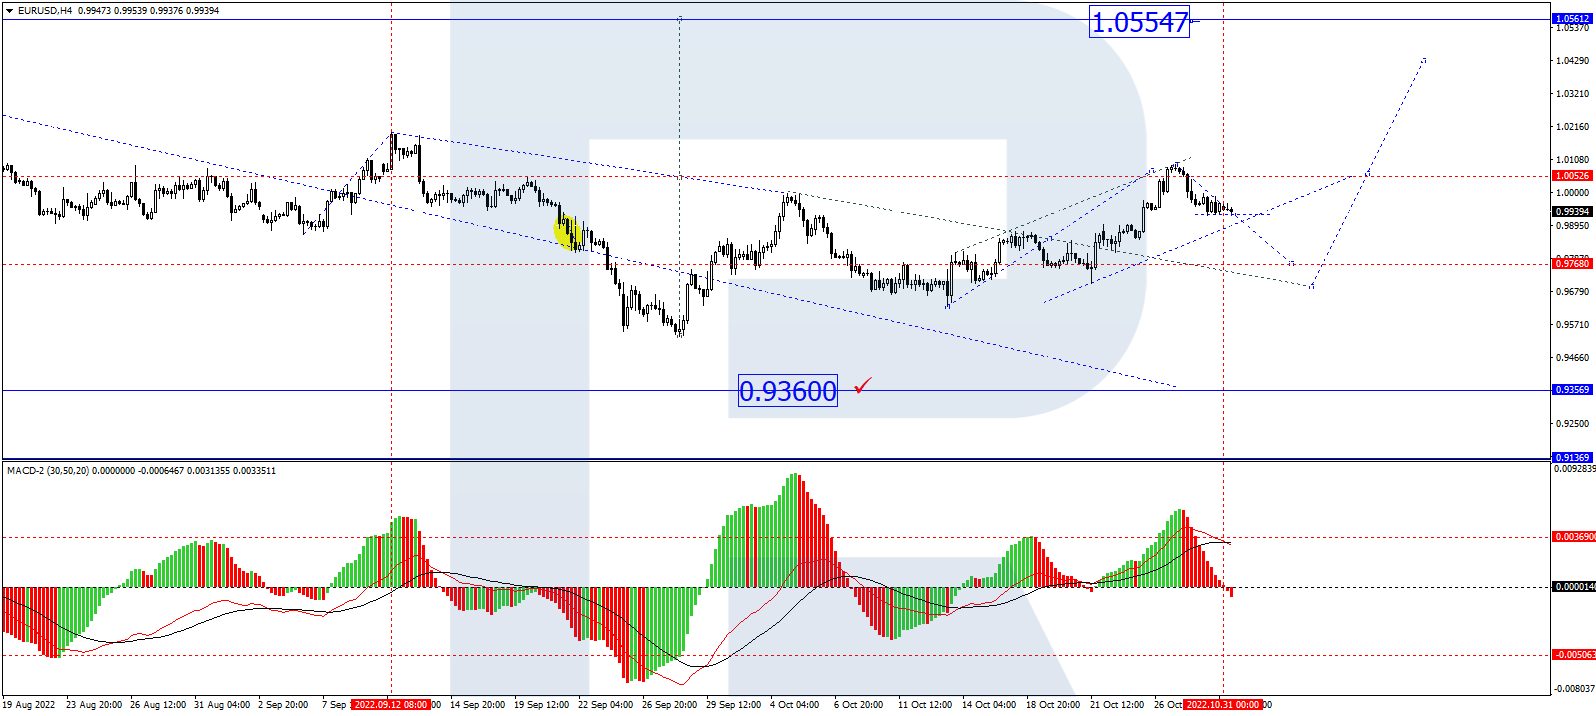
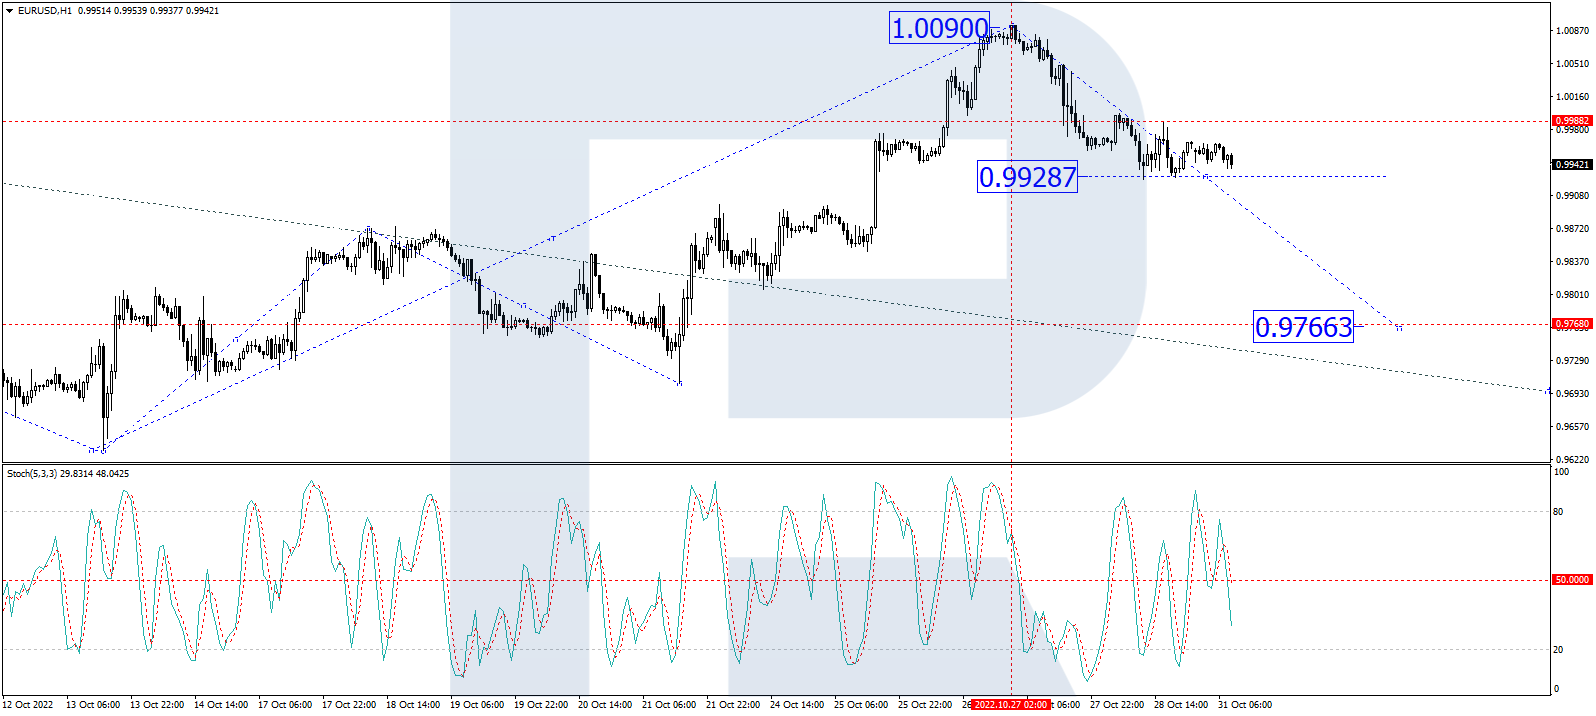
From the technical point of view, the trend on the EUR/USD currency pair on the hourly time frame is bullish. The price is trading at the level of the moving averages. The MACD indicator has become inactive, but the pressure of buyers remains. Buy trades should be considered from the support level of 0.9701, but with additional confirmation in the form of reverse initiative. Sell deals can be considered from the resistance level of 0.9856, but only with confirmation.

Alternative scenario: if the price breaks down through the support level of 0.9666 and fixes below it, the downtrend will likely resume.

EUR/USD
News feed for 2022.10.17:
  • – Italian Consumer Price Index (m/m) at 11:00 (GMT+3);
  • – US NY Empire State Manufacturing Index (m/m) at 15:30 (GMT+3).

The GBP/USD currency pair

Technical indicators of the currency pair:
  • Prev Open: 1.1318
  • Prev Close: 1.1161
  • % chg. over the last day: -1.41 %

British government bonds will trade this week without the support of the Bank of England’s emergency bond-buying program, which ended on Friday. Britain’s new chancellor Jeremy Hunt said over the weekend that he could restore the country’s public finances. Reports that the government is preparing to dramatically alter planned tax cuts helped ease fears about public finances, but that must translate into concrete plans to avoid another bond sell-off. According to analysts, the British economy is at risk of slipping into recession next year. Bank governor Andrew Bailey said Saturday that he believes a significant rate hike will be needed in early November.

Trading recommendations
  • Support levels: 1.1186, 1.1093, 1.0915, 1.0817
  • Resistance levels: 1.1353, 1.1478, 1.1693, 1.1816, 1.1901

From the technical point of view, the trend on the GBP/USD currency pair on the hourly time frame is bullish. The price is trading at the level of the moving averages. The MACD indicator has become inactive, but buyers’ pressure remains. Under such market conditions, buy trades can be considered from the support level of 1.1186 or 1.1229, but better after confirmation. It is better to look for sell trades on intraday time frames. The nearest resistance level is 1.1353.

Alternative scenario: if the price breaks down of the 1.0915 support level and fixes below it, the downtrend will likely resume.

GBP/USD
There is no news feed for today.

The USD/JPY currency pair

Technical indicators of the currency pair:
  • Prev Open: 147.07
  • Prev Close: 148.74
  • % chg. over the last day: +1.14 %

The Bank of Japan may take new steps to strengthen the currency. Bank of Japan Deputy Governor Masazumi Wakatabe said Saturday that recent fluctuations in the yen have been “too fast and too one-sided,” indicating concerns about the possible economic consequences of the currency falling to a 32-year low against the dollar. Japan intervened in the currency market in September to stop the yen’s plummet. However, the divergence in monetary policy between the US Federal Reserve and the Bank of Japan is still pushing the USD/JPY quotes up. BoJ governor Kuroda said on Saturday that inflation in Japan is rising mainly because of cost-push factors, so the Bank of Japan will continue to maintain its soft monetary policy.

Trading recommendations
  • Support levels: 147.67, 146.21, 145.93, 144.91, 144.16, 143.00, 140.60, 139.61
  • Resistance levels: 149.00, 150.00

From the technical point of view, the medium-term trend on the currency pair USD/JPY is bullish. The price is trading above the moving levels. The price is trading above the moving levels. The MACD indicator is in the positive zone, and the pressure of buyers remains. Under such market conditions, buy trades can be searched for on intraday time frames from the support level of 147.67, but with confirmation. Sell deals can be searched from the resistance level of 149.00 or 150.00, but only with additional confirmation in the form of a reverse initiative.

Alternative scenario: If the price fixes below 145.95, the downtrend will likely resume.

USD/JPY
News feed for 2022.10.17:
  • – Japan Industrial Production (m/m) at 07:30 (GMT+3).

The USD/CAD currency pair

Technical indicators of the currency pair:
  • Prev Open: 1.3740
  • Prev Close: 1.3881
  • % chg. over the last day: +1.03 %

Bank of Canada Governor Tiff Macklem pointed out at the International Monetary Fund meeting in Washington that overall inflation in Canada has declined by about a percentage point over the past couple of months. Still, there is not yet a reversal in the core inflation components as inflation continues to rise for goods and services. Macklem also added that short-term inflation expectations are rising along with inflation, and the longer inflation remains high, the greater the risk that short-term inflation expectations will turn into longer-term inflation expectations. However, the Governor of the Bank of Canada added that investors should not expect a recession in Canada, only a slowdown in growth.

Trading recommendations
  • Support levels: 1.3816, 1.3619, 1.3583, 1.3535, 1.3454
  • Resistance levels: 1.3858, 1.3968

From the point of view of technical analysis, the trend on the USD/CAD currency pair is bullish. The price is trading above the moving average lines. The MACD indicator is positive, but buyer pressure is decreasing. Under such market conditions, buy trades should be considered on the lower time frames from the support level of 1.3816, but after confirmation in the form of an impulse initiative. For sell deals, it is better to consider the resistance level of 1.3854, but only after additional confirmation in the form of a reverse initiative.

Alternative scenario: if the price breaks down and consolidates below the support level of 1.3706, the downtrend will likely resume.

USD/CAD
News feed for 2022.10.17:
  • – Canada BoC Business Outlook Survey at 17:30 (GMT+3).

By JustMarkets


This article reflects a personal opinion and should not be interpreted as an investment advice, and/or offer, and/or a persistent request for carrying out financial transactions, and/or a guarantee, and/or a forecast of future events.

Lumber Stocks Are Over Valued and Poised for a Plunge

Source: Ron Struthers  (10/15/22)

 Markets will remain in a bear market for some time, and it is best to look for short trades. Lumber stocks ran up in price with high lumber prices and a post-Covid-19 recovery in the economy. They are priced too high and not reflecting lower lumber prices and a softer housing market induced by a coming recession.

Canada Bank Stocks

I will try to pinpoint that. This past Tuesday, the Canadian bank stocks broke down on the charts, except for Royal Bank, which managed to hold at its July low. I show the chart here on CIBC where we have the March 2023 $65 Put option that has a good gain now.

I suggested selling half our Bank of Nova Scotia in March 2023 for $80 Put where we have a 100% gain. The bank stocks are starting to price in a recession and a plunging real estate market. I expect they could test their 2020 Covid lows.

TD Bank had forecast that Canadian house prices would fall -19% by end of 2022. Now they are predicting another -11.2% in 2023. That works out to about a -28% drop, coming in line with my -30% or more prediction. TD’s Sondhi expects home sales to drop -20% below pre-pandemic levels.

That will probably mean a drop in housing construction and lumber prices that have already fallen to pre-pandemic levels. The housing in the U.S. is a different story as it was not so highly leveraged as Canada, but U.S. housing starts have fallen with a combination of a weaker market with labor and supply shortages.

US Housing

That said, an economic slowdown and recession will negatively affect U.S. housing too. Surprise, surprise, surprise, as Gomer Pyle would say.

Well, you should not be, as I have been warning for a year. The September report is the seventh out of nine CPI readings this year to have topped expectations, according to Michael Brown, the senior market analyst at Caxton.

As I have been commenting numerous times, this inflation is entrenched and will be very tough to tame. Year-over-year CPI retreated to 8.2% last month from 8.3% in August, while the annualized increase in core CPI, which strips out volatile food and energy prices, rose to 6.6% from 6.3%. Both numbers came in higher than economists polled by the Wall Street Journal had expected.

The 0.6% core versus a Wall Street forecast of 0.4% was a big shock. The increase in the core rate over the past year climbed to a new peak of 6.6% from 6.3%, marking the biggest gain in 40 years. Take note, it is the core (PCE) that the Fed focuses on.

Markets initially plunged Thursday on the bad inflation report and then rallied in one of the biggest reversals I have ever witnessed. S&P futures peaked +1.57% ahead of the CPI release, bottomed out -2.4%, and the S&P 500 closed +2.6% with a round trip intraday range of 5.52%, according to Deutsche Bank.

The reversal is impressive, and I show a chart on the popular Spyder ETF that represents the S&P 500. What is noteworthy, the volume was not very impressive for such a move. This is a powerful reversal from a new low indicated by a strong engulfing bullish white candle.

All the talk I heard was about this is peak inflation, the market has bottomed, blah blah blah. We could have a bear market rally, and that is it. Bear markets bottom when everyone is bearish and calling for new lows, not bottoms and reversals. This alone convinces me this is no bottom but could be another bear trap a rally emerges.

Thursday could just be a one-day wonder, but if we do get a bear rally, I marked in resistance levels that would relate to 3,700 and 3,900 on the S&P 500. Friday, markets bounced lower off the 3,700 area. I would be surprised if the market could move much above 3,900; all the problems facing the economy and markets have not improved and will probably get worse before they get better.

I commented and had a chart on lumber in May 2021 and called it a bubble top. As it turned out, I was within days of calling that top. Times then were too unpredictable to suggest a way to benefit from lumber decline, but not today.

Lumber

This is a monthly chart until the end of September, and the current lumber price has rallied a little to about US$500. With a recession and weak housing, I expect we will see a drop to $300 and possibly lower.

Lumber prices are back to pre-pandemic levels, but the lumber stocks are still at lofty levels and not priced in a weaker market. They are great short candidates now. U.S. housing starts in June were down to 1.6 million annualized units, their lowest level since September 2021. In July, U.S. housing starts fell further to 1.45 million annualized units but rebounded in August to 1.58 million. Weaker numbers are in store with a Fed-induced recession. I think the best two to short are West Fraser Timber (WFG:NYSE) and Boise Cascade (BCC:NYSE).

Both companies are focused a lot on the lumber market, with West Frazer affected more by Canada and the Canadian housing market than Boise.

The U.S. Commerce Department said Thursday it will decrease the duty rate for most Canadian lumber producers to 8.59%, compared with the current 17.91%.

The Commerce Department had made its intentions known in January to reduce tariffs, proposing a preliminary duty rate of 11.64%, and has now reduced that amount further with the final rate of 8.59%.

This has probably been accounted for in the recent rally in lumber prices.

West Fraser has grown beyond the company’s original base in British Columbia and today is one of the largest lumber and OSB manufacturers in the world.

You can see from the slide above from West Frazer’s Q2 presentation that CA$ earnings are about 100% lumber and Engineered Wood Products (EWP), which are strands, fibers, veneers, or particle boards bound together with strong adhesive.

Currently, Boise looks like a very solid company.

There was a substantial earnings decline from Q1 to Q2, and lumber prices have seen a further decline in Q3.

West Frazer also shipped a lot more volume in Q2 over Q1, with lumber shipments up +17% as transportation constraints eased in Western Canada. OSB (board) shipments were also up 10%. This was shown on slide six of their presentation, with slide 16 below showing huge dependence on housing.

The Housing Market

It does not take a rocket scientist to know that a recession and rapidly rising interest rates will crush the housing markets. Credit Suisse says.

“Our lower estimates reflect our expectation of a sharp slowing of housing turnover and a reduction in home improvement spending in 2023 based on this lower turnover,” wrote analyst Dan Oppenheim in a note to clients Friday.

West Frazer stock ran up in price because of the housing boom and high lumber prices caused by Covid-19 policies. Lumber prices have come down, and the housing boom is ending as North America falls into a recession.

The stock ran up about 120% from around CA$60 in 2019 to the 2022 high of CA$132, and it is currently not reflecting lower lumber prices and a looming recession with a housing slowdown.

I expect the stock can easily drop to around $66 and, with a bad recession, could easily see prices back to around $40. I would sell the stock, short it, and/or buy Put Options.

I like the February 2023 $110 Put for about $14. There is little activity on these, but on the U.S. side, in February 2023, $70 Put around $5.00 has more trading, showing huge dependence on housing.

Boise Cascade’s recent price was $58.60.

Boise is totally focused on the U.S., and that is why I prefer West Frazer more of a short because of the Canadian market exposure.

Nevertheless, I expect Boise stock will take quite a haircut in a poor housing market driven by high-interest rates and a U.S. recession. Boise also has a big focus on residential real estate and home improvements.

What I am saying is the good times are over, so sales and profits have peaked and will soon decline.

They are one of the largest U.S. wholesale building products distributors, with 38 warehouse centers and one truss plant.

This partial slide on the right from their presentation is interesting because it shows that 79% of sales were from their Building Materials distribution segment but only accounted for 49% of profits. It is a clear sign that high lumber prices have driven high profits in their Wood Products Division. As I mentioned above, lumber prices have dropped further in Q3.

Currently, Boise looks like a very solid company, as shown in the slide below from their presentation, and had strong sales and earnings growth since 2020. What I am saying is the good times are over, so sales and profits have peaked and will soon decline.

Boise gives this warning in their Q2 financials: “As a manufacturer of certain commodity products, we have sales and profitability exposure to declines in commodity product prices and rising input costs. Our distribution business purchases and resells a broad mix of commodity products with periods of increasing prices, providing the opportunity for higher sales and increased margins, while declining price environments expose us to declines in sales and profitability. We expect future commodity product pricing and commodity input costs to be volatile in response to economic uncertainties, industry operating rates, transportation constraints or disruptions, net import and export activity, inventory levels in various distribution channels, and seasonal demand patterns. EWP and general line products have historically experienced limited price volatility but are also subject to price erosion as economic activity slows. “

Boise has a very similar chart to West Frazer, just at a different price level. The percentage gain from 2019 and the potential percentage drop are around the same. For Put options, I like January 2023, $60 Put for around $6.00.

Struthers Stock Report Disclaimers: 

All forecasts and recommendations are based on opinion. Markets change direction with consensus beliefs, which may change at any time and without notice. The author/publisher of this publication has taken every precaution to provide the most accurate information possible. The information & data were obtained from sources believed to be reliable, but because the information & data source are beyond the author’s control, no representation or guarantee is made that it is complete or accurate.

The reader accepts information on the condition that errors or omissions shall not be made the basis for any claim, demand or cause for action. Because of the ever-changing nature of information & statistics the author/publisher strongly encourages the reader to communicate directly with the company and/or with their personal investment adviser to obtain up to date information.

Past results are not necessarily indicative of future results. Any statements non-factual in nature constitute only current opinions, which are subject to change. The author/publisher may or may not have a position in the securities and/or options relating thereto, & may make purchases and/or sales of these securities relating thereto from time to time in the open market or otherwise. Neither the information, nor opinions expressed, shall be construed as a solicitation to buy or sell any stock, futures or options contract mentioned herein. The author/publisher of this letter is not a qualified financial adviser & is not acting as such in this publication.

Charts provided by author.

Disclosures: 

1) Ron Struthers: I, or members of my immediate household or family, own shares of the following companies mentioned in this article: None. I personally am, or members of my immediate household or family are, paid by the following companies mentioned in this article: None. My company currently has a financial relationship with the following companies mentioned in this article: None. I determined which companies would be included in this article based on my research and understanding of the sector.

2) The following companies mentioned in this article are billboard sponsors of Streetwise Reports: None. Click here for important disclosures about sponsor fees. The information provided above is for informational purposes only and is not a recommendation to buy or sell any security.

3) Statements and opinions expressed are the opinions of the author and not of Streetwise Reports or its officers. The author is wholly responsible for the validity of the statements. The author was not paid by Streetwise Reports for this article. Streetwise Reports was not paid by the author to publish or syndicate this article. Streetwise Reports requires contributing authors to disclose any shareholdings in, or economic relationships with, companies that they write about. Streetwise Reports relies upon the authors to accurately provide this information and Streetwise Reports has no means of verifying its accuracy.

4) This article does not constitute investment advice. Each reader is encouraged to consult with his or her individual financial professional and any action a reader takes as a result of information presented here is his or her own responsibility. By opening this page, each reader accepts and agrees to Streetwise Reports’ terms of use and full legal disclaimer. This article is not a solicitation for investment. Streetwise Reports does not render general or specific investment advice and the information on Streetwise Reports should not be considered a recommendation to buy or sell any security. Streetwise Reports does not endorse or recommend the business, products, services, or securities of any company mentioned on Streetwise Reports.

5) From time to time, Streetwise Reports LLC and its directors, officers, employees, or members of their families, as well as persons interviewed for articles and interviews on the site, may have a long or short position in the securities mentioned. Directors, officers, employees, or members of their immediate families are prohibited from making purchases and/or sales of those securities in the open market or otherwise from the time of the decision to publish an article until three business days after the publication of the article. The foregoing prohibition does not apply to articles that in substance only restate previously published company releases.


Inflation risks are still skewed upward. China is targeting green energy

By JustForex

The US dollar rose about 0.45% last week, helped by rising US Treasury bond yields. While the overall annual consumer price Index slowed slightly in September, the core Index increased to its highest level since 1982, a sign that price pressures in the US economy remain consistently high. With inflation risks skewed upward, the Fed is likely to continue raising interest rates in the coming months, even if a cycle of aggressive tightening triggers a recession in the economy. On Saturday, the US Fed spokesman Bullard said last week’s consumer price Index data showed that inflation had become “harmful” and left the door open for a 75 basis point rate hike at the upcoming Fed meetings in November and December, but added that it’s still too early to talk about it.

At the close of the stock market on Friday, the Dow Jones Index (US30) decreased by 1.34% (+0.73% for the week), and the S&P500 Index (US500) lost 2.37% (-1.77% for the week). The technology Index NASDAQ (US100) fell by 3.08% on Friday (-3.18% for the week).

This week is the start of the third-quarter earnings season in the United States. Analysts expect S&P 500 corporate earnings to rise 4.1% year-over-year, the slowest growth since the fourth quarter of 2020.

Bank of Canada Governor Tiff Macklem said there was a “broad consensus” at the IMF and World Bank meeting that inflation is the most immediate threat to “the present and the future.”

Equity markets in Europe were mostly up on Friday. German DAX (DE30) gained 0.67% (+2.15% for the week), French CAC 40 (FR40) added 0.90% (+2.16% for the week), Spanish IBEX 35 (ES35) increased by 0.46% (-0.12% for the week), British FTSE 100 (UK100) closed Friday with 0.15% (-1.89% for the week).

According to Pierre Wunsch of the ECB Governing Council, government efforts to ease the energy crisis risk forcing the European Central Bank to raise interest rates more aggressively. Wunsch believes that it is already “reasonable” for the ECB to raise the cost of borrowing to 3% from 0.75%. Wunsch also added that a technical recession, usually defined as two consecutive quarters of shrinking output, is now a “baseline scenario” in Europe. However, that by itself is not enough to keep inflation under control.

Britain’s new finance minister, Jeremy Hunt, promised to restore confidence in the British economy by fully reporting on the government’s tax and spending plans. British Prime Minister Liz Truss appointed Hunt in an attempt to salvage her leadership as confidence in her ability to run the country dwindled. Investors have been actively selling British government bonds since Sept. 23, when Hunt’s predecessor, Kwasi Kwarteng, announced a series of unwarranted tax cuts without publishing a series of independent economic forecasts. The side effects forced the Bank of England to intervene in an emergency to protect pension funds and increased the cost of mortgages, further exacerbating the finances of Britons. The first test for Hunt and Truss will come as early as today when trading on the bond market resumes without the support of the Bank of England’s bond purchase program, which expired on Friday.

In the oil market, the situation remains tense. The White House noted last week that OPEC+ production cuts would boost Russia’s revenues, increasing funding for its invasion of Ukraine. In response, Saudi Arabia’s minister said the October 5 decision to cut production by 2 million BPD was unanimous and based on economic factors, with OPEC+ countries seeking to maintain balance in oil markets. Experts believe that OPEC+ is manipulating prices to keep the price of “black gold” above $90 per barrel.

Asian markets traded flat last week. Japan’s Nikkei 225 (JP225) jumped by 0.43% over the week, Hong Kong’s Hang Seng (HK50) decreased by 4.94% over the week, and Australia’s S&P/ASX 200 (AU200) lost 0.06% over the week.

In his speech at the opening session of the ruling Communist Party’s five-year congress, Xi Jinping said that China will prioritize protecting the environment and promoting a green lifestyle and that preserving nature is an integral part of building a modern socialist country. China will support low-carbon industries, pursue an “energy revolution,” and build a new energy system while continuing to promote the clean and efficient use of coal. “China’s international influence, attractiveness, and ability to shape the world have increased significantly,” Xi said Sunday in Beijing in a wide-ranging speech. Nevertheless, he warned of a more volatile international environment, saying that China must be prepared for “strong winds, high waves, and even dangerous storms.” Analysts believe that the issue here is an increase in tensions between the US and China. Beijing’s actions to suppress dissent in Hong Kong and Xinjiang, its lack of transparency about Covid origins, its partnership with Russia amid its invasion of Ukraine, and its more aggressive stance toward Taiwan have all increased tensions between the world’s two largest economies. Xi Jinping is expected to retain his position and consolidate his power when the new leadership is announced in about a week. Economists also expect Beijing to miss its annual gross domestic product target by a wide margin this year for the first time since it began setting such targets in the early 1990s.

Bank of Japan Governor Kuroda said Saturday that inflation in Japan is rising mainly because of cost-push factors, so the Bank of Japan will continue to keep its monetary policy soft.

On the commodities market, lumber futures (+10.55%), oats (+4.45%), and orange juice (+1.43%) showed the biggest gains by the end of the week. Futures on silver (-10.15%), coffee (-9.54%), palladium (-8.59%), WTI oil (-7.65%), Brent oil (-6.6%), natural gas (-4.03%), gasoline (-3.77%) and gold (-3.46%) showed the biggest drop.

S&P 500 (F) (US500) 3,583.07 −86.84 (−2.37%)

Dow Jones (US30) 29,634.83 −403.89 (−1.34%)

DAX (DE40) 12,437.81 +82.23 (+0.67%)

FTSE 100 (UK100) 6,858.79 +8.52 (+0.12%)

USD Index 113.30 +0.94 (+0.83%)

Important events for today:
  • – China Export (m/m) at 06:00 (GMT+3);
  • – China Imports (m/m) at 06:00 (GMT+3);
  • – Japan Industrial Production (m/m) at 07:30 (GMT+3);
  • – Italian Consumer Price Index (m/m) at 11:00 (GMT+3);
  • – US NY Empire State Manufacturing Index (m/m) at 15:30 (GMT+3);
  • – Canada BoC Business Outlook Survey at 17:30 (GMT+3).

By JustForex


This article reflects a personal opinion and should not be interpreted as an investment advice, and/or offer, and/or a persistent request for carrying out financial transactions, and/or a guarantee, and/or a forecast of future events.

Speculator Extremes: Bitcoin, Nikkei, Ultra 10s & Canadian Dollar top Bullish & Bearish Positions

By InvestMacro

The latest update for the weekly Commitment of Traders (COT) report was released by the Commodity Futures Trading Commission (CFTC) on Friday for data ending on October 11th.

This weekly Extreme Positions report highlights the Top Most Bullish and Top Most Bearish Positions for the speculator category. Extreme positioning in these markets can foreshadow strong moves in the underlying market.

To signify an extreme position, we use the Strength Index (also known as the COT Index) of each instrument, a common method of measuring COT data. The Strength Index is simply a comparison of current trader positions against the range of positions over the previous 3 years. We use over 80 percent as extremely bullish and under 20 percent as extremely bearish. (Compare Strength Index scores across all markets in the data table or cot leaders table).

We added new charts this week that gives a trend view with the linear regression and a 20-week moving average. Note that the weekly candles close on Tuesdays to match up with the COT data and will have significant gaps.


This Week’s Most Bullish Speculator Positions:

Bitcoin

The Bitcoin speculator position comes in as the most bullish extreme standing this week. The Bitcoin speculator level is currently at a 91.9 percent score of its 3-year range.

Bitcoin’s strength score jumped from 76.4 percent last week with a gain in speculator bets this week.


Nikkei 225

The Nikkei 225 speculator position comes next in the extreme standings this week. The Nikkei 225 speculator level is now at a 85.3 percent score of its 3-year range.

Despite the speculator extreme, the Nikkei ETF price has been on a sharp downfall as seen in the chart.


Soybean Meal

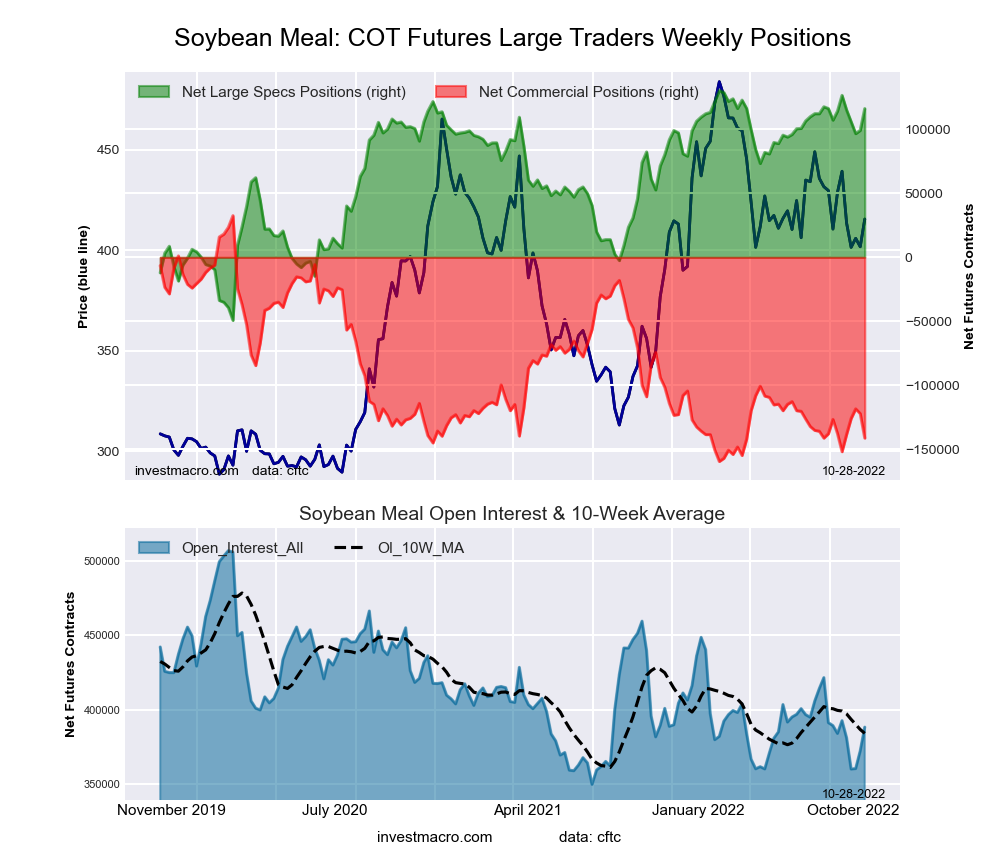
The Soybean Meal speculator position comes in third this week in the extreme standings. The Soybean Meal speculator level resides at a 81.3 percent score of its 3-year range.


This Week’s Most Bearish Speculator Positions:

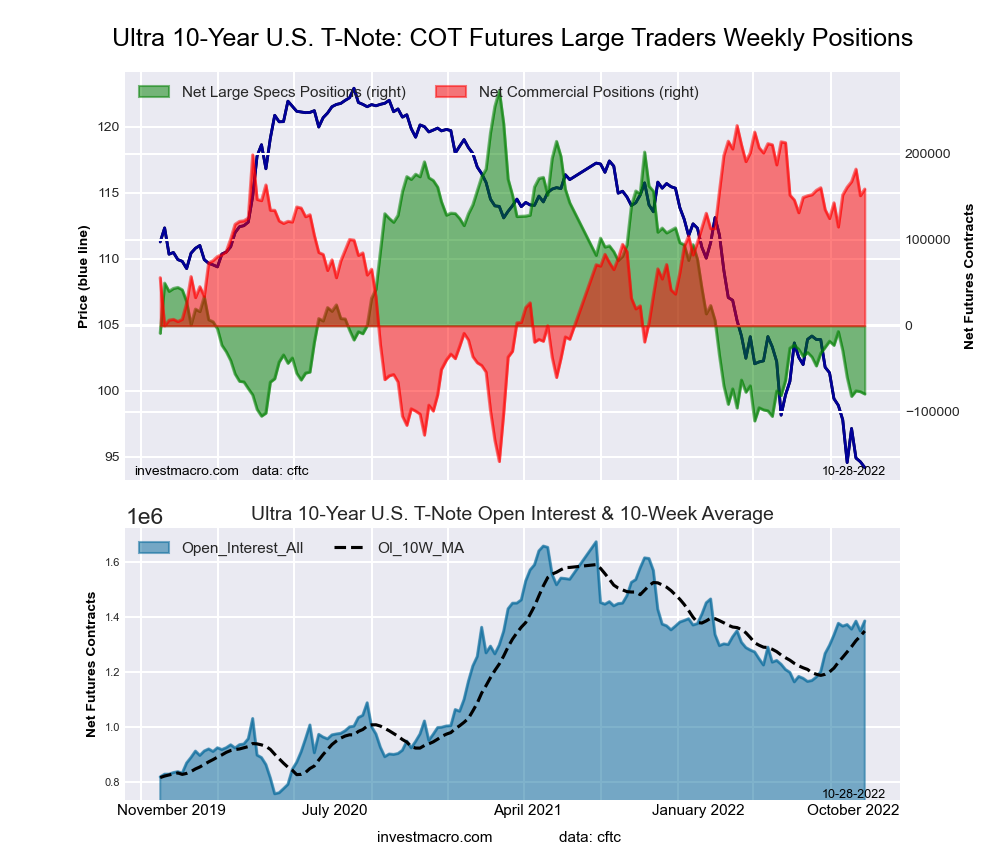
Ultra 10-Year U.S. T-Note

The Ultra 10-Year U.S. T-Note speculator position comes in as the most bearish extreme standing this week. The Ultra 10-Year speculator level is at just a 9.1 percent score of its 3-year range.

The Ultra 10-Year Note is a futures product that stays very close to the actual 10-Year Bond and has an approximate maturity between 9 and a half years and 10 years (Compared to the original 10-Year Bond futures that has a maturity from 7-10 years).


Canadian Dollar

The Canadian Dollar speculator position comes in next for the most bearish extreme standing on the week. The CAD speculator level is at a 10.5 percent score of its 3-year range.

The exchange rate for the Canadian dollar against the US dollar is near two-year lows at the moment.


2-Year Bond

The 2-Year Bond speculator position comes in as third most bearish extreme standing of the week. The 2-Year Note speculator level resides at a 10.8 percent score of its 3-year range.

The 2-Year has been falling sharply since the US Federal Reserve started hiking interest rates and could likely continue lower as inflation remains high. The yield on the 2-Year has climbed to 4.50 percent.


MSCI EAFE MINI

The MSCI EAFE MINI speculator position comes in as this week’s fourth most bearish extreme standing. The EAFE speculator level is at a 11.4 percent score of its 3-year range.

The EAFE ETF price has fallen with the speculator sentiment as seen on the chart and has fallen to the lowest levels since May 2020.


5-Year Bond

Finally, the 5-Year Bond speculator position comes in as the fifth most bearish extreme standing for this week. The 5-Year Bond speculator level is at a 12.3 percent score of its 3-year range.

Like the 2-Year, the 5-Year has been on a steep downtrend this year as the Fed and central banks around the world up their interest rates due to high inflation. Currently, this bond ETF level has fallen to the lowest price since 2011.


Article By InvestMacroReceive our weekly COT Newsletter

*COT Report: The COT data, released weekly to the public each Friday, is updated through the most recent Tuesday (data is 3 days old) and shows a quick view of how large speculators or non-commercials (for-profit traders) were positioned in the futures markets.

The CFTC categorizes trader positions according to commercial hedgers (traders who use futures contracts for hedging as part of the business), non-commercials (large traders who speculate to realize trading profits) and nonreportable traders (usually small traders/speculators) as well as their open interest (contracts open in the market at time of reporting). See CFTC criteria here.

Commodity Currencies (Loonie, Aussie & Kiwi) lead COT Speculators bet changes this week

By InvestMacro

Here are the latest charts and statistics for the Commitment of Traders (COT) data published by the Commodities Futures Trading Commission (CFTC).

The latest COT data is updated through Tuesday October 11th and shows a quick view of how large market participants (for-profit speculators and commercial traders) were positioned in the futures markets. All currency positions are in direct relation to the US dollar where, for example, a bet for the euro is a bet that the euro will rise versus the dollar while a bet against the euro will be a bet that the euro will decline versus the dollar.

Weekly Speculator Changes led by British pound sterling & Japanese Yen

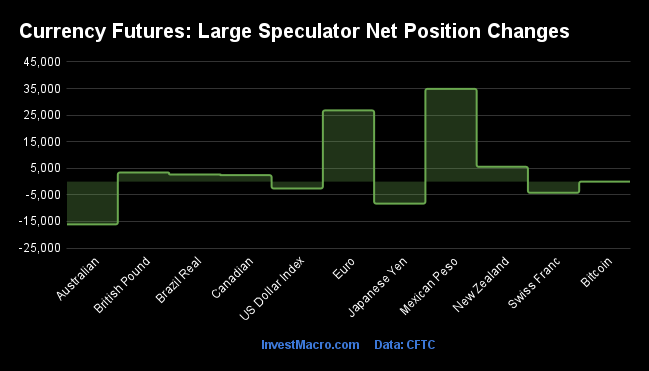
The COT currency market speculator bets were higher this week as seven out of the eleven currency markets we cover had higher positioning while the other four markets had lower speculator contracts.

Leading the gains for the currency markets was the British pound sterling (10,369 contracts) with the Japanese yen (4,230 contracts), the Mexican peso (3,667 contracts), the US Dollar Index (1,089 contracts), the Swiss franc (962 contracts), Bitcoin (889 contracts) and the Brazilian real (296 contracts) also showing a positive week.

The currencies leading the declines in speculator bets this week were the Euro (-6,183 contracts) with the New Zealand dollar (-5,064 contracts), the Canadian dollar (-4,265 contracts) and the Australian dollar (-3,507 contracts) also registering lower bets on the week.

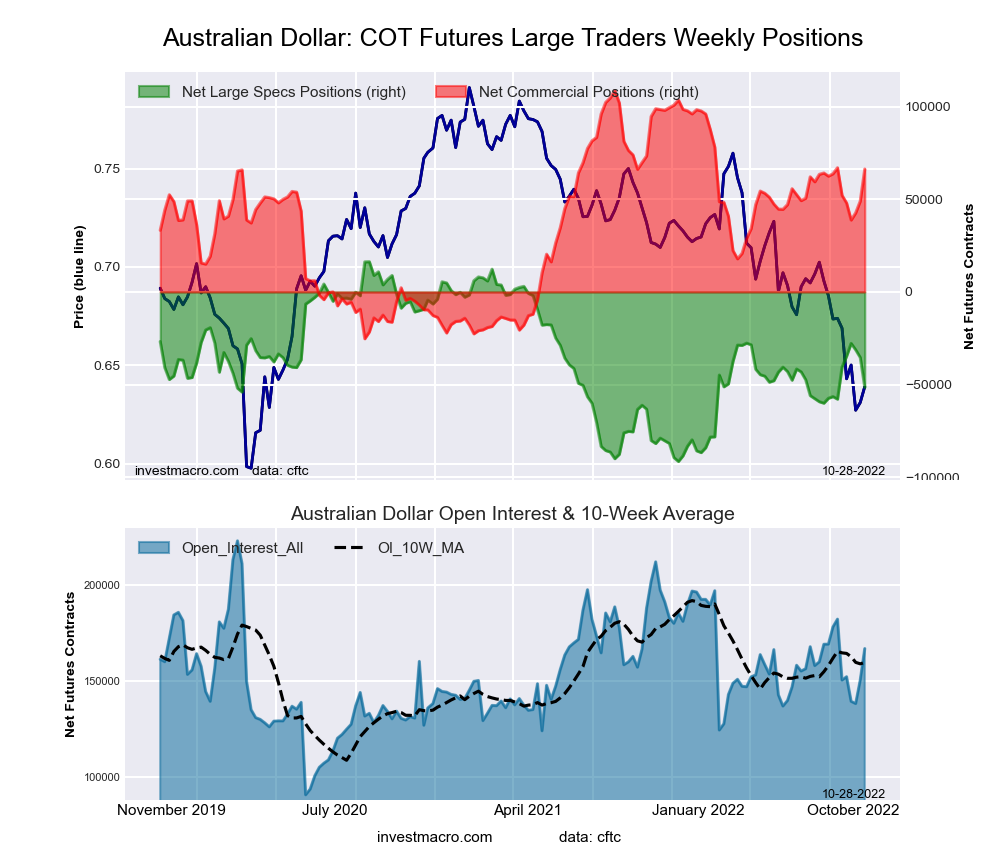
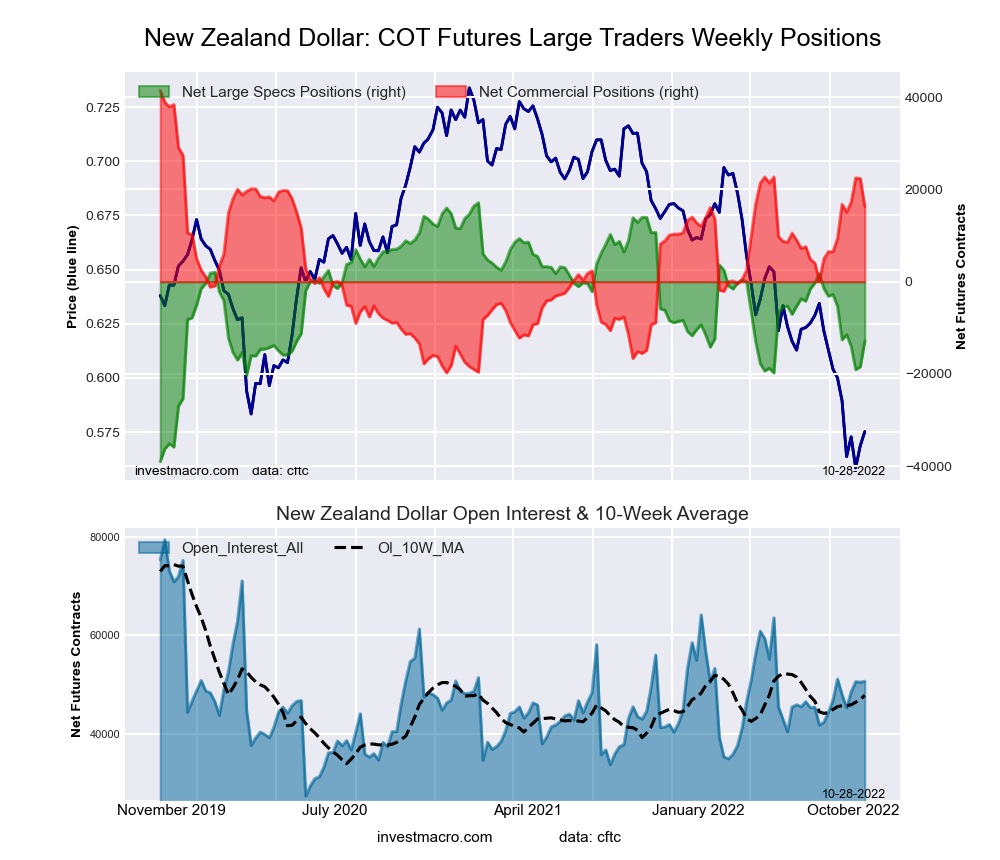
Highlighting the COT currencies this week is the weakness for the commodity currencies. The Australian dollar, New Zealand dollar and the Canadian dollar all had lower speculator bets this week and are all firmly in negative territory at the moment.

The Canadian dollar speculator positions fell this week for the sixth consecutive week and have declined by a total of -49,851 contracts over that time-period. This recent weakness has brought the CAD bets to their most bearish level in 52 weeks, dating back to October 12th of 2021. The CAD exchange level has been sharply falling as well and dropped this week to its lowest level since May of 2020.

The New Zealand dollar positions declined for the second straight week and for the fourth time in the past five weeks. Speculators have now pushed their overall net positioning (-19,042 contracts) to the most bearish level in the past 18 weeks, dating back to June 7th. NZD spec positions have been bearish for twenty-three out of the last twenty-four weeks. The New Zealand dollar price has been on the defensive and has, in particular, been dropping sharply over the past six weeks (over -500 pips). The NZDUSD currency pair this week also touched the lowest level since the pandemic lows of March 2020 below the 0.5600 exchange rate.

The Australian dollar spec positioning, meanwhile, fell this week for the first time in four weeks. Aussie speculator positions have now been in a continuous bearish level for 73 straight weeks, dating back to May 18th of 2021. Although the current positioning (-31,271 contracts) is near the lower end of the bearish range that has seen levels above -80,000 contracts, the AUD currency price has also been dropping. The AUDUSD currency pair has fallen for five straight weeks and hit its lowest level against the US dollar since April of 2020.

All three of these currencies are currently oversold against the US dollar on the weekly Relative Strength Index (RSI) and worth watching for potential peaks in the weeks and months ahead.


Data Snapshot of Forex Market Traders | Columns Legend
Oct-11-2022OIOI-IndexSpec-NetSpec-IndexCom-NetCOM-IndexSmalls-NetSmalls-Index
USD Index54,6157732,78680-36,847174,06161
EUR639,3485237,49947-60,1615922,66215
GBP255,64971-39,1703564,80478-25,6348
JPY245,00777-77,3932194,44982-17,05619
CHF43,74828-5,8904217,98372-12,09317
CAD144,00026-25,6721127,36692-1,69427
AUD138,32036-31,2715642,69251-11,42125
NZD50,55745-19,0423722,51767-3,47512
MXN206,17052-33,6541327,839845,81568
RUB20,93047,54331-7,15069-39324
BRL41,3602826,07576-27,966241,89187
Bitcoin15,7569385792-1,077022018


Strength Scores led by Bitcoin, US Dollar Index & Brazilian Real

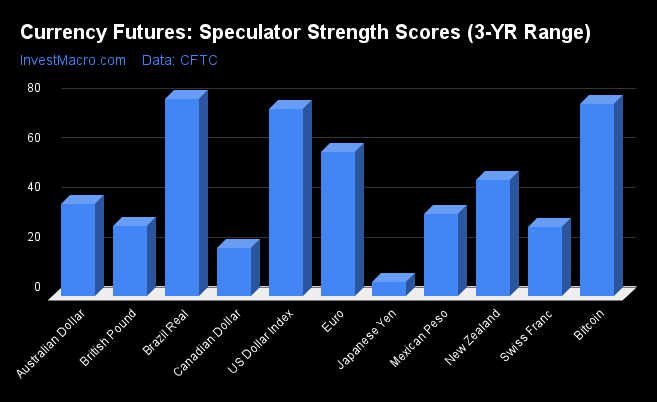
Strength Scores (a normalized measure of Speculator positions over a 3-Year range, from 0 to 100 where above 80 is extreme bullish and below 20 is extreme bearish) showed that Bitcoin (91.9 percent) jumped back to lead the currency markets and is in a bullish extreme position above 80 percent. The US Dollar Index (79.6 percent) and the Brazilian Real (76.0 percent) come in as the next highest in the currency markets for strength scores.

On the downside, the Canadian Dollar (10.5 percent) and the Mexican Peso (13.0 percent) come in at the lowest strength level currently and are both in extreme bearish positions this week.

Strength Statistics:
US Dollar Index (79.6 percent) vs US Dollar Index previous week (77.8 percent)
EuroFX (46.5 percent) vs EuroFX previous week (48.4 percent)
British Pound Sterling (35.4 percent) vs British Pound Sterling previous week (26.5 percent)
Japanese Yen (21.2 percent) vs Japanese Yen previous week (18.6 percent)
Swiss Franc (41.6 percent) vs Swiss Franc previous week (39.1 percent)
Canadian Dollar (10.5 percent) vs Canadian Dollar previous week (15.3 percent)
Australian Dollar (55.8 percent) vs Australian Dollar previous week (59.1 percent)
New Zealand Dollar (37.1 percent) vs New Zealand Dollar previous week (45.9 percent)
Mexican Peso (13.0 percent) vs Mexican Peso previous week (11.4 percent)
Brazilian Real (76.0 percent) vs Brazilian Real previous week (75.7 percent)
Bitcoin (91.9 percent) vs Bitcoin previous week (76.4 percent)

Strength Trends led by EuroFX, Australian Dollar &

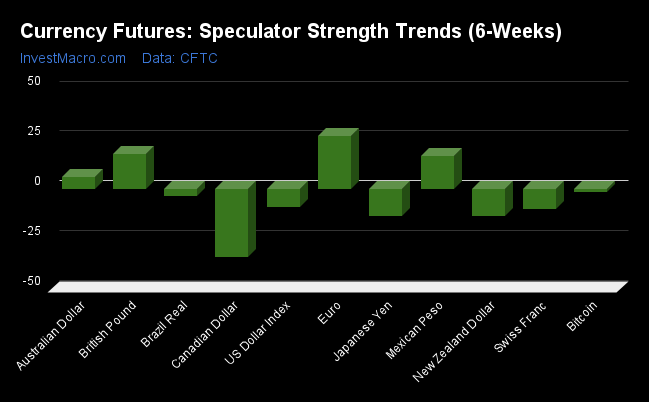
Strength Score Trends (or move index, calculates the 6-week changes in strength scores) show that the EuroFX (26.1 percent) leads the past six weeks trends for the currency markets this week. The Australian Dollar (24.2 percent) and the Brazilian Real (16.9 percent) fill out the next top movers in the latest trends data.

The Canadian Dollar (-56.0 percent) leads the downside trend scores currently while the next markets with lower trend scores were the New Zealand Dollar (-27.7 percent) and the Japanese Yen (-22.1 percent).

Strength Trend Statistics:
US Dollar Index (-4.6 percent) vs US Dollar Index previous week (-5.7 percent)
EuroFX (26.1 percent) vs EuroFX previous week (26.9 percent)
British Pound Sterling (-8.6 percent) vs British Pound Sterling previous week (-18.5 percent)
Japanese Yen (-22.1 percent) vs Japanese Yen previous week (-26.4 percent)
Swiss Franc (-9.2 percent) vs Swiss Franc previous week (-11.3 percent)
Canadian Dollar (-56.0 percent) vs Canadian Dollar previous week (-50.1 percent)
Australian Dollar (24.2 percent) vs Australian Dollar previous week (29.9 percent)
New Zealand Dollar (-27.7 percent) vs New Zealand Dollar previous week (-21.7 percent)
Mexican Peso (-2.0 percent) vs Mexican Peso previous week (-2.6 percent)
Brazilian Real (16.9 percent) vs Brazilian Real previous week (19.1 percent)
Bitcoin (-7.7 percent) vs Bitcoin previous week (-17.4 percent)


Individual COT Forex Markets:

US Dollar Index Futures:
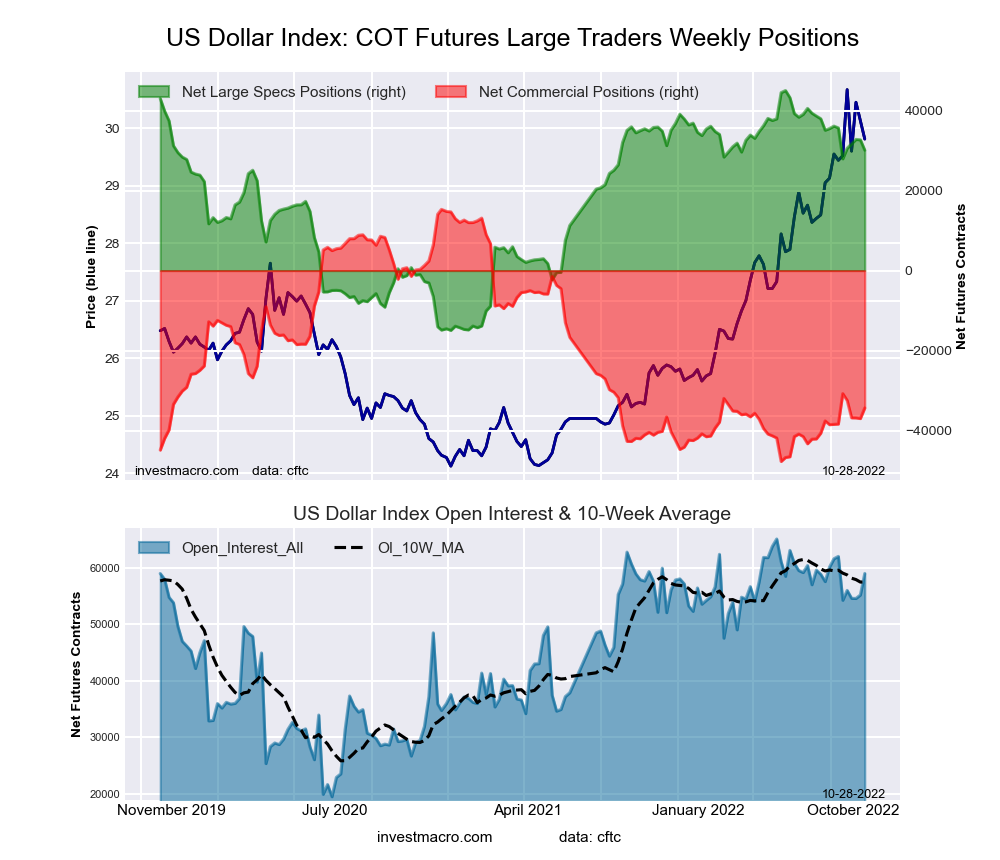
US Dollar Index Forex Futures COT ChartThe US Dollar Index large speculator standing this week totaled a net position of 32,786 contracts in the data reported through Tuesday. This was a weekly lift of 1,089 contracts from the previous week which had a total of 31,697 net contracts.

This week’s current strength score (the trader positioning range over the past three years, measured from 0 to 100) shows the speculators are currently Bullish with a score of 79.6 percent. The commercials are Bearish-Extreme with a score of 17.3 percent and the small traders (not shown in chart) are Bullish with a score of 60.9 percent.

US DOLLAR INDEX StatisticsSPECULATORSCOMMERCIALSSMALL TRADERS
– Percent of Open Interest Longs:82.53.112.0
– Percent of Open Interest Shorts:22.570.64.6
– Net Position:32,786-36,8474,061
– Gross Longs:45,0791,7086,563
– Gross Shorts:12,29338,5552,502
– Long to Short Ratio:3.7 to 10.0 to 12.6 to 1
NET POSITION TREND:
– Strength Index Score (3 Year Range Pct):79.617.360.9
– Strength Index Reading (3 Year Range):BullishBearish-ExtremeBullish
NET POSITION MOVEMENT INDEX:
– 6-Week Change in Strength Index:-4.62.711.4


Euro Currency Futures:

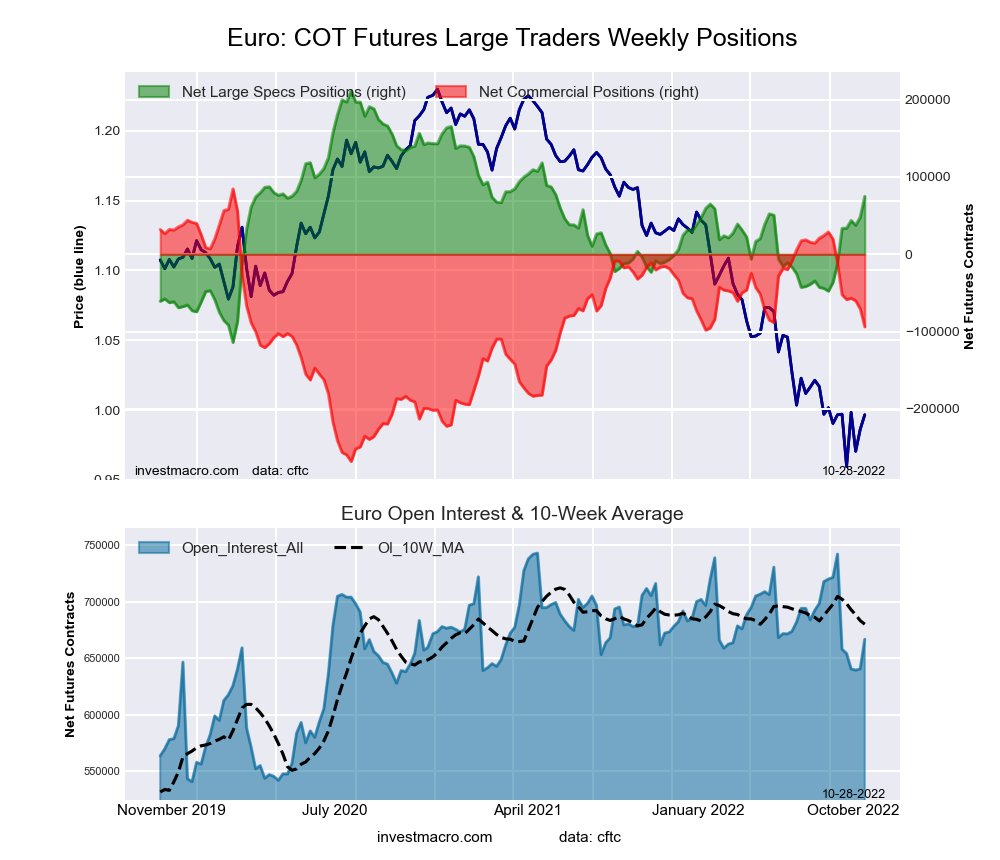
Euro Currency Futures COT ChartThe Euro Currency large speculator standing this week totaled a net position of 37,499 contracts in the data reported through Tuesday. This was a weekly decline of -6,183 contracts from the previous week which had a total of 43,682 net contracts.

This week’s current strength score (the trader positioning range over the past three years, measured from 0 to 100) shows the speculators are currently Bearish with a score of 46.5 percent. The commercials are Bullish with a score of 59.0 percent and the small traders (not shown in chart) are Bearish-Extreme with a score of 15.1 percent.

EURO Currency StatisticsSPECULATORSCOMMERCIALSSMALL TRADERS
– Percent of Open Interest Longs:30.754.612.0
– Percent of Open Interest Shorts:24.864.08.4
– Net Position:37,499-60,16122,662
– Gross Longs:196,136349,09176,656
– Gross Shorts:158,637409,25253,994
– Long to Short Ratio:1.2 to 10.9 to 11.4 to 1
NET POSITION TREND:
– Strength Index Score (3 Year Range Pct):46.559.015.1
– Strength Index Reading (3 Year Range):BearishBullishBearish-Extreme
NET POSITION MOVEMENT INDEX:
– 6-Week Change in Strength Index:26.1-25.36.1


British Pound Sterling Futures:

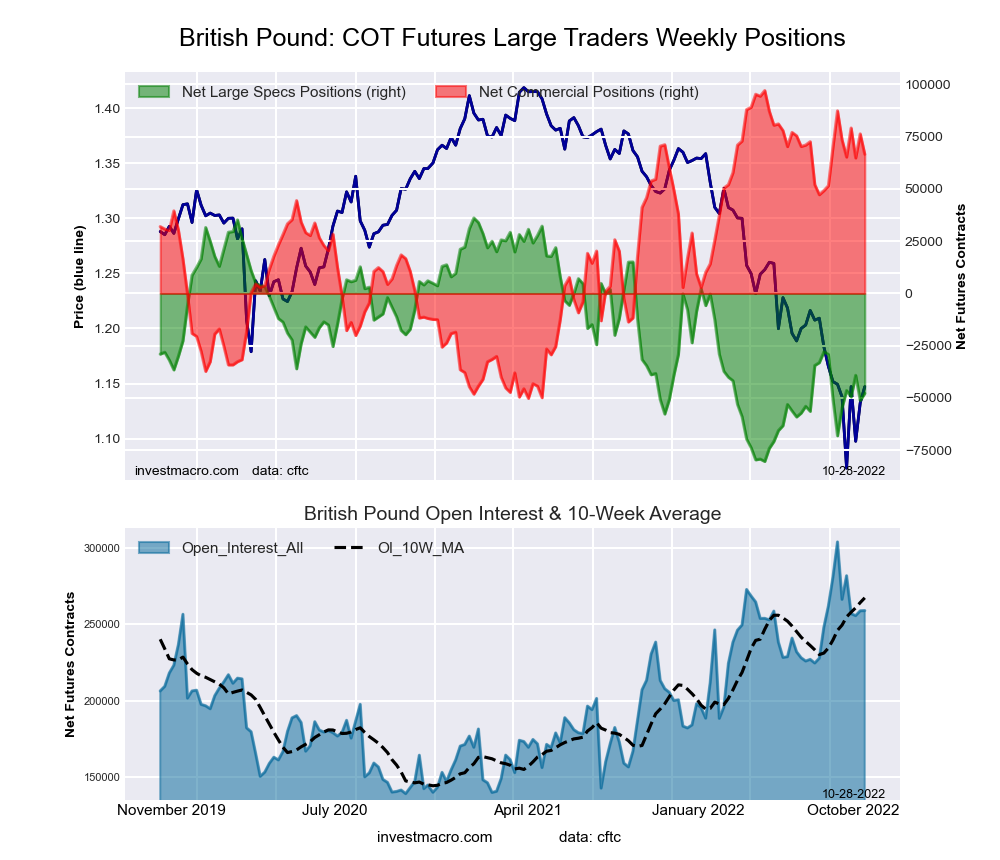
British Pound Sterling Futures COT ChartThe British Pound Sterling large speculator standing this week totaled a net position of -39,170 contracts in the data reported through Tuesday. This was a weekly advance of 10,369 contracts from the previous week which had a total of -49,539 net contracts.

This week’s current strength score (the trader positioning range over the past three years, measured from 0 to 100) shows the speculators are currently Bearish with a score of 35.4 percent. The commercials are Bullish with a score of 78.1 percent and the small traders (not shown in chart) are Bearish-Extreme with a score of 7.7 percent.

BRITISH POUND StatisticsSPECULATORSCOMMERCIALSSMALL TRADERS
– Percent of Open Interest Longs:19.270.37.7
– Percent of Open Interest Shorts:34.544.917.7
– Net Position:-39,17064,804-25,634
– Gross Longs:48,979179,70019,620
– Gross Shorts:88,149114,89645,254
– Long to Short Ratio:0.6 to 11.6 to 10.4 to 1
NET POSITION TREND:
– Strength Index Score (3 Year Range Pct):35.478.17.7
– Strength Index Reading (3 Year Range):BearishBullishBearish-Extreme
NET POSITION MOVEMENT INDEX:
– 6-Week Change in Strength Index:-8.69.0-6.5


Japanese Yen Futures:

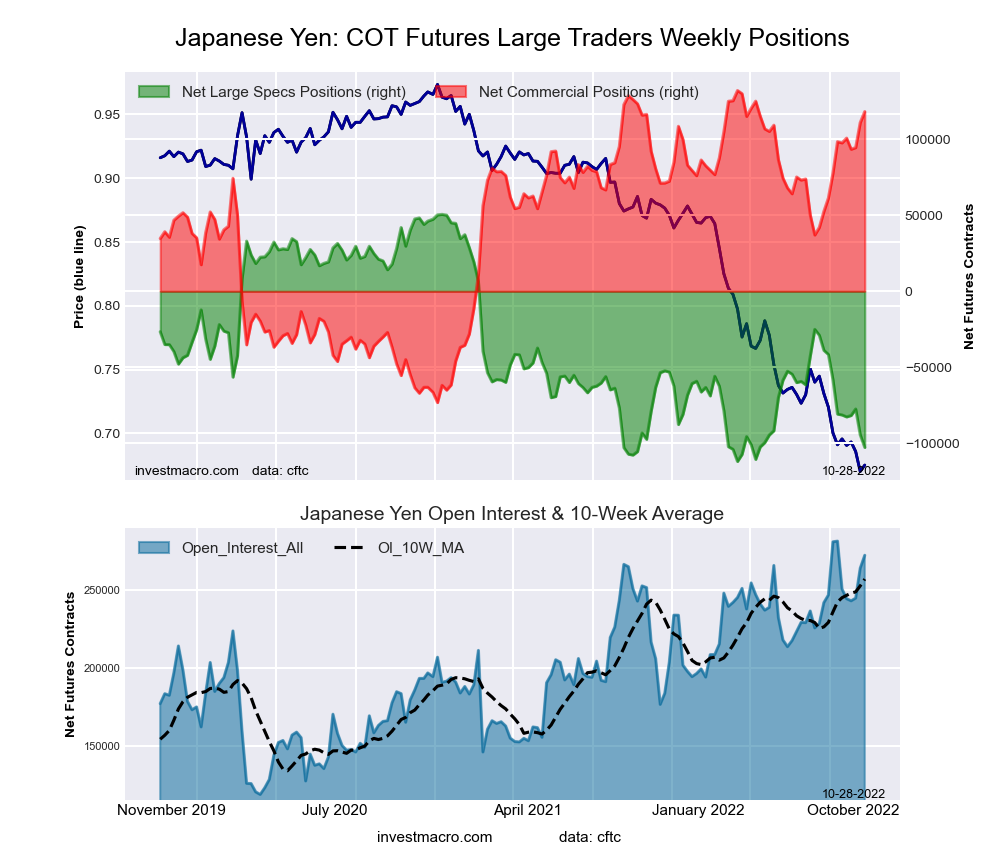
Japanese Yen Forex Futures COT ChartThe Japanese Yen large speculator standing this week totaled a net position of -77,393 contracts in the data reported through Tuesday. This was a weekly advance of 4,230 contracts from the previous week which had a total of -81,623 net contracts.

This week’s current strength score (the trader positioning range over the past three years, measured from 0 to 100) shows the speculators are currently Bearish with a score of 21.2 percent. The commercials are Bullish-Extreme with a score of 81.7 percent and the small traders (not shown in chart) are Bearish-Extreme with a score of 18.8 percent.

JAPANESE YEN StatisticsSPECULATORSCOMMERCIALSSMALL TRADERS
– Percent of Open Interest Longs:12.376.410.0
– Percent of Open Interest Shorts:43.937.817.0
– Net Position:-77,39394,449-17,056
– Gross Longs:30,149187,11924,526
– Gross Shorts:107,54292,67041,582
– Long to Short Ratio:0.3 to 12.0 to 10.6 to 1
NET POSITION TREND:
– Strength Index Score (3 Year Range Pct):21.281.718.8
– Strength Index Reading (3 Year Range):BearishBullish-ExtremeBearish-Extreme
NET POSITION MOVEMENT INDEX:
– 6-Week Change in Strength Index:-22.116.25.5


Swiss Franc Futures:

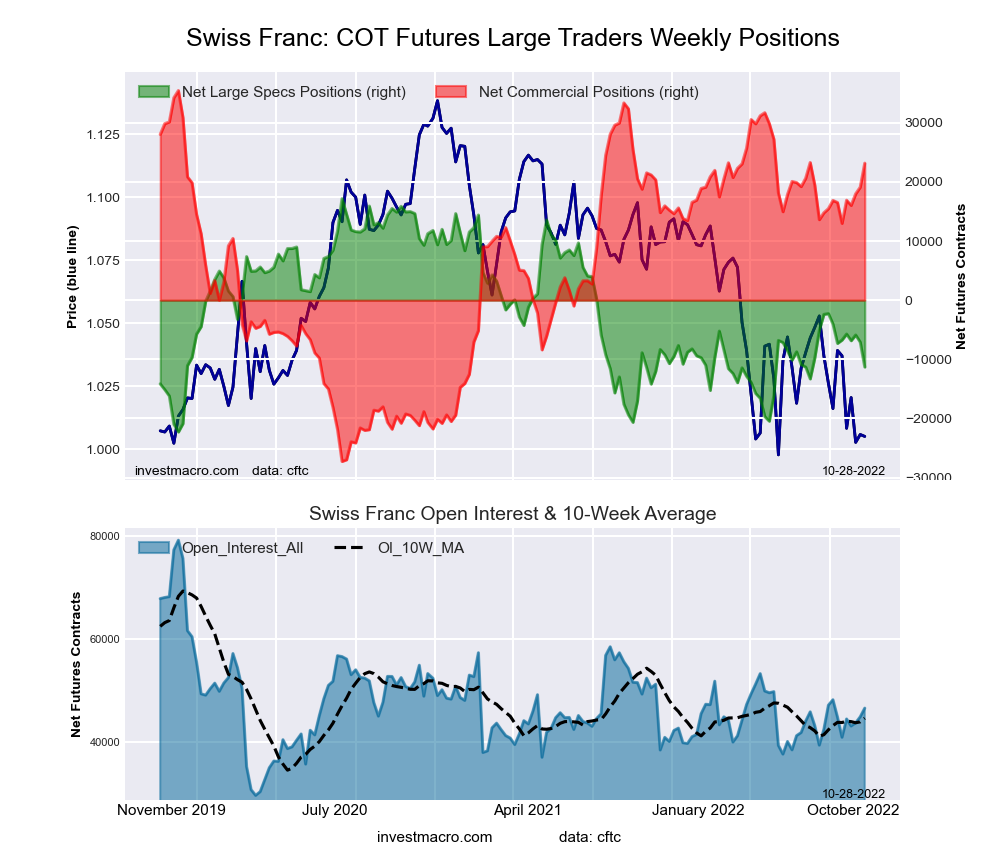
Swiss Franc Forex Futures COT ChartThe Swiss Franc large speculator standing this week totaled a net position of -5,890 contracts in the data reported through Tuesday. This was a weekly boost of 962 contracts from the previous week which had a total of -6,852 net contracts.

This week’s current strength score (the trader positioning range over the past three years, measured from 0 to 100) shows the speculators are currently Bearish with a score of 41.6 percent. The commercials are Bullish with a score of 72.2 percent and the small traders (not shown in chart) are Bearish-Extreme with a score of 16.6 percent.

SWISS FRANC StatisticsSPECULATORSCOMMERCIALSSMALL TRADERS
– Percent of Open Interest Longs:12.667.320.0
– Percent of Open Interest Shorts:26.026.247.7
– Net Position:-5,89017,983-12,093
– Gross Longs:5,50129,4368,770
– Gross Shorts:11,39111,45320,863
– Long to Short Ratio:0.5 to 12.6 to 10.4 to 1
NET POSITION TREND:
– Strength Index Score (3 Year Range Pct):41.672.216.6
– Strength Index Reading (3 Year Range):BearishBullishBearish-Extreme
NET POSITION MOVEMENT INDEX:
– 6-Week Change in Strength Index:-9.24.03.8


Canadian Dollar Futures:

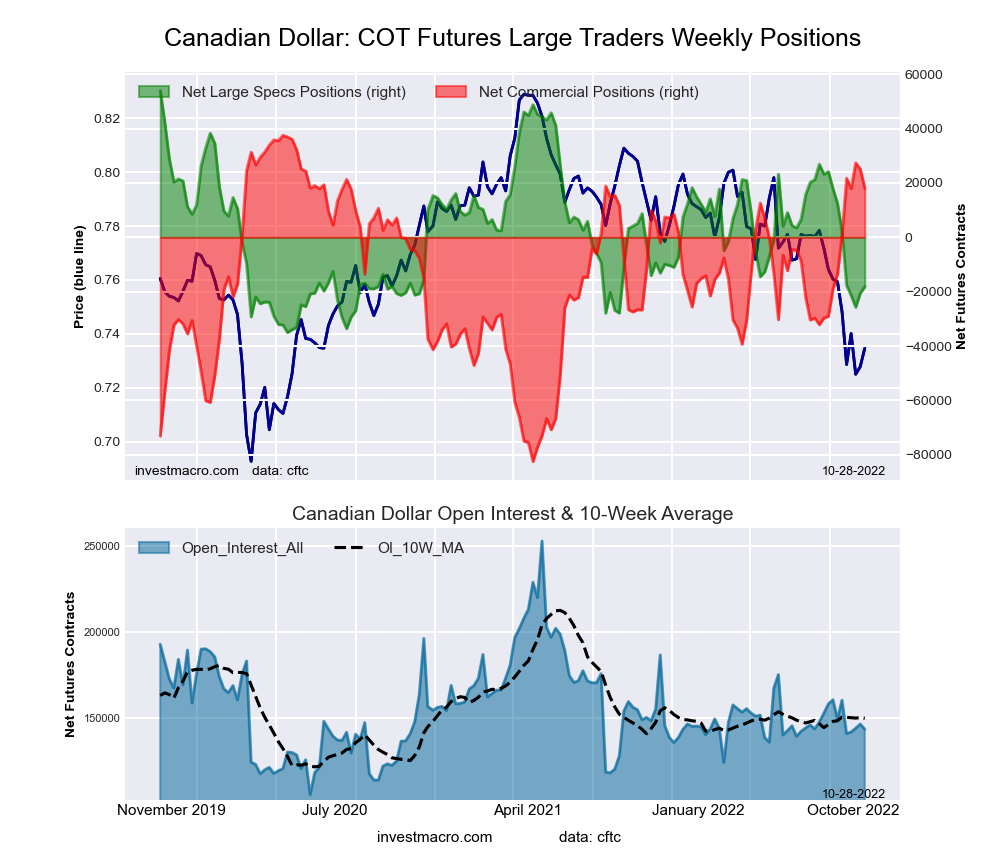
Canadian Dollar Forex Futures COT ChartThe Canadian Dollar large speculator standing this week totaled a net position of -25,672 contracts in the data reported through Tuesday. This was a weekly decline of -4,265 contracts from the previous week which had a total of -21,407 net contracts.

This week’s current strength score (the trader positioning range over the past three years, measured from 0 to 100) shows the speculators are currently Bearish-Extreme with a score of 10.5 percent. The commercials are Bullish-Extreme with a score of 91.5 percent and the small traders (not shown in chart) are Bearish with a score of 26.7 percent.

CANADIAN DOLLAR StatisticsSPECULATORSCOMMERCIALSSMALL TRADERS
– Percent of Open Interest Longs:22.654.121.6
– Percent of Open Interest Shorts:40.435.122.8
– Net Position:-25,67227,366-1,694
– Gross Longs:32,47677,92931,136
– Gross Shorts:58,14850,56332,830
– Long to Short Ratio:0.6 to 11.5 to 10.9 to 1
NET POSITION TREND:
– Strength Index Score (3 Year Range Pct):10.591.526.7
– Strength Index Reading (3 Year Range):Bearish-ExtremeBullish-ExtremeBearish
NET POSITION MOVEMENT INDEX:
– 6-Week Change in Strength Index:-56.047.0-13.2


Australian Dollar Futures:

Australian Dollar Forex Futures COT ChartThe Australian Dollar large speculator standing this week totaled a net position of -31,271 contracts in the data reported through Tuesday. This was a weekly decrease of -3,507 contracts from the previous week which had a total of -27,764 net contracts.

This week’s current strength score (the trader positioning range over the past three years, measured from 0 to 100) shows the speculators are currently Bullish with a score of 55.8 percent. The commercials are Bullish with a score of 50.7 percent and the small traders (not shown in chart) are Bearish with a score of 24.6 percent.

AUSTRALIAN DOLLAR StatisticsSPECULATORSCOMMERCIALSSMALL TRADERS
– Percent of Open Interest Longs:21.262.513.2
– Percent of Open Interest Shorts:43.831.721.4
– Net Position:-31,27142,692-11,421
– Gross Longs:29,32586,47518,245
– Gross Shorts:60,59643,78329,666
– Long to Short Ratio:0.5 to 12.0 to 10.6 to 1
NET POSITION TREND:
– Strength Index Score (3 Year Range Pct):55.850.724.6
– Strength Index Reading (3 Year Range):BullishBullishBearish
NET POSITION MOVEMENT INDEX:
– 6-Week Change in Strength Index:24.2-14.8-15.4


New Zealand Dollar Futures:

New Zealand Dollar Forex Futures COT ChartThe New Zealand Dollar large speculator standing this week totaled a net position of -19,042 contracts in the data reported through Tuesday. This was a weekly decline of -5,064 contracts from the previous week which had a total of -13,978 net contracts.

This week’s current strength score (the trader positioning range over the past three years, measured from 0 to 100) shows the speculators are currently Bearish with a score of 37.1 percent. The commercials are Bullish with a score of 66.9 percent and the small traders (not shown in chart) are Bearish-Extreme with a score of 11.7 percent.

NEW ZEALAND DOLLAR StatisticsSPECULATORSCOMMERCIALSSMALL TRADERS
– Percent of Open Interest Longs:23.570.95.5
– Percent of Open Interest Shorts:61.226.312.4
– Net Position:-19,04222,517-3,475
– Gross Longs:11,89435,8342,771
– Gross Shorts:30,93613,3176,246
– Long to Short Ratio:0.4 to 12.7 to 10.4 to 1
NET POSITION TREND:
– Strength Index Score (3 Year Range Pct):37.166.911.7
– Strength Index Reading (3 Year Range):BearishBullishBearish-Extreme
NET POSITION MOVEMENT INDEX:
– 6-Week Change in Strength Index:-27.725.3-0.8


Mexican Peso Futures:

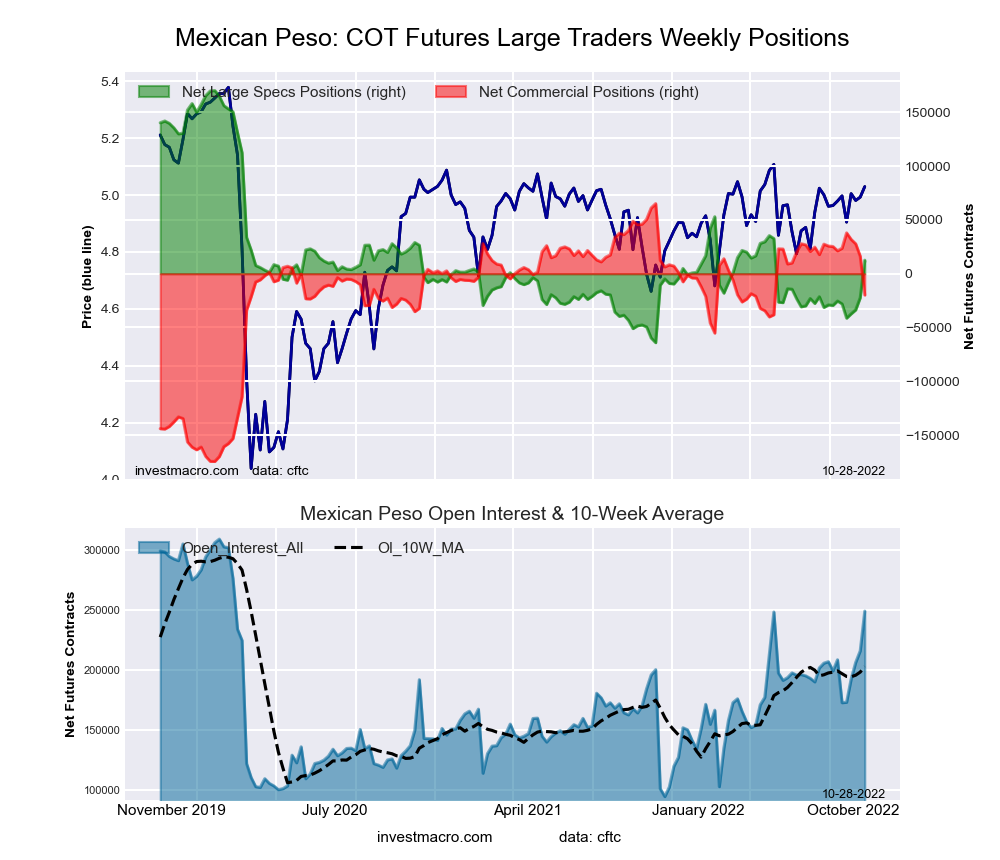
Mexican Peso Futures COT ChartThe Mexican Peso large speculator standing this week totaled a net position of -33,654 contracts in the data reported through Tuesday. This was a weekly gain of 3,667 contracts from the previous week which had a total of -37,321 net contracts.

This week’s current strength score (the trader positioning range over the past three years, measured from 0 to 100) shows the speculators are currently Bearish-Extreme with a score of 13.0 percent. The commercials are Bullish-Extreme with a score of 84.4 percent and the small traders (not shown in chart) are Bullish with a score of 67.7 percent.

MEXICAN PESO StatisticsSPECULATORSCOMMERCIALSSMALL TRADERS
– Percent of Open Interest Longs:58.337.54.0
– Percent of Open Interest Shorts:74.624.01.2
– Net Position:-33,65427,8395,815
– Gross Longs:120,23977,3938,294
– Gross Shorts:153,89349,5542,479
– Long to Short Ratio:0.8 to 11.6 to 13.3 to 1
NET POSITION TREND:
– Strength Index Score (3 Year Range Pct):13.084.467.7
– Strength Index Reading (3 Year Range):Bearish-ExtremeBullish-ExtremeBullish
NET POSITION MOVEMENT INDEX:
– 6-Week Change in Strength Index:-2.00.910.8


Brazilian Real Futures:

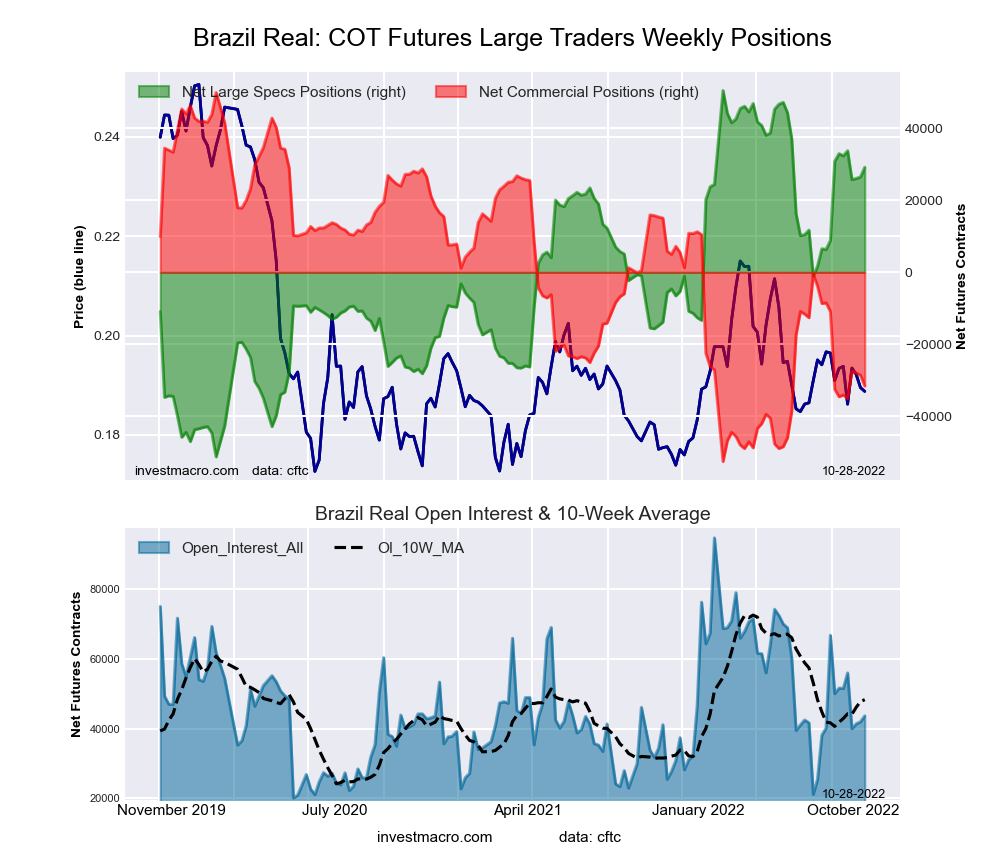
Brazil Real Futures COT ChartThe Brazilian Real large speculator standing this week totaled a net position of 26,075 contracts in the data reported through Tuesday. This was a weekly increase of 296 contracts from the previous week which had a total of 25,779 net contracts.

This week’s current strength score (the trader positioning range over the past three years, measured from 0 to 100) shows the speculators are currently Bullish with a score of 76.0 percent. The commercials are Bearish with a score of 24.0 percent and the small traders (not shown in chart) are Bullish-Extreme with a score of 86.9 percent.

BRAZIL REAL StatisticsSPECULATORSCOMMERCIALSSMALL TRADERS
– Percent of Open Interest Longs:69.721.07.7
– Percent of Open Interest Shorts:6.788.63.1
– Net Position:26,075-27,9661,891
– Gross Longs:28,8298,6973,182
– Gross Shorts:2,75436,6631,291
– Long to Short Ratio:10.5 to 10.2 to 12.5 to 1
NET POSITION TREND:
– Strength Index Score (3 Year Range Pct):76.024.086.9
– Strength Index Reading (3 Year Range):BullishBearishBullish-Extreme
NET POSITION MOVEMENT INDEX:
– 6-Week Change in Strength Index:16.9-16.6-2.0


Bitcoin Futures:

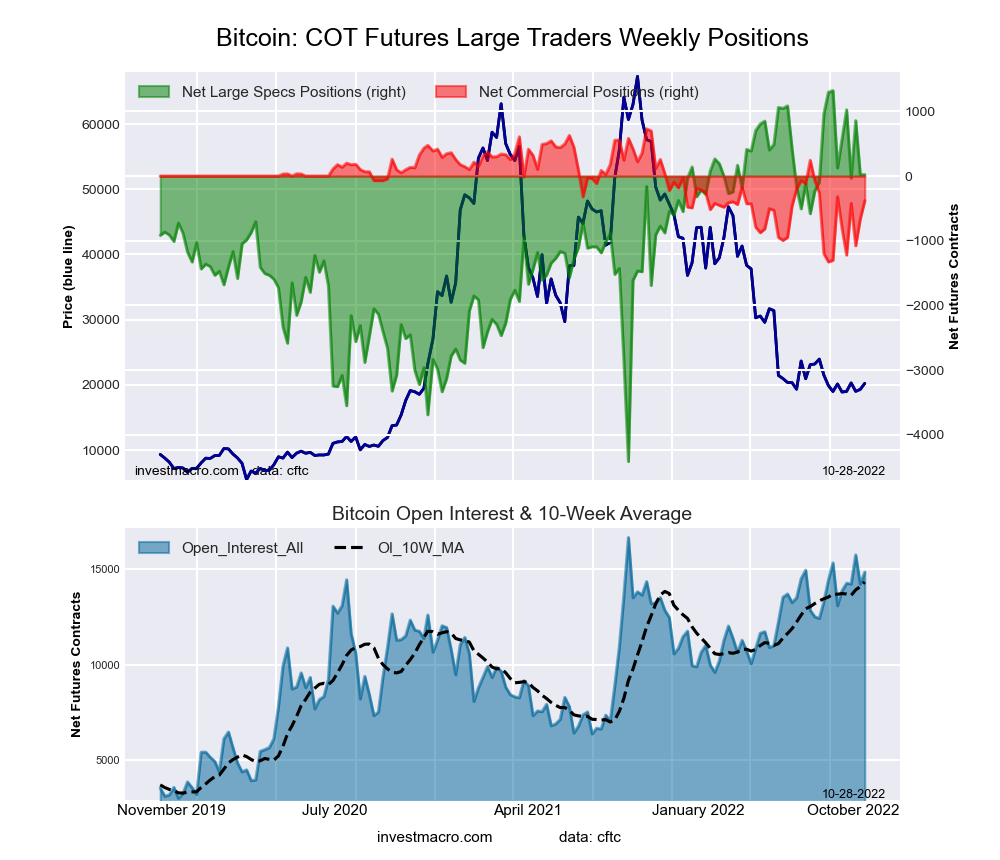
Bitcoin Crypto Futures COT ChartThe Bitcoin large speculator standing this week totaled a net position of 857 contracts in the data reported through Tuesday. This was a weekly increase of 889 contracts from the previous week which had a total of -32 net contracts.

This week’s current strength score (the trader positioning range over the past three years, measured from 0 to 100) shows the speculators are currently Bullish-Extreme with a score of 91.9 percent. The commercials are Bearish-Extreme with a score of 12.2 percent and the small traders (not shown in chart) are Bearish-Extreme with a score of 17.9 percent.

BITCOIN StatisticsSPECULATORSCOMMERCIALSSMALL TRADERS
– Percent of Open Interest Longs:80.60.26.4
– Percent of Open Interest Shorts:75.27.05.0
– Net Position:857-1,077220
– Gross Longs:12,704331,007
– Gross Shorts:11,8471,110787
– Long to Short Ratio:1.1 to 10.0 to 11.3 to 1
NET POSITION TREND:
– Strength Index Score (3 Year Range Pct):91.912.217.9
– Strength Index Reading (3 Year Range):Bullish-ExtremeBearish-ExtremeBearish-Extreme
NET POSITION MOVEMENT INDEX:
– 6-Week Change in Strength Index:-7.712.24.3


Article By InvestMacroReceive our weekly COT Newsletter

*COT Report: The COT data, released weekly to the public each Friday, is updated through the most recent Tuesday (data is 3 days old) and shows a quick view of how large speculators or non-commercials (for-profit traders) were positioned in the futures markets.

The CFTC categorizes trader positions according to commercial hedgers (traders who use futures contracts for hedging as part of the business), non-commercials (large traders who speculate to realize trading profits) and nonreportable traders (usually small traders/speculators) as well as their open interest (contracts open in the market at time of reporting). See CFTC criteria here.

Weekly Energy Speculator Changes led by WTI Crude Oil and Heating Oil

By InvestMacro

Weekly Energy Speculator Changes led by WTI Crude Oil and Heating Oil

Here are the latest charts and statistics for the Commitment of Traders (COT) data published by the Commodities Futures Trading Commission (CFTC).

The latest COT data is updated through Tuesday October 11th and shows a quick view of how large traders (for-profit speculators and commercial hedgers) were positioned in the futures markets.

Weekly Speculator Changes led by WTI Crude Oil and Heating Oil

Weekly Energy Speculator Changes led by WTI Crude Oil and Heating Oil

COT energy market speculator bets were mixed this week as three out of the six energy markets we cover had higher positioning this week while the other three markets had lower contracts.

Leading the gains for energy markets was WTI Crude Oil (17,221 contracts) with Heating Oil (3,668 contracts) and Bloomberg Commodity Index (176 contracts) also showing positive weeks.

The energy markets leading the declines in speculator bets this week were Gasoline (-4,974 contracts) with Natural Gas (-3,007 contracts) and Brent Crude Oil (-2,068 contracts) also registering lower bets on the week.


Data Snapshot of Commodity Market Traders | Columns Legend
Oct-11-2022OIOI-IndexSpec-NetSpec-IndexCom-NetCOM-IndexSmalls-NetSmalls-Index
WTI Crude1,499,4983259,22013-283,6268824,40641
Gold431,395094,42014-103,728879,3083
Silver125,62307,38922-15,603808,21410
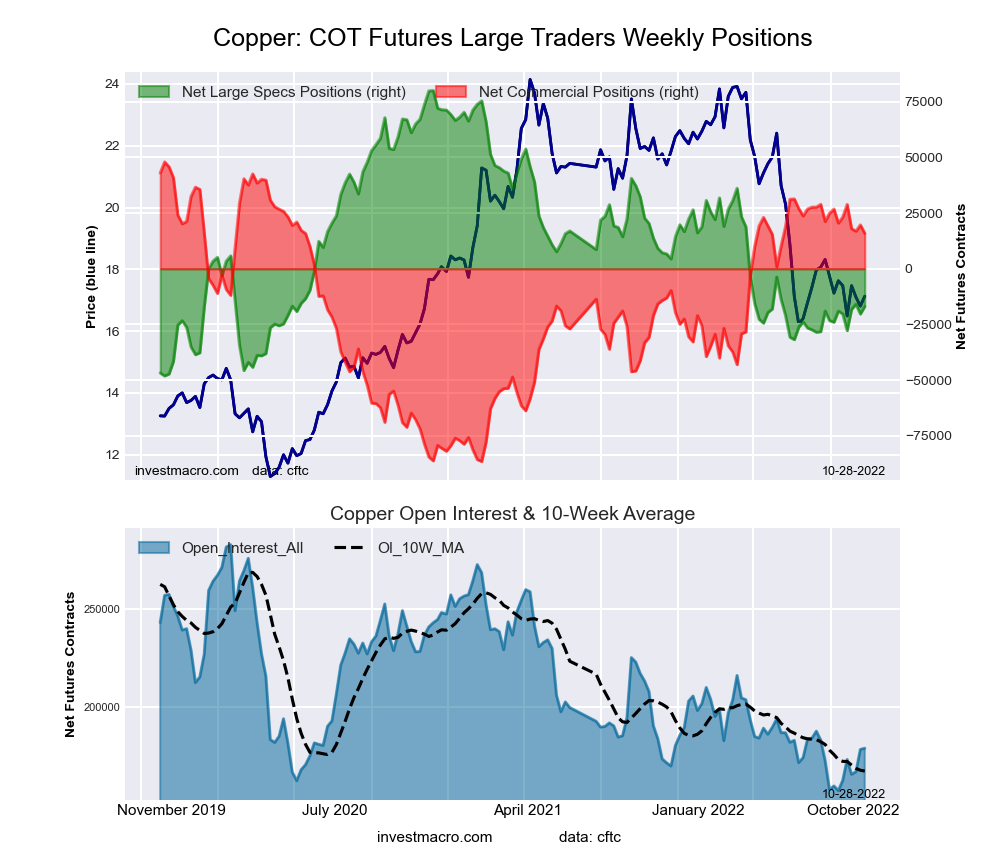
Copper167,4498-15,8992416,90380-1,00419
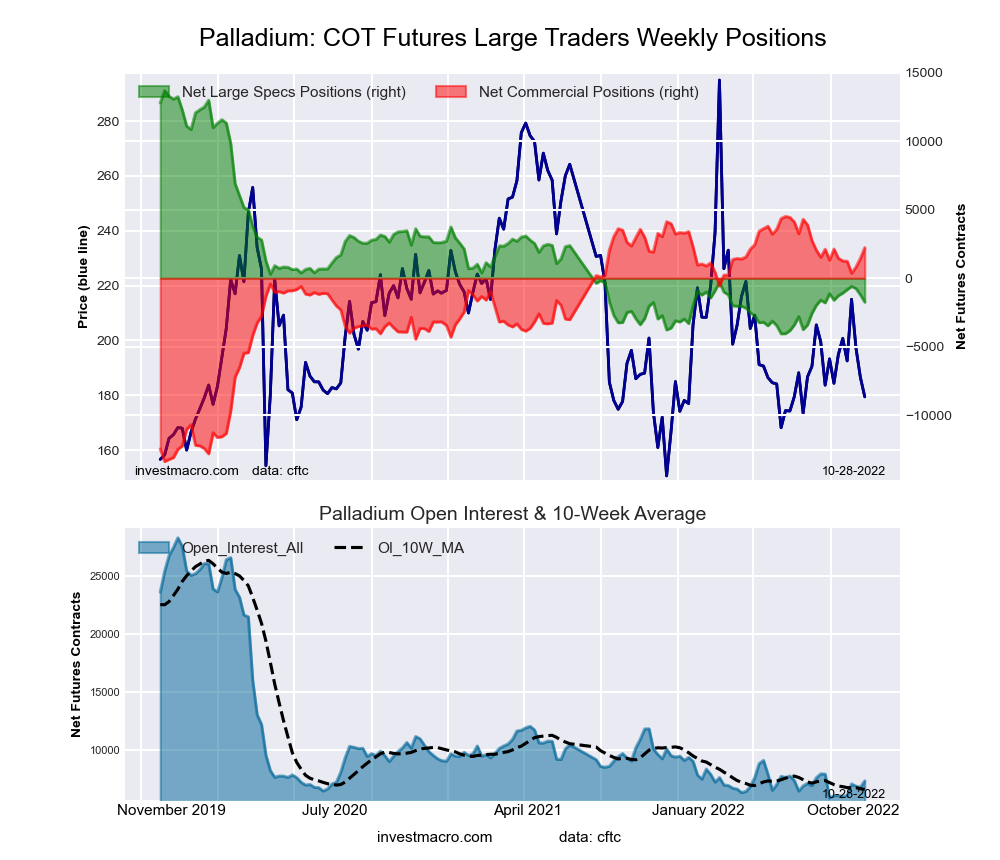
Palladium6,8905-7541981079-5641
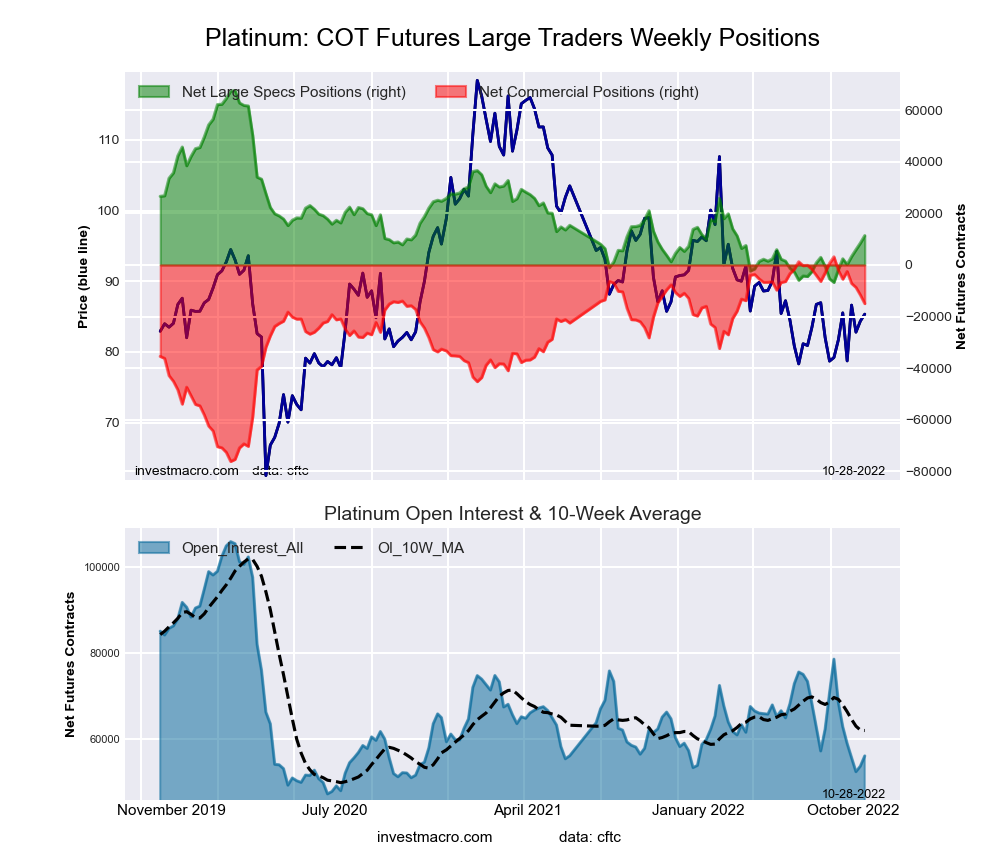
Platinum52,43595,92817-8,690852,7625
Natural Gas974,4685-162,10330130,0997232,00456
Brent163,11311-41,8884138,882583,00650
Heating Oil275,2622519,42371-38,4483019,02564
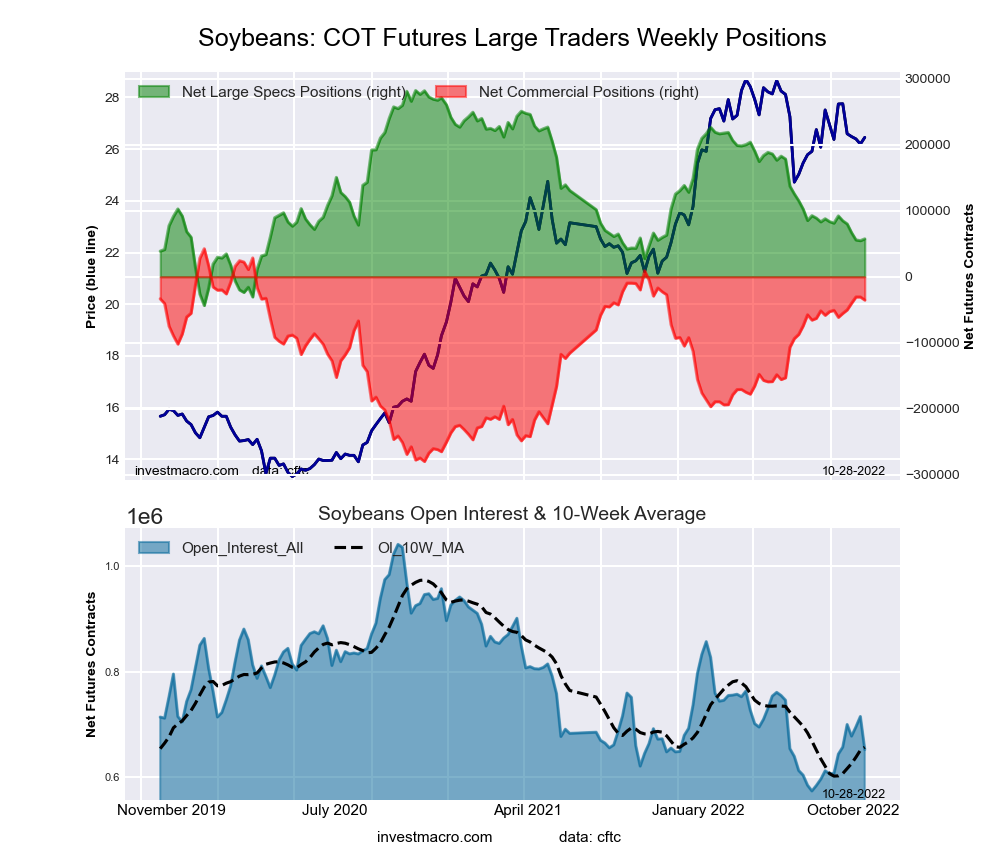
Soybeans694,9602655,76930-30,61477-25,15529
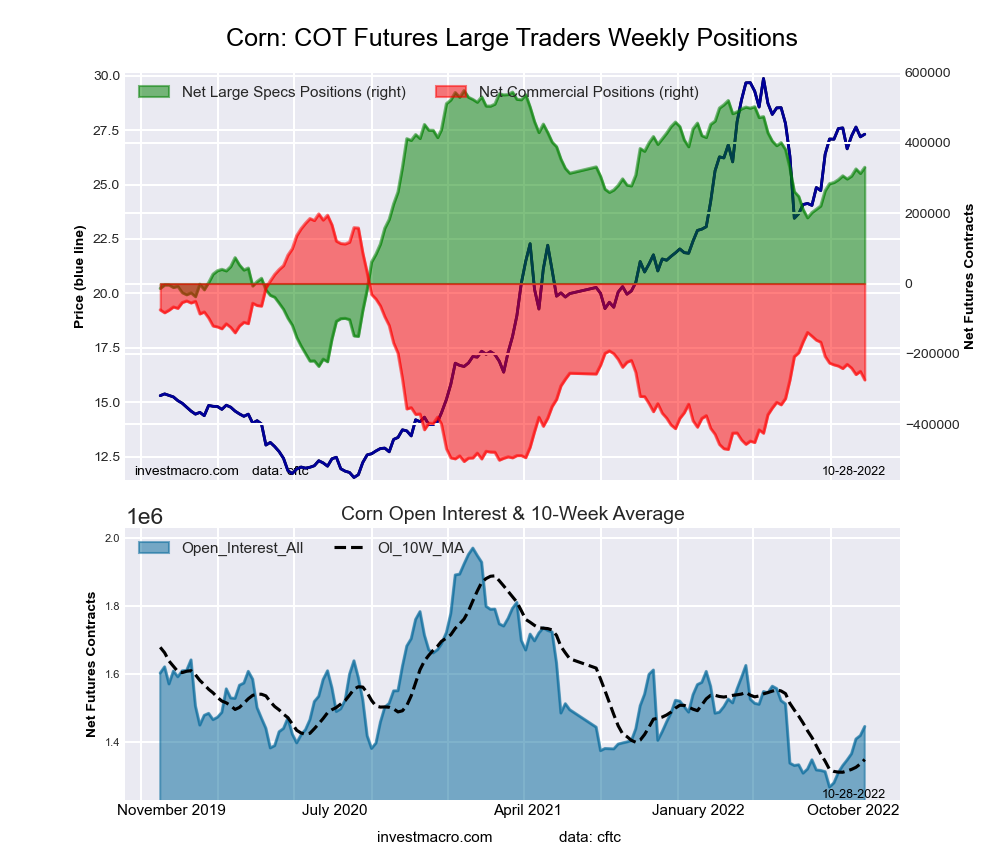
Corn1,408,93920325,12172-258,22535-66,8965
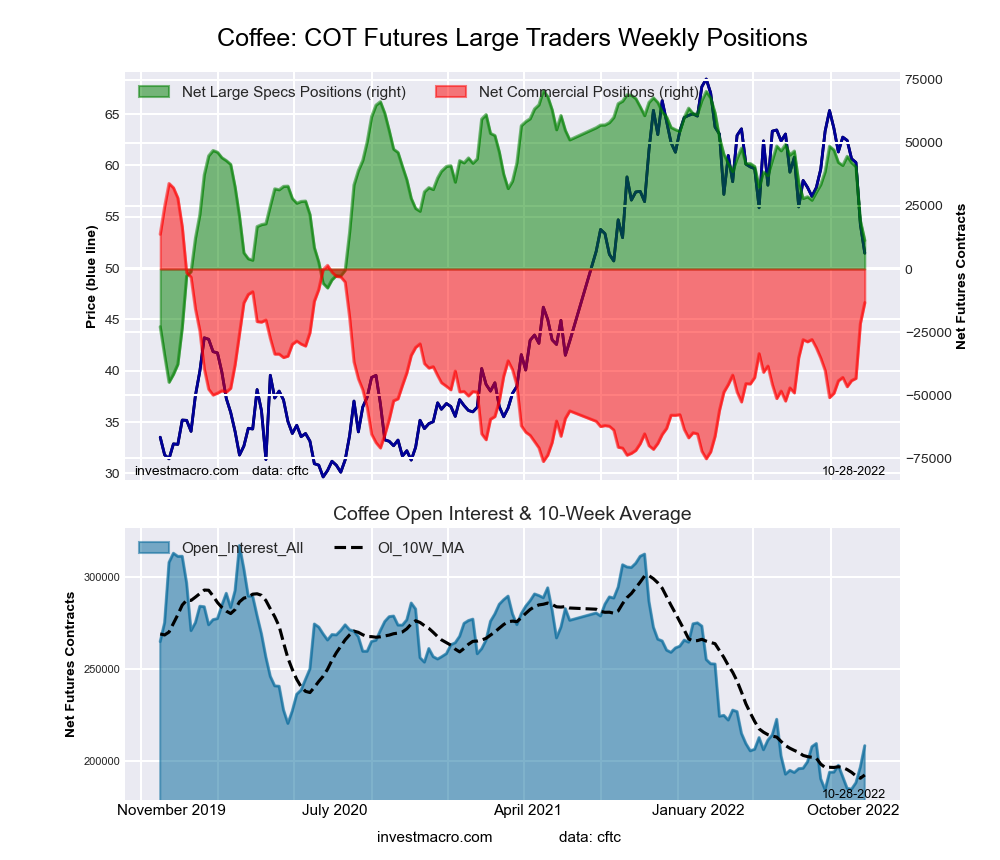
Coffee188,198340,53473-43,359302,82529
Sugar687,2090101,11557-135,1454334,03050
Wheat307,9019-1,990168,70572-6,71576


Strength Scores led by Bloomberg Commodity Index & Heating Oil

Strength Scores (a normalized measure of Speculator positions over a 3-Year range, from 0 to 100 where above 80 is extreme bullish and below 20 is extreme bearish) show that the Bloomberg Commodity Index (78.3 percent) and Heating Oil (71.0 percent) lead the energy markets with scores above 50 percent.

On the downside, WTI Crude Oil (12.8 percent) and Gasoline (15.3 percent) come in at the lowest strength level currently and both are in extreme bearish levels (below 20 percent).

Strength Statistics:
WTI Crude Oil (12.8 percent) vs WTI Crude Oil previous week (8.3 percent)
Brent Crude Oil (40.9 percent) vs Brent Crude Oil previous week (44.4 percent)
Natural Gas (29.9 percent) vs Natural Gas previous week (30.8 percent)
Gasoline (15.3 percent) vs Gasoline previous week (20.3 percent)
Heating Oil (71.0 percent) vs Heating Oil previous week (65.6 percent)
Bloomberg Commodity Index (78.3 percent) vs Bloomberg Commodity Index previous week (77.6 percent)

Bloomberg Commodity Index leads the 6-Week Strength Trends

Strength Score Trends (or move index, calculates the 6-week changes in strength scores) show that the Bloomberg Commodity Index (18.9 percent) leads the past six weeks trends for energy this week. WTI Crude Oil (7.9 percent) is the only other positive mover in the latest trends data.

Natural Gas (-10.0 percent) leads the downside trend scores currently while the next markets with lower trend scores were Heating Oil (-8.5 percent) followed by Gasoline (-6.4 percent).

Strength Trend Statistics:
WTI Crude Oil (7.9 percent) vs WTI Crude Oil previous week (-1.1 percent)
Brent Crude Oil (-3.2 percent) vs Brent Crude Oil previous week (-5.7 percent)
Natural Gas (-10.0 percent) vs Natural Gas previous week (-9.2 percent)
Gasoline (-6.4 percent) vs Gasoline previous week (-4.5 percent)
Heating Oil (-8.5 percent) vs Heating Oil previous week (-8.9 percent)
Bloomberg Commodity Index (18.9 percent) vs Bloomberg Commodity Index previous week (18.6 percent)


Individual COT Energy Market Charts:

WTI Crude Oil Futures:

WTI Crude Oil Futures COT ChartThe WTI Crude Oil Futures large speculator standing this week resulted in a net position of 259,220 contracts in the data reported through Tuesday. This was a weekly rise of 17,221 contracts from the previous week which had a total of 241,999 net contracts.

This week’s current strength score (the trader positioning range over the past three years, measured from 0 to 100) shows the speculators are currently Bearish-Extreme with a score of 12.8 percent. The commercials are Bullish-Extreme with a score of 87.7 percent and the small traders (not shown in chart) are Bearish with a score of 40.7 percent.

WTI Crude Oil Futures StatisticsSPECULATORSCOMMERCIALSSMALL TRADERS
– Percent of Open Interest Longs:23.039.05.1
– Percent of Open Interest Shorts:5.757.93.5
– Net Position:259,220-283,62624,406
– Gross Longs:345,258584,60976,359
– Gross Shorts:86,038868,23551,953
– Long to Short Ratio:4.0 to 10.7 to 11.5 to 1
NET POSITION TREND:
– Strength Index Score (3 Year Range Pct):12.887.740.7
– Strength Index Reading (3 Year Range):Bearish-ExtremeBullish-ExtremeBearish
NET POSITION MOVEMENT INDEX:
– 6-Week Change in Strength Index:7.9-7.4-4.4


Brent Crude Oil Futures:

Brent Last Day Crude Oil Futures COT ChartThe Brent Crude Oil Futures large speculator standing this week resulted in a net position of -41,888 contracts in the data reported through Tuesday. This was a weekly decline of -2,068 contracts from the previous week which had a total of -39,820 net contracts.

This week’s current strength score (the trader positioning range over the past three years, measured from 0 to 100) shows the speculators are currently Bearish with a score of 40.9 percent. The commercials are Bullish with a score of 57.9 percent and the small traders (not shown in chart) are Bearish with a score of 49.9 percent.

Brent Crude Oil Futures StatisticsSPECULATORSCOMMERCIALSSMALL TRADERS
– Percent of Open Interest Longs:17.551.44.9
– Percent of Open Interest Shorts:43.227.63.1
– Net Position:-41,88838,8823,006
– Gross Longs:28,60683,8367,999
– Gross Shorts:70,49444,9544,993
– Long to Short Ratio:0.4 to 11.9 to 11.6 to 1
NET POSITION TREND:
– Strength Index Score (3 Year Range Pct):40.957.949.9
– Strength Index Reading (3 Year Range):BearishBullishBearish
NET POSITION MOVEMENT INDEX:
– 6-Week Change in Strength Index:-3.23.8-5.7


Natural Gas Futures:

Natural Gas Futures COT ChartThe Natural Gas Futures large speculator standing this week resulted in a net position of -162,103 contracts in the data reported through Tuesday. This was a weekly reduction of -3,007 contracts from the previous week which had a total of -159,096 net contracts.

This week’s current strength score (the trader positioning range over the past three years, measured from 0 to 100) shows the speculators are currently Bearish with a score of 29.9 percent. The commercials are Bullish with a score of 71.9 percent and the small traders (not shown in chart) are Bullish with a score of 56.0 percent.

Natural Gas Futures StatisticsSPECULATORSCOMMERCIALSSMALL TRADERS
– Percent of Open Interest Longs:14.544.46.8
– Percent of Open Interest Shorts:31.131.03.5
– Net Position:-162,103130,09932,004
– Gross Longs:140,917432,66565,929
– Gross Shorts:303,020302,56633,925
– Long to Short Ratio:0.5 to 11.4 to 11.9 to 1
NET POSITION TREND:
– Strength Index Score (3 Year Range Pct):29.971.956.0
– Strength Index Reading (3 Year Range):BearishBullishBullish
NET POSITION MOVEMENT INDEX:
– 6-Week Change in Strength Index:-10.011.9-10.1


Gasoline Blendstock Futures:

RBOB Gasoline Energy Futures COT ChartThe Gasoline Blendstock Futures large speculator standing this week resulted in a net position of 43,282 contracts in the data reported through Tuesday. This was a weekly decrease of -4,974 contracts from the previous week which had a total of 48,256 net contracts.

This week’s current strength score (the trader positioning range over the past three years, measured from 0 to 100) shows the speculators are currently Bearish-Extreme with a score of 15.3 percent. The commercials are Bullish-Extreme with a score of 84.7 percent and the small traders (not shown in chart) are Bearish with a score of 48.5 percent.

Nasdaq Mini Futures StatisticsSPECULATORSCOMMERCIALSSMALL TRADERS
– Percent of Open Interest Longs:28.653.07.7
– Percent of Open Interest Shorts:11.871.95.6
– Net Position:43,282-48,6435,361
– Gross Longs:73,663136,45719,739
– Gross Shorts:30,381185,10014,378
– Long to Short Ratio:2.4 to 10.7 to 11.4 to 1
NET POSITION TREND:
– Strength Index Score (3 Year Range Pct):15.384.748.5
– Strength Index Reading (3 Year Range):Bearish-ExtremeBullish-ExtremeBearish
NET POSITION MOVEMENT INDEX:
– 6-Week Change in Strength Index:-6.44.610.8


#2 Heating Oil NY-Harbor Futures:

NY Harbor Heating Oil Energy Futures COT ChartThe #2 Heating Oil NY-Harbor Futures large speculator standing this week resulted in a net position of 19,423 contracts in the data reported through Tuesday. This was a weekly rise of 3,668 contracts from the previous week which had a total of 15,755 net contracts.

This week’s current strength score (the trader positioning range over the past three years, measured from 0 to 100) shows the speculators are currently Bullish with a score of 71.0 percent. The commercials are Bearish with a score of 30.3 percent and the small traders (not shown in chart) are Bullish with a score of 64.3 percent.

Heating Oil Futures StatisticsSPECULATORSCOMMERCIALSSMALL TRADERS
– Percent of Open Interest Longs:15.148.416.5
– Percent of Open Interest Shorts:8.162.49.6
– Net Position:19,423-38,44819,025
– Gross Longs:41,620133,30145,373
– Gross Shorts:22,197171,74926,348
– Long to Short Ratio:1.9 to 10.8 to 11.7 to 1
NET POSITION TREND:
– Strength Index Score (3 Year Range Pct):71.030.364.3
– Strength Index Reading (3 Year Range):BullishBearishBullish
NET POSITION MOVEMENT INDEX:
– 6-Week Change in Strength Index:-8.55.71.6


Bloomberg Commodity Index Futures:

Bloomberg Commodity Index Futures COT ChartThe Bloomberg Commodity Index Futures large speculator standing this week resulted in a net position of -7,623 contracts in the data reported through Tuesday. This was a weekly gain of 176 contracts from the previous week which had a total of -7,799 net contracts.

This week’s current strength score (the trader positioning range over the past three years, measured from 0 to 100) shows the speculators are currently Bullish with a score of 78.3 percent. The commercials are Bearish with a score of 22.0 percent and the small traders (not shown in chart) are Bearish-Extreme with a score of 15.5 percent.

Bloomberg Index Futures StatisticsSPECULATORSCOMMERCIALSSMALL TRADERS
– Percent of Open Interest Longs:19.676.40.4
– Percent of Open Interest Shorts:32.563.80.2
– Net Position:-7,6237,468155
– Gross Longs:11,55945,105253
– Gross Shorts:19,18237,63798
– Long to Short Ratio:0.6 to 11.2 to 12.6 to 1
NET POSITION TREND:
– Strength Index Score (3 Year Range Pct):78.322.015.5
– Strength Index Reading (3 Year Range):BullishBearishBearish-Extreme
NET POSITION MOVEMENT INDEX:
– 6-Week Change in Strength Index:18.9-18.4-6.8


Article By InvestMacroReceive our weekly COT Newsletter

*COT Report: The COT data, released weekly to the public each Friday, is updated through the most recent Tuesday (data is 3 days old) and shows a quick view of how large speculators or non-commercials (for-profit traders) were positioned in the futures markets.

The CFTC categorizes trader positions according to commercial hedgers (traders who use futures contracts for hedging as part of the business), non-commercials (large traders who speculate to realize trading profits) and nonreportable traders (usually small traders/speculators) as well as their open interest (contracts open in the market at time of reporting). See CFTC criteria here.
Bonds Speculators add to 2-Year Treasury Bonds bearish bets

By InvestMacro

Here are the latest charts and statistics for the Commitment of Traders (COT) reports data published by the Commodities Futures Trading Commission (CFTC).

The latest COT data is updated through Tuesday October 11th and shows a quick view of how large traders (for-profit speculators and commercial hedgers) were positioned in the futures markets.

10-Year Bond & Ultra US Bond lead Weekly Speculator Changes

The COT bond market speculator bets were higher this week as five out of the eight bond markets we cover had higher positioning this week while two markets had lower contracts.

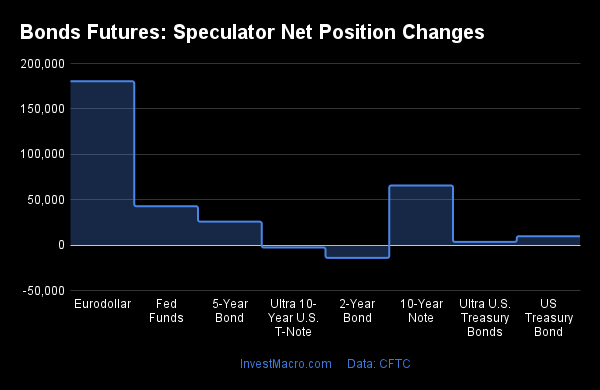
Leading the weekly gains for the bond market was the 10-Year Bond (26,709 contracts) with the Ultra US Bond (26,591 contracts), the Long US Bond (19,731 contracts), the Fed Funds (7,692 contracts) and the Ultra 10-Year (6,320 contracts) also showing positive weeks.

The bond market leading the weekly declines in speculator bets this week was the Eurodollar (-55,468 contracts) with the 2-Year Bond (-47,552 contracts) and the 5-Year Bond (-888 contracts) also registering lower bets on the week.

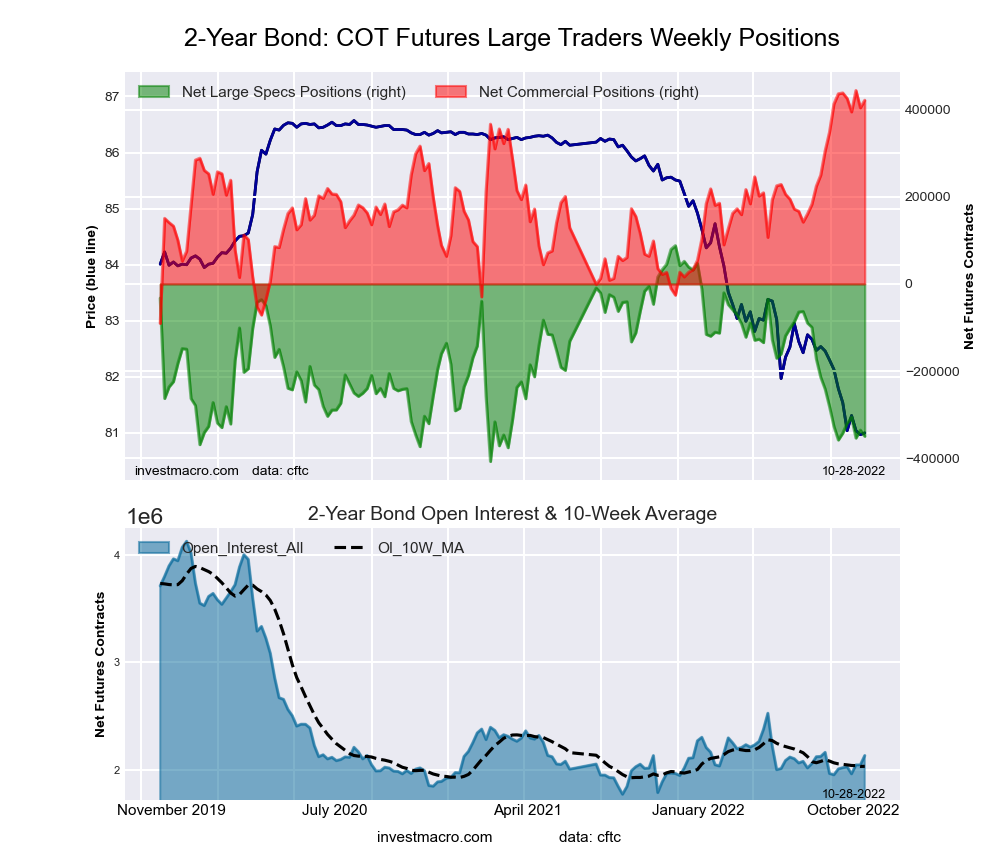
Highlighting the COT bonds data this week is the bearishness of the 2-Year Bond market. Speculators added over -47,000 contracts this week to the overall bearish position. The decline in the 2-Year this week follows three straight weeks of lessening bearish levels. This bearish reboot pushed the overall bearish standing up to -353,686 total net contracts which is the most in five weeks and the second highest in past 79 weeks. The 2-Year is feeling the brunt of the US Federal Reserve’s interest rate hiking campaign (to subdue inflation) and will likely not get a reprieve any time soon with inflation coming in higher again this week. The 2-Year yield (as bond prices fall, yields rise) ended the week at just under 4.50 percent and significantly higher from a 2-Year yield of just 0.38 percent on October 15th of 2021, exactly one year ago today.


Data Snapshot of Bond Market Traders | Columns Legend
Oct-11-2022OIOI-IndexSpec-NetSpec-IndexCom-NetCOM-IndexSmalls-NetSmalls-Index
Eurodollar8,129,6820-2,143,216142,373,77583-230,55954
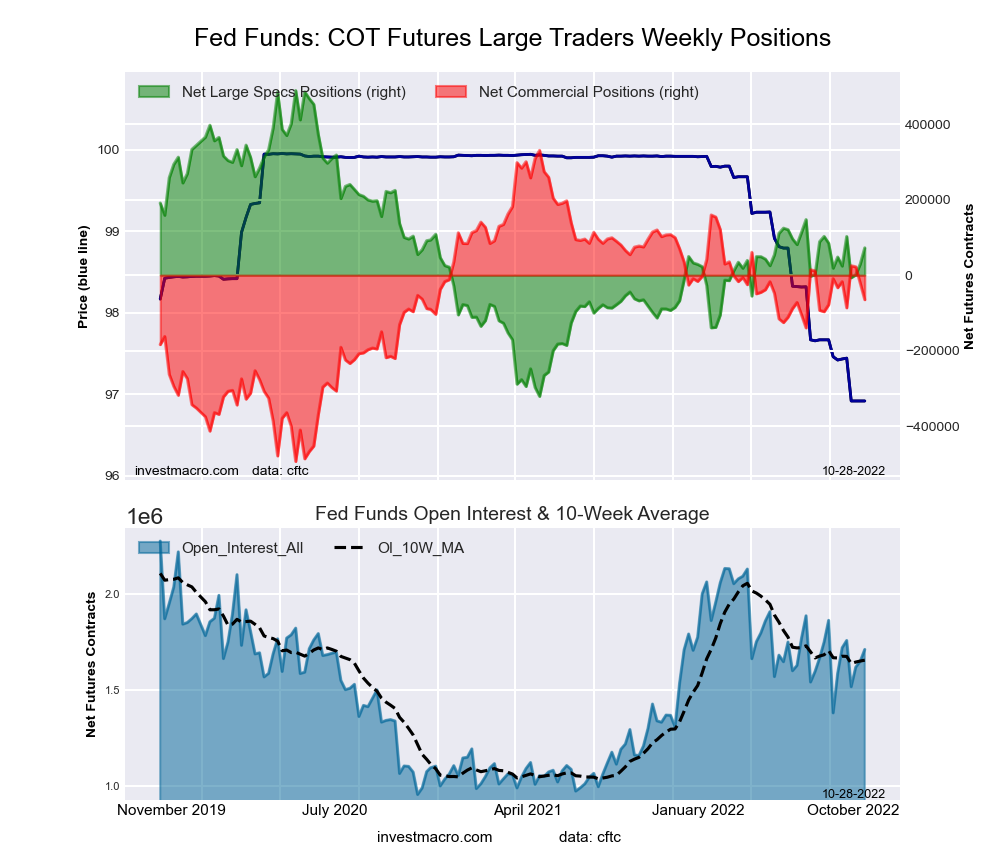
FedFunds1,617,720508884022,18363-23,0711
2-Year2,045,92312-353,68611443,750100-90,06412
Long T-Bond1,211,22945-83,7925756,1573127,63575
10-Year3,873,98656-340,16321392,17168-52,00868
5-Year4,040,58354-483,92012601,68587-117,76549


US Treasury Bond leads the Strength Scores

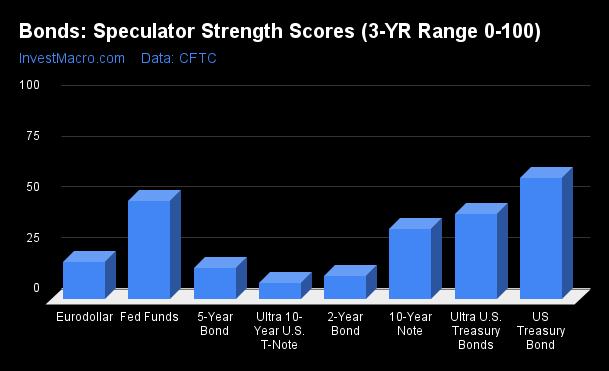
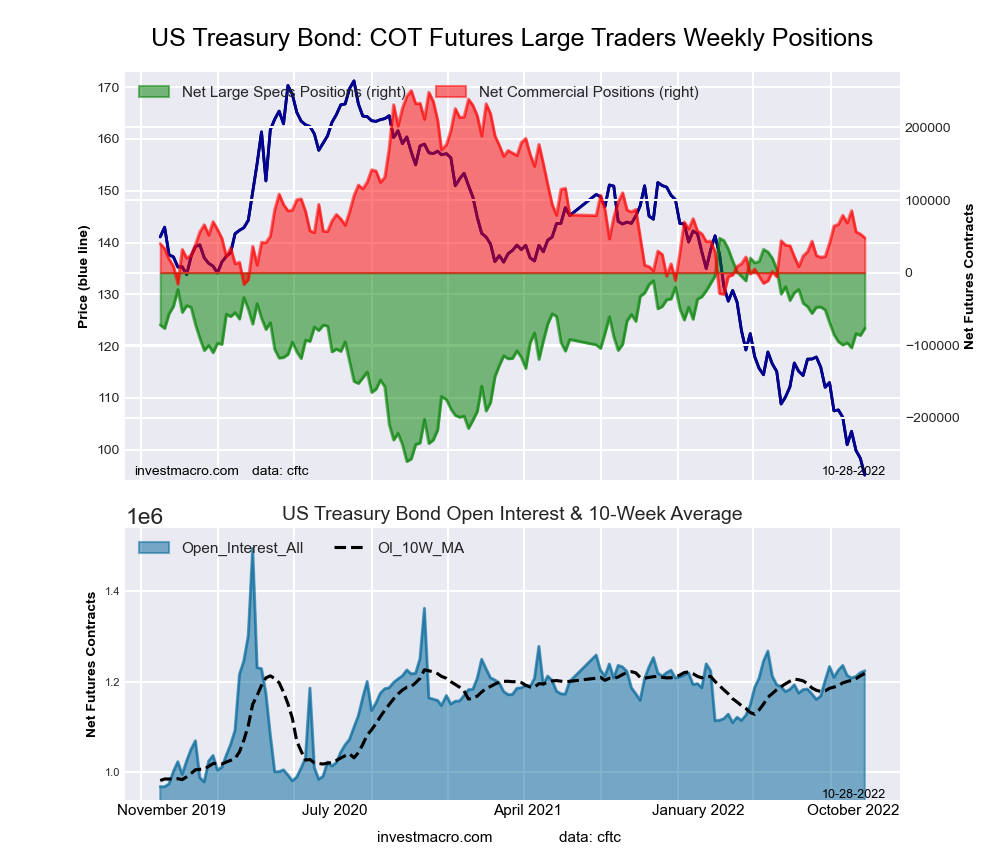
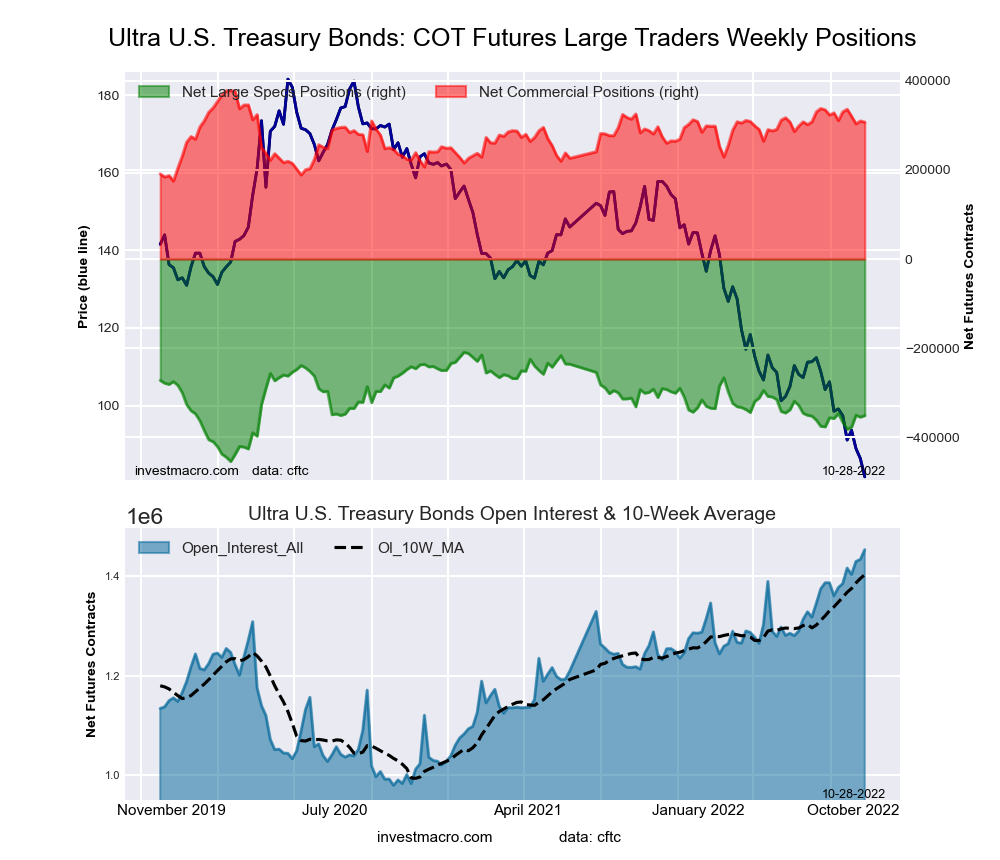
Strength Scores (a normalized measure of Speculator positions over a 3-Year range, from 0 to 100 where above 80 is extreme bullish and below 20 is extreme bearish) show that the US Treasury Bond (57.3 percent) lead the bonds category. This is the only market above 50 percent or the midpoint of its 3-year range. The Ultra US Treasury Bond (42.3 percent) comes in as the next highest bonds market in strength scores and its score this week has risen from 31.5 percent last week.

On the downside, the Ultra 10-Year Bond (9.1 percent), the 2-Year Bond (10.8 percent), the 5-Year Bond (12.3 percent) and the Eurodollar (13.7 percent) come in at the lowest strength level currently and are all in bearish extreme speculator levels (below 20 percent).

Strength Statistics:
Fed Funds (39.7 percent) vs Fed Funds previous week (38.8 percent)
2-Year Bond (10.8 percent) vs 2-Year Bond previous week (20.4 percent)
5-Year Bond (12.3 percent) vs 5-Year Bond previous week (12.5 percent)
10-Year Bond (20.7 percent) vs 10-Year Bond previous week (16.7 percent)
Ultra 10-Year Bond (9.1 percent) vs Ultra 10-Year Bond previous week (7.4 percent)
US Treasury Bond (57.3 percent) vs US Treasury Bond previous week (50.9 percent)
Ultra US Treasury Bond (42.3 percent) vs Ultra US Treasury Bond previous week (31.5 percent)
Eurodollar (13.7 percent) vs Eurodollar previous week (14.7 percent)

Strength Trends led by 10-Year Bond

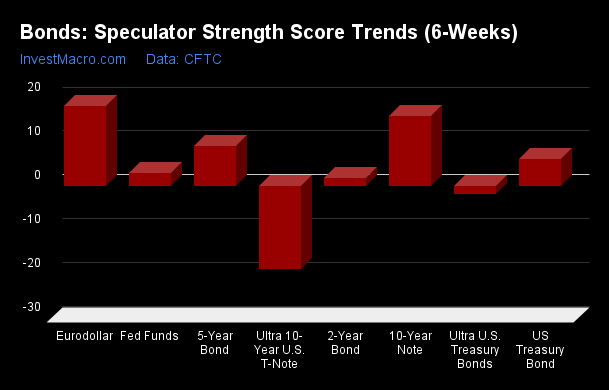
Strength Score Trends (or move index, calculates the 6-week changes in strength scores) show that the 10-Year Bond (15.2 percent) leads the past six weeks trends for bonds this week. The Eurodollar (13.2 percent), the 5-Year Bond (12.3 percent) and the Ultra US Treasury Bond (2.3 percent) fill out the rest of the positive movers in the latest trends data.

The Ultra 10-Year Bond (-15.0 percent) and the 2-Year Bond (-14.6 percent) lead the downside trend scores this week followed by the Fed Funds (-10.4 percent).

Strength Trend Statistics:
Fed Funds (-10.4 percent) vs Fed Funds previous week (-13.5 percent)
2-Year Bond (-14.6 percent) vs 2-Year Bond previous week (-13.1 percent)
5-Year Bond (12.3 percent) vs 5-Year Bond previous week (3.1 percent)
10-Year Bond (15.2 percent) vs 10-Year Bond previous week (2.2 percent)
Ultra 10-Year Bond (-15.0 percent) vs Ultra 10-Year Bond previous week (-14.8 percent)
US Treasury Bond (-4.9 percent) vs US Treasury Bond previous week (-17.0 percent)
Ultra US Treasury Bond (2.3 percent) vs Ultra US Treasury Bond previous week (-0.2 percent)
Eurodollar (13.2 percent) vs Eurodollar previous week (14.6 percent)


Individual Bond Markets:

3-Month Eurodollars Futures:

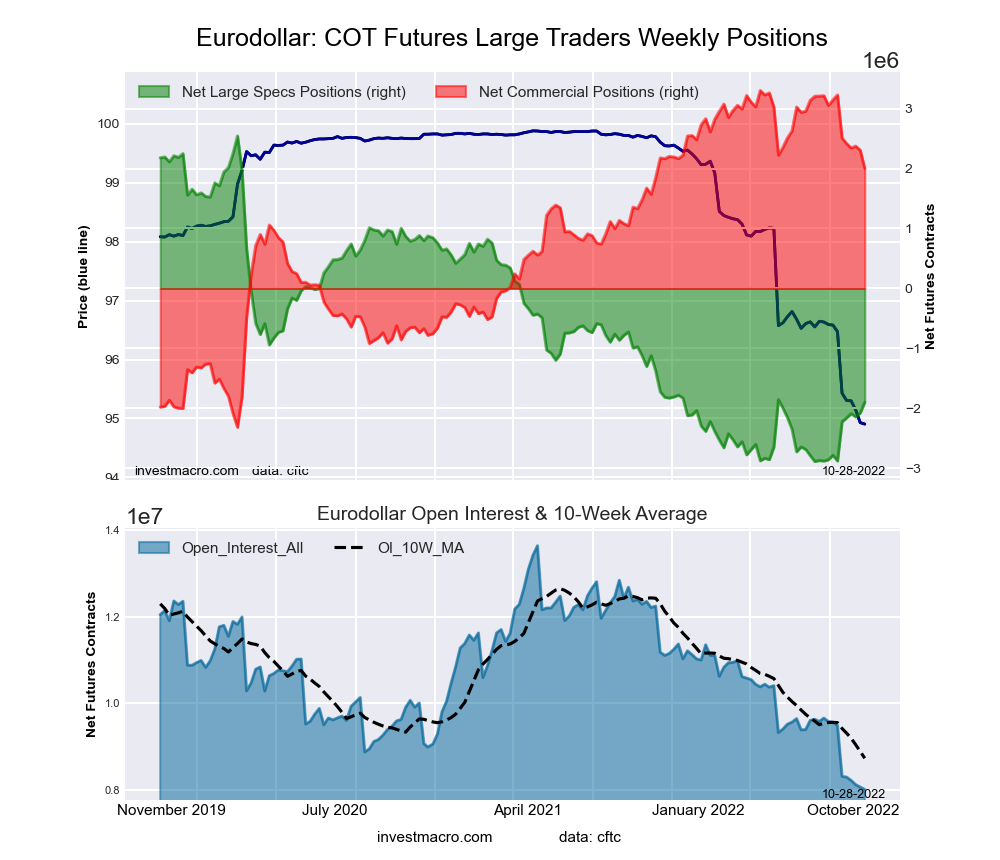
Eurodollar Bonds Futures COT ChartThe 3-Month Eurodollars large speculator standing this week recorded a net position of -2,143,216 contracts in the data reported through Tuesday. This was a weekly decrease of -55,468 contracts from the previous week which had a total of -2,087,748 net contracts.

This week’s current strength score (the trader positioning range over the past three years, measured from 0 to 100) shows the speculators are currently Bearish-Extreme with a score of 13.7 percent. The commercials are Bullish-Extreme with a score of 83.5 percent and the small traders (not shown in chart) are Bullish with a score of 53.7 percent.

3-Month Eurodollars StatisticsSPECULATORSCOMMERCIALSSMALL TRADERS
– Percent of Open Interest Longs:7.369.45.1
– Percent of Open Interest Shorts:33.640.27.9
– Net Position:-2,143,2162,373,775-230,559
– Gross Longs:591,0905,639,550411,933
– Gross Shorts:2,734,3063,265,775642,492
– Long to Short Ratio:0.2 to 11.7 to 10.6 to 1
NET POSITION TREND:
– Strength Index Score (3 Year Range Pct):13.783.553.7
– Strength Index Reading (3 Year Range):Bearish-ExtremeBullish-ExtremeBullish
NET POSITION MOVEMENT INDEX:
– 6-Week Change in Strength Index:13.2-12.1-7.6


30-Day Federal Funds Futures:

Federal Funds 30-Day Bonds Futures COT ChartThe 30-Day Federal Funds large speculator standing this week recorded a net position of 888 contracts in the data reported through Tuesday. This was a weekly rise of 7,692 contracts from the previous week which had a total of -6,804 net contracts.

This week’s current strength score (the trader positioning range over the past three years, measured from 0 to 100) shows the speculators are currently Bearish with a score of 39.7 percent. The commercials are Bullish with a score of 62.6 percent and the small traders (not shown in chart) are Bearish-Extreme with a score of 0.9 percent.

30-Day Federal Funds StatisticsSPECULATORSCOMMERCIALSSMALL TRADERS
– Percent of Open Interest Longs:10.773.31.4
– Percent of Open Interest Shorts:10.671.92.8
– Net Position:88822,183-23,071
– Gross Longs:172,3271,185,07322,805
– Gross Shorts:171,4391,162,89045,876
– Long to Short Ratio:1.0 to 11.0 to 10.5 to 1
NET POSITION TREND:
– Strength Index Score (3 Year Range Pct):39.762.60.9
– Strength Index Reading (3 Year Range):BearishBullishBearish-Extreme
NET POSITION MOVEMENT INDEX:
– 6-Week Change in Strength Index:-10.412.2-42.1


2-Year Treasury Note Futures:

2-Year Treasury Bonds Futures COT ChartThe 2-Year Treasury Note large speculator standing this week recorded a net position of -353,686 contracts in the cot data reported through Tuesday. This was a weekly lowering of -47,552 contracts from the previous week which had a total of -306,134 net contracts.

This week’s current strength score (the trader positioning range over the past three years, measured from 0 to 100) shows the speculators are currently Bearish-Extreme with a score of 10.8 percent. The commercials are Bullish-Extreme with a score of 100.0 percent and the small traders (not shown in chart) are Bearish-Extreme with a score of 11.8 percent.

2-Year Treasury Note StatisticsSPECULATORSCOMMERCIALSSMALL TRADERS
– Percent of Open Interest Longs:7.082.77.9
– Percent of Open Interest Shorts:24.361.112.3
– Net Position:-353,686443,750-90,064
– Gross Longs:143,2771,692,889160,698
– Gross Shorts:496,9631,249,139250,762
– Long to Short Ratio:0.3 to 11.4 to 10.6 to 1
NET POSITION TREND:
– Strength Index Score (3 Year Range Pct):10.8100.011.8
– Strength Index Reading (3 Year Range):Bearish-ExtremeBullish-ExtremeBearish-Extreme
NET POSITION MOVEMENT INDEX:
– 6-Week Change in Strength Index:-14.618.5-10.4


5-Year Treasury Note Futures:

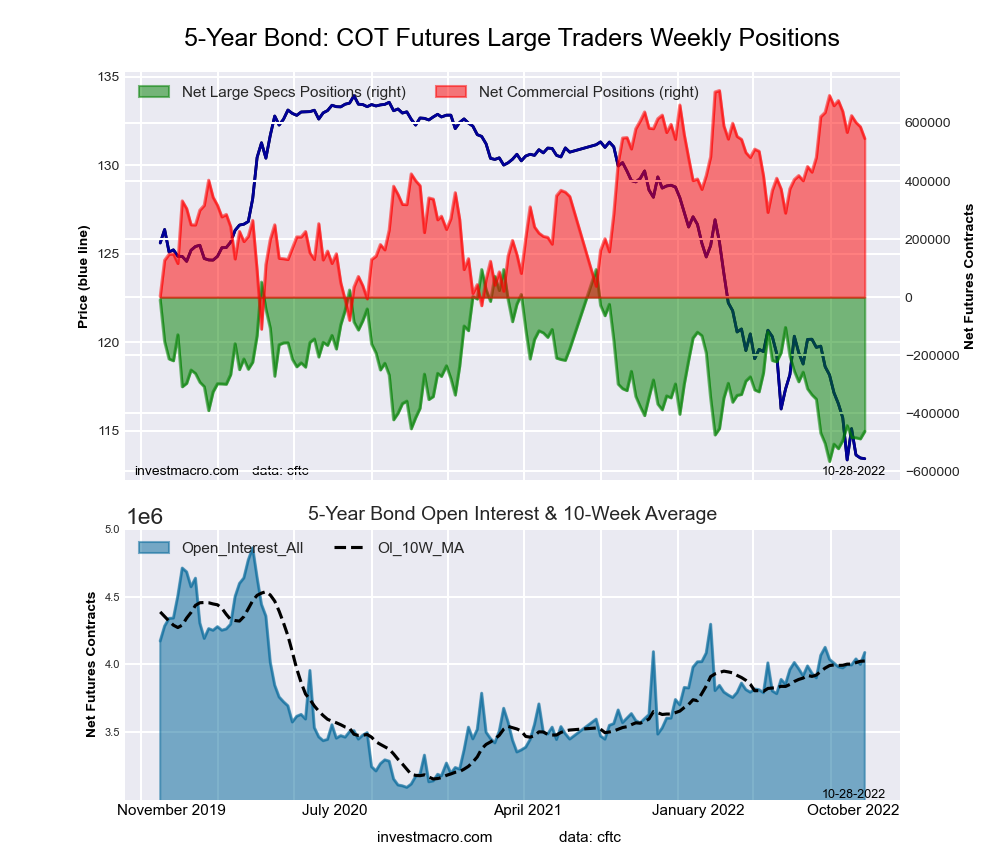
5-Year Treasury Bonds Futures COT ChartThe 5-Year Treasury Note large speculator standing this week recorded a net position of -483,920 contracts in the data reported through Tuesday. This was a weekly decline of -888 contracts from the previous week which had a total of -483,032 net contracts.

This week’s current strength score (the trader positioning range over the past three years, measured from 0 to 100) shows the speculators are currently Bearish-Extreme with a score of 12.3 percent. The commercials are Bullish-Extreme with a score of 86.6 percent and the small traders (not shown in chart) are Bearish with a score of 48.6 percent.

5-Year Treasury Note StatisticsSPECULATORSCOMMERCIALSSMALL TRADERS
– Percent of Open Interest Longs:6.085.57.5
– Percent of Open Interest Shorts:18.070.610.4
– Net Position:-483,920601,685-117,765
– Gross Longs:243,7723,456,189303,741
– Gross Shorts:727,6922,854,504421,506
– Long to Short Ratio:0.3 to 11.2 to 10.7 to 1
NET POSITION TREND:
– Strength Index Score (3 Year Range Pct):12.386.648.6
– Strength Index Reading (3 Year Range):Bearish-ExtremeBullish-ExtremeBearish
NET POSITION MOVEMENT INDEX:
– 6-Week Change in Strength Index:12.3-11.33.1


10-Year Treasury Note Futures:

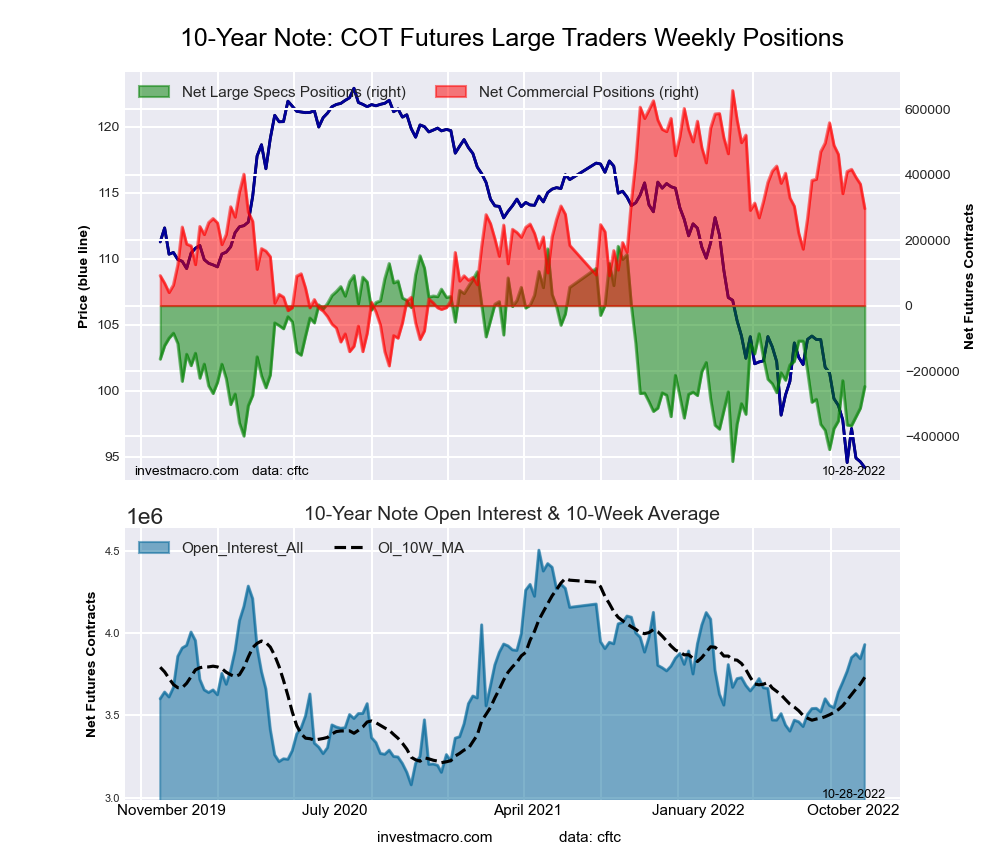
10-Year Treasury Notes Bonds Futures COT ChartThe 10-Year Treasury Note large speculator standing this week recorded a net position of -340,163 contracts in the data reported through Tuesday. This was a weekly rise of 26,709 contracts from the previous week which had a total of -366,872 net contracts.

This week’s current strength score (the trader positioning range over the past three years, measured from 0 to 100) shows the speculators are currently Bearish with a score of 20.7 percent. The commercials are Bullish with a score of 68.5 percent and the small traders (not shown in chart) are Bullish with a score of 67.7 percent.

10-Year Treasury Note StatisticsSPECULATORSCOMMERCIALSSMALL TRADERS
– Percent of Open Interest Longs:9.978.58.9
– Percent of Open Interest Shorts:18.768.310.3
– Net Position:-340,163392,171-52,008
– Gross Longs:382,9093,039,993345,964
– Gross Shorts:723,0722,647,822397,972
– Long to Short Ratio:0.5 to 11.1 to 10.9 to 1
NET POSITION TREND:
– Strength Index Score (3 Year Range Pct):20.768.567.7
– Strength Index Reading (3 Year Range):BearishBullishBullish
NET POSITION MOVEMENT INDEX:
– 6-Week Change in Strength Index:15.2-19.815.8


Ultra 10-Year Notes Futures:

Ultra 10-Year Treasury Notes Bonds Futures COT ChartThe Ultra 10-Year Notes large speculator standing this week recorded a net position of -75,771 contracts in the data reported through Tuesday. This was a weekly rise of 6,320 contracts from the previous week which had a total of -82,091 net contracts.

This week’s current strength score (the trader positioning range over the past three years, measured from 0 to 100) shows the speculators are currently Bearish-Extreme with a score of 9.1 percent. The commercials are Bullish-Extreme with a score of 87.0 percent and the small traders (not shown in chart) are Bullish with a score of 56.5 percent.

Ultra 10-Year Notes StatisticsSPECULATORSCOMMERCIALSSMALL TRADERS
– Percent of Open Interest Longs:7.981.410.0
– Percent of Open Interest Shorts:13.368.317.7
– Net Position:-75,771182,196-106,425
– Gross Longs:109,0931,127,822138,379
– Gross Shorts:184,864945,626244,804
– Long to Short Ratio:0.6 to 11.2 to 10.6 to 1
NET POSITION TREND:
– Strength Index Score (3 Year Range Pct):9.187.056.5
– Strength Index Reading (3 Year Range):Bearish-ExtremeBullish-ExtremeBullish
NET POSITION MOVEMENT INDEX:
– 6-Week Change in Strength Index:-15.014.70.2


US Treasury Bonds Futures:

US Year Treasury Notes Long Bonds Futures COT ChartThe US Treasury Bonds large speculator standing this week recorded a net position of -83,792 contracts in the data reported through Tuesday. This was a weekly rise of 19,731 contracts from the previous week which had a total of -103,523 net contracts.

This week’s current strength score (the trader positioning range over the past three years, measured from 0 to 100) shows the speculators are currently Bullish with a score of 57.3 percent. The commercials are Bearish with a score of 30.6 percent and the small traders (not shown in chart) are Bullish with a score of 74.5 percent.

US Treasury Bonds StatisticsSPECULATORSCOMMERCIALSSMALL TRADERS
– Percent of Open Interest Longs:6.778.513.8
– Percent of Open Interest Shorts:13.673.911.5
– Net Position:-83,79256,15727,635
– Gross Longs:81,465951,230166,967
– Gross Shorts:165,257895,073139,332
– Long to Short Ratio:0.5 to 11.1 to 11.2 to 1
NET POSITION TREND:
– Strength Index Score (3 Year Range Pct):57.330.674.5
– Strength Index Reading (3 Year Range):BullishBearishBullish
NET POSITION MOVEMENT INDEX:
– 6-Week Change in Strength Index:-4.95.5-0.3


Ultra US Treasury Bonds Futures:

Ultra US Year Treasury Notes Long Bonds Futures COT ChartThe Ultra US Treasury Bonds large speculator standing this week recorded a net position of -350,232 contracts in the data reported through Tuesday. This was a weekly advance of 26,591 contracts from the previous week which had a total of -376,823 net contracts.

This week’s current strength score (the trader positioning range over the past three years, measured from 0 to 100) shows the speculators are currently Bearish with a score of 42.3 percent. The commercials are Bullish with a score of 63.2 percent and the small traders (not shown in chart) are Bullish with a score of 62.0 percent.

Ultra US Treasury Bonds StatisticsSPECULATORSCOMMERCIALSSMALL TRADERS
– Percent of Open Interest Longs:6.282.011.2
– Percent of Open Interest Shorts:30.760.77.9
– Net Position:-350,232303,28346,949
– Gross Longs:88,1461,171,440160,022
– Gross Shorts:438,378868,157113,073
– Long to Short Ratio:0.2 to 11.3 to 11.4 to 1
NET POSITION TREND:
– Strength Index Score (3 Year Range Pct):42.363.262.0
– Strength Index Reading (3 Year Range):BearishBullishBullish
NET POSITION MOVEMENT INDEX:
– 6-Week Change in Strength Index:2.3-9.810.3


Article By InvestMacroReceive our weekly COT Newsletter

*COT Report: The COT data, released weekly to the public each Friday, is updated through the most recent Tuesday (data is 3 days old) and shows a quick view of how large speculators or non-commercials (for-profit traders) were positioned in the futures markets.

The CFTC categorizes trader positions according to commercial hedgers (traders who use futures contracts for hedging as part of the business), non-commercials (large traders who speculate to realize trading profits) and nonreportable traders (usually small traders/speculators) as well as their open interest (contracts open in the market at time of reporting). See CFTC criteria here.

COT Metals Speculators boost their Gold bullish bets 2nd week

By InvestMacro

Here are the latest charts and statistics for the Commitment of Traders (COT) data published by the Commodities Futures Trading Commission (CFTC).

The latest COT data is updated through Tuesday October 11th and shows a quick view of how large traders (for-profit speculators and commercial entities) were positioned in the futures markets.

Weekly Speculator Changes shows Gold, Platinum & Copper have higher bets

The COT precious metals speculator bets were higher this week as three out of the five metals markets we cover had higher positioning this week while two markets had lower contracts.

Leading the gains for the precious metals markets was Gold (6,035 contracts) with Platinum (2,647 contracts) and Copper (2,352 contracts) also showing a positive week.

The metals markets leading the declines in speculator bets this week were Silver (-1,319 contracts) with Palladium (-158 contracts) also registering lower bets on the week.

Highlighting the metals COT markets this week is the Gold positioning that has rebounded slightly from the steep declines over the past couple of months. Gold speculator bets rose for a second straight week this week after seeing a decline in the previous seven straight weeks (a total drop of -90,770 speculator contracts over that period). The Gold position, on September 27th, had fallen to the lowest level in the past 179-weeks before rebounding over the past two weeks. Last week’s rise in speculator bets by over +36,000 contracts was the largest one-week increase since February 18th of 2020 and today’s speculator positioning is now back close to the +100,000 contract level. Gold prices, meanwhile, are currently trading just below the $1,650 support level after falling over 3 percent this week. The price decline is potentially setting up a new test of the 2-year lows under $1,620 that took place in late September.


Data Snapshot of Commodity Market Traders | Columns Legend
Oct-11-2022OIOI-IndexSpec-NetSpec-IndexCom-NetCOM-IndexSmalls-NetSmalls-Index
WTI Crude1,499,4983259,22013-283,6268824,40641
Gold431,395094,42014-103,728879,3083
Silver125,62307,38922-15,603808,21410
Copper167,4498-15,8992416,90380-1,00419
Palladium6,8905-7541981079-5641
Platinum52,43595,92817-8,690852,7625
Natural Gas974,4685-162,10330130,0997232,00456
Brent163,11311-41,8884138,882583,00650
Heating Oil275,2622519,42371-38,4483019,02564
Soybeans694,9602655,76930-30,61477-25,15529
Corn1,408,93920325,12172-258,22535-66,8965
Coffee188,198340,53473-43,359302,82529
Sugar687,2090101,11557-135,1454334,03050
Wheat307,9019-1,990168,70572-6,71576


Silver and Copper top the Strength Scores

Strength scores (a measure of the 3-Year range of Speculator positions, from 0 to 100 where above 80 is extreme bullish and below 20 is extreme bearish) showed that the Copper (23.7 percent) and Silver (22.3 percent) lead the metals this week.

On the downside, Gold (14.0 percent), Platinum (17.1 percent) and Palladium (19.1 percent) continue to be at the lower end of their range and are all in bearish extreme positions below 20 percent.

Strength Statistics:
Gold (14.0 percent) vs Gold previous week (12.0 percent)
Silver (22.3 percent) vs Silver previous week (23.7 percent)
Copper (23.7 percent) vs Copper previous week (21.8 percent)
Platinum (17.1 percent) vs Platinum previous week (13.5 percent)
Palladium (19.1 percent) vs Palladium previous week (20.0 percent)

Strength Trends led Silver and Platinum

Strength Score Trends (or move index, calculates the 6-week changes in strength scores) show that the Silver (17.3 percent) and Platinum (15.2 percent) lead the past six weeks trends for metals this week. Copper (5.9 percent) and Palladium (2.2 percent) fill out the other positive movers in the latest trends data.

This leaves Gold (-7.7 percent) as the only negative mover over the past six weeks. Gold, however, has been seeing improvements in the past few weeks and is higher this week from -12.4 percent last week.

Move Statistics:
Gold (-7.7 percent) vs Gold previous week (-12.4 percent)
Silver (17.3 percent) vs Silver previous week (14.6 percent)
Copper (5.9 percent) vs Copper previous week (0.6 percent)
Platinum (15.2 percent) vs Platinum previous week (5.2 percent)
Palladium (2.2 percent) vs Palladium previous week (6.9 percent)


Individual Markets:

Gold Comex Futures:

Gold Futures COT ChartThe Gold Comex Futures large speculator standing this week came in at a net position of 94,420 contracts in the data reported through Tuesday. This was a weekly gain of 6,035 contracts from the previous week which had a total of 88,385 net contracts.

This week’s current strength score (the trader positioning range over the past three years, measured from 0 to 100) shows the speculators are currently Bearish-Extreme with a score of 14.0 percent. The commercials are Bullish-Extreme with a score of 87.1 percent and the small traders (not shown in chart) are Bearish-Extreme with a score of 2.9 percent.

Gold Futures StatisticsSPECULATORSCOMMERCIALSSMALL TRADERS
– Percent of Open Interest Longs:49.326.28.6
– Percent of Open Interest Shorts:27.450.26.4
– Net Position:94,420-103,7289,308
– Gross Longs:212,561112,86736,988
– Gross Shorts:118,141216,59527,680
– Long to Short Ratio:1.8 to 10.5 to 11.3 to 1
NET POSITION TREND:
– Strength Index Score (3 Year Range Pct):14.087.12.9
– Strength Index Reading (3 Year Range):Bearish-ExtremeBullish-ExtremeBearish-Extreme
NET POSITION MOVEMENT INDEX:
– 6-Week Change in Strength Index:-7.78.0-6.6


Silver Comex Futures:

Silver Futures COT ChartThe Silver Comex Futures large speculator standing this week came in at a net position of 7,389 contracts in the data reported through Tuesday. This was a weekly decrease of -1,319 contracts from the previous week which had a total of 8,708 net contracts.

This week’s current strength score (the trader positioning range over the past three years, measured from 0 to 100) shows the speculators are currently Bearish with a score of 22.3 percent. The commercials are Bullish-Extreme with a score of 80.5 percent and the small traders (not shown in chart) are Bearish-Extreme with a score of 10.1 percent.

Silver Futures StatisticsSPECULATORSCOMMERCIALSSMALL TRADERS
– Percent of Open Interest Longs:38.237.917.0
– Percent of Open Interest Shorts:32.350.310.5
– Net Position:7,389-15,6038,214
– Gross Longs:47,93947,60321,347
– Gross Shorts:40,55063,20613,133
– Long to Short Ratio:1.2 to 10.8 to 11.6 to 1
NET POSITION TREND:
– Strength Index Score (3 Year Range Pct):22.380.510.1
– Strength Index Reading (3 Year Range):BearishBullish-ExtremeBearish-Extreme
NET POSITION MOVEMENT INDEX:
– 6-Week Change in Strength Index:17.3-15.01.0


Copper Grade #1 Futures:

Copper Futures COT ChartThe Copper Grade #1 Futures large speculator standing this week came in at a net position of -15,899 contracts in the data reported through Tuesday. This was a weekly gain of 2,352 contracts from the previous week which had a total of -18,251 net contracts.

This week’s current strength score (the trader positioning range over the past three years, measured from 0 to 100) shows the speculators are currently Bearish with a score of 23.7 percent. The commercials are Bullish-Extreme with a score of 80.1 percent and the small traders (not shown in chart) are Bearish-Extreme with a score of 19.5 percent.

Copper Futures StatisticsSPECULATORSCOMMERCIALSSMALL TRADERS
– Percent of Open Interest Longs:30.547.28.3
– Percent of Open Interest Shorts:40.037.18.9
– Net Position:-15,89916,903-1,004
– Gross Longs:51,02179,07913,853
– Gross Shorts:66,92062,17614,857
– Long to Short Ratio:0.8 to 11.3 to 10.9 to 1
NET POSITION TREND:
– Strength Index Score (3 Year Range Pct):23.780.119.5
– Strength Index Reading (3 Year Range):BearishBullish-ExtremeBearish-Extreme
NET POSITION MOVEMENT INDEX:
– 6-Week Change in Strength Index:5.9-6.34.2


Platinum Futures:

Platinum Futures COT ChartThe Platinum Futures large speculator standing this week came in at a net position of 5,928 contracts in the data reported through Tuesday. This was a weekly boost of 2,647 contracts from the previous week which had a total of 3,281 net contracts.

This week’s current strength score (the trader positioning range over the past three years, measured from 0 to 100) shows the speculators are currently Bearish-Extreme with a score of 17.1 percent. The commercials are Bullish-Extreme with a score of 85.1 percent and the small traders (not shown in chart) are Bearish-Extreme with a score of 5.3 percent.

Platinum Futures StatisticsSPECULATORSCOMMERCIALSSMALL TRADERS
– Percent of Open Interest Longs:46.438.012.5
– Percent of Open Interest Shorts:35.054.67.2
– Net Position:5,928-8,6902,762
– Gross Longs:24,30619,9476,554
– Gross Shorts:18,37828,6373,792
– Long to Short Ratio:1.3 to 10.7 to 11.7 to 1
NET POSITION TREND:
– Strength Index Score (3 Year Range Pct):17.185.15.3
– Strength Index Reading (3 Year Range):Bearish-ExtremeBullish-ExtremeBearish-Extreme
NET POSITION MOVEMENT INDEX:
– 6-Week Change in Strength Index:15.2-11.8-26.2


Palladium Futures:

Palladium Futures COT ChartThe Palladium Futures large speculator standing this week came in at a net position of -754 contracts in the data reported through Tuesday. This was a weekly fall of -158 contracts from the previous week which had a total of -596 net contracts.

This week’s current strength score (the trader positioning range over the past three years, measured from 0 to 100) shows the speculators are currently Bearish-Extreme with a score of 19.1 percent. The commercials are Bullish with a score of 79.0 percent and the small traders (not shown in chart) are Bearish with a score of 40.6 percent.

Palladium Futures StatisticsSPECULATORSCOMMERCIALSSMALL TRADERS
– Percent of Open Interest Longs:29.753.116.2
– Percent of Open Interest Shorts:40.741.317.1
– Net Position:-754810-56
– Gross Longs:2,0493,6561,119
– Gross Shorts:2,8032,8461,175
– Long to Short Ratio:0.7 to 11.3 to 11.0 to 1
NET POSITION TREND:
– Strength Index Score (3 Year Range Pct):19.179.040.6
– Strength Index Reading (3 Year Range):Bearish-ExtremeBullishBearish
NET POSITION MOVEMENT INDEX:
– 6-Week Change in Strength Index:2.2-2.98.0


Article By InvestMacroReceive our weekly COT Newsletter

*COT Report: The COT data, released weekly to the public each Friday, is updated through the most recent Tuesday (data is 3 days old) and shows a quick view of how large speculators or non-commercials (for-profit traders) were positioned in the futures markets.

The CFTC categorizes trader positions according to commercial hedgers (traders who use futures contracts for hedging as part of the business), non-commercials (large traders who speculate to realize trading profits) and nonreportable traders (usually small traders/speculators) as well as their open interest (contracts open in the market at time of reporting). See CFTC criteria here.

COT Soft Commodities Speculator positions led by jump in Sugar bullish bets

By InvestMacro

Here are the latest charts and statistics for the Commitment of Traders (COT) reports data published by the Commodities Futures Trading Commission (CFTC).

The latest COT data is updated through Tuesday October 11th and shows a quick view of how large traders (for-profit speculators and commercial entities) were positioned in the futures markets.

Weekly Speculator Changes led by jump in Sugar bets

The COT soft commodities speculator bets were overall lower this week as just three out of the eleven soft commodities markets we cover had higher positioning this week while the other eight markets had decreases in contracts.

Leading the gains for soft commodities markets was Sugar (54,028 contracts) with Corn (20,159 contracts) and Cocoa (13,522 contracts) also showing positive weeks.

The softs market leading the declines in speculator bets this week was Soybeans (-10,988 contracts) with Soybean Meal (-9,321 contracts), Wheat (-7,614 contracts), Lean Hogs (-4,461 contracts), Live Cattle (-3,453 contracts), Soybean Oil (-2,165 contracts), Coffee (-1,617 contracts) and Cotton (-1,578 contracts) all having lower bets on the week.

Highlighting this week’s COT softs data was the jump in speculator bets for Sugar. This week’s speculator positions rose by over +54,000 contracts and the position has now risen in six of the past nine weeks (total gain of +75,050 contracts in that period). This bullishness has now pushed the overall Sugar net speculator standing (+101,115 contracts) to the most bullish level of the past twelve weeks, dating back to July 19th. Sugar prices trade near their highest levels since 2017 as production issues and tight supply keeps the market buoyant.


Data Snapshot of Commodity Market Traders | Columns Legend
Oct-11-2022OIOI-IndexSpec-NetSpec-IndexCom-NetCOM-IndexSmalls-NetSmalls-Index
WTI Crude1,499,4983259,22013-283,6268824,40641
Gold431,395094,42014-103,728879,3083
Silver125,62307,38922-15,603808,21410
Copper167,4498-15,8992416,90380-1,00419
Palladium6,8905-7541981079-5641
Platinum52,43595,92817-8,690852,7625
Natural Gas974,4685-162,10330130,0997232,00456
Brent163,11311-41,8884138,882583,00650
Heating Oil275,2622519,42371-38,4483019,02564
Soybeans694,9602655,76930-30,61477-25,15529
Corn1,408,93920325,12172-258,22535-66,8965
Coffee188,198340,53473-43,359302,82529
Sugar687,2090101,11557-135,1454334,03050
Wheat307,9019-1,990168,70572-6,71576


Strength Scores led by Soybean Meal, Coffee and Corn

Strength Scores (a normalized measure of Speculator positions over a 3-Year range, from 0 to 100 where above 80 is extreme bullish and below 20 is extreme bearish) showed that Soybean Meal (81.3 percent), Coffee (73.1 percent) and Corn (71.6 percent) lead the soft commodity markets this week. Soybean Meal remains in a bullish extreme position (above 80 percent). Sugar (57.4 percent) comes in as the only other soft commodity markets above 50 percent in strength scores.

On the downside, Wheat (16.5 percent) comes in at the lowest strength level currently and is in a bearish extreme position (below 20 percent).

Strength Statistics:
Corn (71.6 percent) vs Corn previous week (69.0 percent)
Sugar (57.4 percent) vs Sugar previous week (46.3 percent)
Coffee (73.1 percent) vs Coffee previous week (74.6 percent)
Soybeans (30.5 percent) vs Soybeans previous week (33.9 percent)
Soybean Oil (42.7 percent) vs Soybean Oil previous week (44.2 percent)
Soybean Meal (81.3 percent) vs Soybean Meal previous week (86.4 percent)
Live Cattle (29.1 percent) vs Live Cattle previous week (33.4 percent)
Lean Hogs (27.6 percent) vs Lean Hogs previous week (32.5 percent)
Cotton (37.7 percent) vs Cotton previous week (38.9 percent)
Cocoa (30.4 percent) vs Cocoa previous week (17.0 percent)
Wheat (16.5 percent) vs Wheat previous week (26.4 percent)

Strength Trends led by Wheat this week

Strength Score Trends (or move index, calculates the 6-week changes in strength scores) show that Wheat (12.4 percent) leads the past six weeks trends for soft commodity markets this week. Sugar (7.9 percent), Corn (5.3 percent) and Cocoa (5.3 percent) fill out the next top movers in the latest trends data.

Lean Hogs (-26.2 percent) and Live Cattle (-25.2 percent) lead the downside trend scores currently while the next market with lower trend scores was Cotton (-11.6 percent) followed by Soybean Meal (-10.9 percent).

Strength Trend Statistics:
Corn (5.3 percent) vs Corn previous week (5.3 percent)
Sugar (7.9 percent) vs Sugar previous week (-2.3 percent)
Coffee (-7.2 percent) vs Coffee previous week (3.1 percent)
Soybeans (-8.5 percent) vs Soybeans previous week (-6.5 percent)
Soybean Oil (2.7 percent) vs Soybean Oil previous week (9.3 percent)
Soybean Meal (-10.9 percent) vs Soybean Meal previous week (-6.5 percent)
Live Cattle (-25.2 percent) vs Live Cattle previous week (-23.8 percent)
Lean Hogs (-26.2 percent) vs Lean Hogs previous week (-30.3 percent)
Cotton (-11.6 percent) vs Cotton previous week (-10.2 percent)
Cocoa (5.3 percent) vs Cocoa previous week (1.3 percent)
Wheat (12.4 percent) vs Wheat previous week (18.1 percent)


Individual Markets:

CORN Futures:

CORN Futures COT ChartThe CORN large speculator standing this week was a net position of 325,121 contracts in the data reported through Tuesday. This was a weekly lift of 20,159 contracts from the previous week which had a total of 304,962 net contracts.

This week’s current strength score (the trader positioning range over the past three years, measured from 0 to 100) shows the speculators are currently Bullish with a score of 71.6 percent. The commercials are Bearish with a score of 35.1 percent and the small traders (not shown in chart) are Bearish-Extreme with a score of 4.6 percent.

CORN Futures StatisticsSPECULATORSCOMMERCIALSSMALL TRADERS
– Percent of Open Interest Longs:31.645.38.6
– Percent of Open Interest Shorts:8.663.613.3
– Net Position:325,121-258,225-66,896
– Gross Longs:445,776637,863120,700
– Gross Shorts:120,655896,088187,596
– Long to Short Ratio:3.7 to 10.7 to 10.6 to 1
NET POSITION TREND:
– Strength Index Score (3 Year Range Pct):71.635.14.6
– Strength Index Reading (3 Year Range):BullishBearishBearish-Extreme
NET POSITION MOVEMENT INDEX:
– 6-Week Change in Strength Index:5.3-4.6-5.3


SUGAR Futures:

SUGAR Futures COT ChartThe SUGAR large speculator standing this week was a net position of 101,115 contracts in the data reported through Tuesday. This was a weekly lift of 54,028 contracts from the previous week which had a total of 47,087 net contracts.

This week’s current strength score (the trader positioning range over the past three years, measured from 0 to 100) shows the speculators are currently Bullish with a score of 57.4 percent. The commercials are Bearish with a score of 42.5 percent and the small traders (not shown in chart) are Bearish with a score of 49.9 percent.

SUGAR Futures StatisticsSPECULATORSCOMMERCIALSSMALL TRADERS
– Percent of Open Interest Longs:26.649.911.9
– Percent of Open Interest Shorts:11.969.66.9
– Net Position:101,115-135,14534,030
– Gross Longs:183,050343,01781,678
– Gross Shorts:81,935478,16247,648
– Long to Short Ratio:2.2 to 10.7 to 11.7 to 1
NET POSITION TREND:
– Strength Index Score (3 Year Range Pct):57.442.549.9
– Strength Index Reading (3 Year Range):BullishBearishBearish
NET POSITION MOVEMENT INDEX:
– 6-Week Change in Strength Index:7.9-11.929.6


COFFEE Futures:

COFFEE Futures COT ChartThe COFFEE large speculator standing this week was a net position of 40,534 contracts in the data reported through Tuesday. This was a weekly reduction of -1,617 contracts from the previous week which had a total of 42,151 net contracts.

This week’s current strength score (the trader positioning range over the past three years, measured from 0 to 100) shows the speculators are currently Bullish with a score of 73.1 percent. The commercials are Bearish with a score of 30.4 percent and the small traders (not shown in chart) are Bearish with a score of 29.1 percent.

COFFEE Futures StatisticsSPECULATORSCOMMERCIALSSMALL TRADERS
– Percent of Open Interest Longs:27.347.44.9
– Percent of Open Interest Shorts:5.870.43.4
– Net Position:40,534-43,3592,825
– Gross Longs:51,35989,1319,226
– Gross Shorts:10,825132,4906,401
– Long to Short Ratio:4.7 to 10.7 to 11.4 to 1
NET POSITION TREND:
– Strength Index Score (3 Year Range Pct):73.130.429.1
– Strength Index Reading (3 Year Range):BullishBearishBearish
NET POSITION MOVEMENT INDEX:
– 6-Week Change in Strength Index:-7.27.05.5


SOYBEANS Futures:

SOYBEANS Futures COT ChartThe SOYBEANS large speculator standing this week was a net position of 55,769 contracts in the data reported through Tuesday. This was a weekly reduction of -10,988 contracts from the previous week which had a total of 66,757 net contracts.

This week’s current strength score (the trader positioning range over the past three years, measured from 0 to 100) shows the speculators are currently Bearish with a score of 30.5 percent. The commercials are Bullish with a score of 77.3 percent and the small traders (not shown in chart) are Bearish with a score of 28.6 percent.

SOYBEANS Futures StatisticsSPECULATORSCOMMERCIALSSMALL TRADERS
– Percent of Open Interest Longs:18.657.37.2
– Percent of Open Interest Shorts:10.661.710.8
– Net Position:55,769-30,614-25,155
– Gross Longs:129,287398,24149,837
– Gross Shorts:73,518428,85574,992
– Long to Short Ratio:1.8 to 10.9 to 10.7 to 1
NET POSITION TREND:
– Strength Index Score (3 Year Range Pct):30.577.328.6
– Strength Index Reading (3 Year Range):BearishBullishBearish
NET POSITION MOVEMENT INDEX:
– 6-Week Change in Strength Index:-8.56.99.5


SOYBEAN OIL Futures:

SOYBEAN OIL Futures COT ChartThe SOYBEAN OIL large speculator standing this week was a net position of 57,879 contracts in the data reported through Tuesday. This was a weekly reduction of -2,165 contracts from the previous week which had a total of 60,044 net contracts.

This week’s current strength score (the trader positioning range over the past three years, measured from 0 to 100) shows the speculators are currently Bearish with a score of 42.7 percent. The commercials are Bullish with a score of 57.3 percent and the small traders (not shown in chart) are Bullish with a score of 51.9 percent.

SOYBEAN OIL Futures StatisticsSPECULATORSCOMMERCIALSSMALL TRADERS
– Percent of Open Interest Longs:23.047.98.6
– Percent of Open Interest Shorts:8.265.35.9
– Net Position:57,879-68,18910,310
– Gross Longs:90,140187,78733,605
– Gross Shorts:32,261255,97623,295
– Long to Short Ratio:2.8 to 10.7 to 11.4 to 1
NET POSITION TREND:
– Strength Index Score (3 Year Range Pct):42.757.351.9
– Strength Index Reading (3 Year Range):BearishBullishBullish
NET POSITION MOVEMENT INDEX:
– 6-Week Change in Strength Index:2.7-3.45.8


SOYBEAN MEAL Futures:

SOYBEAN MEAL Futures COT ChartThe SOYBEAN MEAL large speculator standing this week was a net position of 96,601 contracts in the data reported through Tuesday. This was a weekly decline of -9,321 contracts from the previous week which had a total of 105,922 net contracts.

This week’s current strength score (the trader positioning range over the past three years, measured from 0 to 100) shows the speculators are currently Bullish-Extreme with a score of 81.3 percent. The commercials are Bearish with a score of 21.4 percent and the small traders (not shown in chart) are Bearish with a score of 46.0 percent.

SOYBEAN MEAL Futures StatisticsSPECULATORSCOMMERCIALSSMALL TRADERS
– Percent of Open Interest Longs:32.441.313.1
– Percent of Open Interest Shorts:5.674.17.1
– Net Position:96,601-118,42221,821
– Gross Longs:116,691148,71247,271
– Gross Shorts:20,090267,13425,450
– Long to Short Ratio:5.8 to 10.6 to 11.9 to 1
NET POSITION TREND:
– Strength Index Score (3 Year Range Pct):81.321.446.0
– Strength Index Reading (3 Year Range):Bullish-ExtremeBearishBearish
NET POSITION MOVEMENT INDEX:
– 6-Week Change in Strength Index:-10.910.10.9


LIVE CATTLE Futures:

LIVE CATTLE Futures COT ChartThe LIVE CATTLE large speculator standing this week was a net position of 39,665 contracts in the data reported through Tuesday. This was a weekly decline of -3,453 contracts from the previous week which had a total of 43,118 net contracts.

This week’s current strength score (the trader positioning range over the past three years, measured from 0 to 100) shows the speculators are currently Bearish with a score of 29.1 percent. The commercials are Bullish with a score of 58.0 percent and the small traders (not shown in chart) are Bullish-Extreme with a score of 99.5 percent.

LIVE CATTLE Futures StatisticsSPECULATORSCOMMERCIALSSMALL TRADERS
– Percent of Open Interest Longs:33.935.812.8
– Percent of Open Interest Shorts:18.851.212.5
– Net Position:39,665-40,376711
– Gross Longs:89,01694,07633,558
– Gross Shorts:49,351134,45232,847
– Long to Short Ratio:1.8 to 10.7 to 11.0 to 1
NET POSITION TREND:
– Strength Index Score (3 Year Range Pct):29.158.099.5
– Strength Index Reading (3 Year Range):BearishBullishBullish-Extreme
NET POSITION MOVEMENT INDEX:
– 6-Week Change in Strength Index:-25.223.811.1


LEAN HOGS Futures:

LEAN HOGS Futures COT ChartThe LEAN HOGS large speculator standing this week was a net position of 19,141 contracts in the data reported through Tuesday. This was a weekly decrease of -4,461 contracts from the previous week which had a total of 23,602 net contracts.

This week’s current strength score (the trader positioning range over the past three years, measured from 0 to 100) shows the speculators are currently Bearish with a score of 27.6 percent. The commercials are Bullish with a score of 75.9 percent and the small traders (not shown in chart) are Bullish with a score of 74.3 percent.

LEAN HOGS Futures StatisticsSPECULATORSCOMMERCIALSSMALL TRADERS
– Percent of Open Interest Longs:33.638.610.6
– Percent of Open Interest Shorts:23.346.612.9
– Net Position:19,141-14,847-4,294
– Gross Longs:62,55072,02919,735
– Gross Shorts:43,40986,87624,029
– Long to Short Ratio:1.4 to 10.8 to 10.8 to 1
NET POSITION TREND:
– Strength Index Score (3 Year Range Pct):27.675.974.3
– Strength Index Reading (3 Year Range):BearishBullishBullish
NET POSITION MOVEMENT INDEX:
– 6-Week Change in Strength Index:-26.224.318.1


COTTON Futures:

COTTON Futures COT ChartThe COTTON large speculator standing this week was a net position of 35,901 contracts in the data reported through Tuesday. This was a weekly decrease of -1,578 contracts from the previous week which had a total of 37,479 net contracts.

This week’s current strength score (the trader positioning range over the past three years, measured from 0 to 100) shows the speculators are currently Bearish with a score of 37.7 percent. The commercials are Bullish with a score of 63.7 percent and the small traders (not shown in chart) are Bearish with a score of 27.2 percent.

COTTON Futures StatisticsSPECULATORSCOMMERCIALSSMALL TRADERS
– Percent of Open Interest Longs:31.450.35.4
– Percent of Open Interest Shorts:16.066.94.3
– Net Position:35,901-38,5182,617
– Gross Longs:72,940116,85112,517
– Gross Shorts:37,039155,3699,900
– Long to Short Ratio:2.0 to 10.8 to 11.3 to 1
NET POSITION TREND:
– Strength Index Score (3 Year Range Pct):37.763.727.2
– Strength Index Reading (3 Year Range):BearishBullishBearish
NET POSITION MOVEMENT INDEX:
– 6-Week Change in Strength Index:-11.614.3-34.8


COCOA Futures:

COCOA Futures COT ChartThe COCOA large speculator standing this week was a net position of 13,686 contracts in the data reported through Tuesday. This was a weekly increase of 13,522 contracts from the previous week which had a total of 164 net contracts.

This week’s current strength score (the trader positioning range over the past three years, measured from 0 to 100) shows the speculators are currently Bearish with a score of 30.4 percent. The commercials are Bullish with a score of 71.3 percent and the small traders (not shown in chart) are Bearish with a score of 22.9 percent.

COCOA Futures StatisticsSPECULATORSCOMMERCIALSSMALL TRADERS
– Percent of Open Interest Longs:32.943.34.3
– Percent of Open Interest Shorts:28.348.73.5
– Net Position:13,686-16,3302,644
– Gross Longs:98,173129,24812,958
– Gross Shorts:84,487145,57810,314
– Long to Short Ratio:1.2 to 10.9 to 11.3 to 1
NET POSITION TREND:
– Strength Index Score (3 Year Range Pct):30.471.322.9
– Strength Index Reading (3 Year Range):BearishBullishBearish
NET POSITION MOVEMENT INDEX:
– 6-Week Change in Strength Index:5.3-3.3-20.2


WHEAT Futures:

WHEAT Futures COT ChartThe WHEAT large speculator standing this week was a net position of -1,990 contracts in the data reported through Tuesday. This was a weekly lowering of -7,614 contracts from the previous week which had a total of 5,624 net contracts.

This week’s current strength score (the trader positioning range over the past three years, measured from 0 to 100) shows the speculators are currently Bearish-Extreme with a score of 16.5 percent. The commercials are Bullish with a score of 72.0 percent and the small traders (not shown in chart) are Bullish with a score of 75.6 percent.

WHEAT Futures StatisticsSPECULATORSCOMMERCIALSSMALL TRADERS
– Percent of Open Interest Longs:27.640.99.1
– Percent of Open Interest Shorts:28.238.111.3
– Net Position:-1,9908,705-6,715
– Gross Longs:84,943126,06828,094
– Gross Shorts:86,933117,36334,809
– Long to Short Ratio:1.0 to 11.1 to 10.8 to 1
NET POSITION TREND:
– Strength Index Score (3 Year Range Pct):16.572.075.6
– Strength Index Reading (3 Year Range):Bearish-ExtremeBullishBullish
NET POSITION MOVEMENT INDEX:
– 6-Week Change in Strength Index:12.4-8.8-17.1


Article By InvestMacroReceive our weekly COT Newsletter

*COT Report: The COT data, released weekly to the public each Friday, is updated through the most recent Tuesday (data is 3 days old) and shows a quick view of how large speculators or non-commercials (for-profit traders) were positioned in the futures markets.

The CFTC categorizes trader positions according to commercial hedgers (traders who use futures contracts for hedging as part of the business), non-commercials (large traders who speculate to realize trading profits) and nonreportable traders (usually small traders/speculators) as well as their open interest (contracts open in the market at time of reporting). See CFTC criteria here.

Biopharma Co.’s Shares Roll to New 52-Week High Price

Source: Streetwise Reports  (10/12/22)

Shares of DICE Therapeutics Inc. traded 62% higher yesterday and established a new 52-week intraday high after the company reported positive topline data from its Phase 1 DC-806 Psoriasis study.

Biopharmaceutical company DICE Therapeutics Inc. (DICE:NASDAQ), which utilizes its proprietary technology platform to create and develop novel oral therapeutic candidates for use in the treatment of chronic immune and other diseases, yesterday announced “positive topline data from its Phase 1 clinical trial of DC-806, an oral small molecule antagonist of the pro-inflammatory cytokine IL-17.”

The company advised that DC-806 is its leading interleukin-17 (IL-17) antagonist that is being evaluated as a potential treatment for psoriasis. The firm noted that DC-806 has been well tolerated in the Phase 1 trial across all dose groups in healthy volunteers and psoriasis patients with a robust PK profile.

DICE Therapeutics indicated that both high and low doses of DC-806 administered to participants in the study provided clear beneficial pharmacodynamic results on two distinct biomarkers.

DICE shares opened 79% higher yesterday at $44.18 (+$14.265, +57.87%) over last Friday’s $24.65 closing price and reached a new 52-week high price yesterday morning of $45.99.

The company explained that the randomized, double-blind Phase 1 trial was designed to evaluate the safety and pharmacokinetics of DC-806 in healthy volunteers and to serve as the basis for the potential use treatment of psoriasis patients.

The study included overlapping modules that included a Phase 1a single ascending dose, Phase 1b multiple ascending doses, and Phase 1c, which was structured under a proof-of-concept context for use in treating patients with psoriasis.

The firm emphasized that in the clinical proof-of-concept portion of the trial (Phase 1c), “psoriasis patients achieved with a mean percentage reduction in PASI from baseline at four weeks of 43.7% in the high dose group compared to 13.3% in the placebo group.”

DICE Therapeutics advised that the data gathered in the trials provide staunch support for advancing DC-806 as a potential oral agent for treating psoriasis. The firm added that it intends to file an investigational new drug (IND) application with the U.S. Food and Drug Administration (FDA) during H1/23 and stated that it plans to move forward with a dose-ranging Phase 2b clinical trial in patients with moderate-to-severe psoriasis in H1/23.

DICE Therapeutics’ CEO Kevin Judice, Ph.D. stated, “We are extremely excited by the overall clinical profile of DC-806 and clear proof-of-concept in psoriasis in this Phase 1 clinical trial, which we believe is the first-ever clinical demonstration of direct inhibition of a cytokine with a small molecule.”
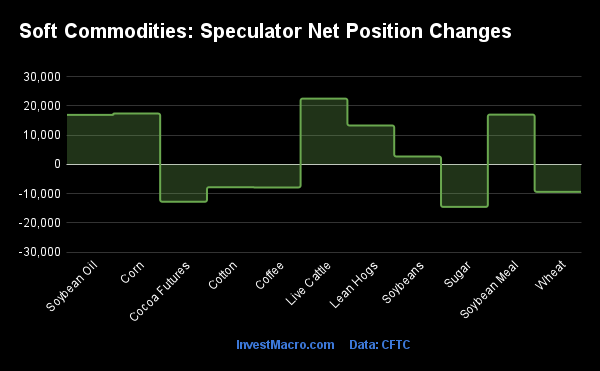
Judice continued, “We believe these data not only support further development of DC-806 as a potential best-in-class oral therapy for psoriasis, but also may unlock additional IL-17-mediated disease indications given DC-806’s excellent safety profile, strong PK data, and robust dose-dependent target engagement.”

The company’s Chief Medical Officer, Tim Lu, M.D., Ph.D., remarked, “Based on the Phase 1 clinical trial, we believe DC-806 has the potential to be the best-in-class oral therapeutic agent for patients with psoriasis…Data from this Phase 1 clinical trial provides early evidence for the potential differentiation of DC-806 on efficacy, safety, and ease of use. We look forward to advancing DC-806 into a Phase 2b clinical trial to optimize dosing and further explore peak efficacy with a longer duration of treatment.”

DICE listed that “it is developing orally-available, small molecule antagonists of the pro-inflammatory signaling molecule IL-17, an immune cell-derived cytokine that is produced in response to infection by certain microorganisms.”
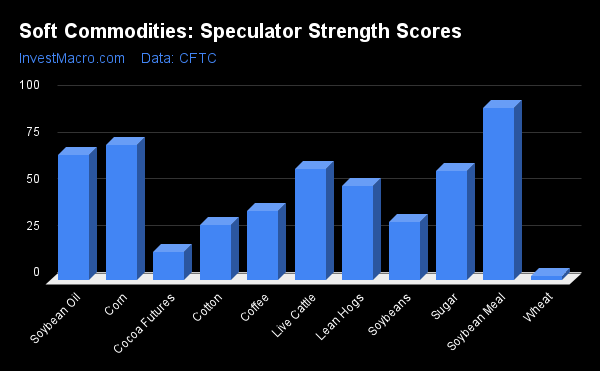
The company stated in the report that there is no cure for psoriasis, which “manifests as erythematous plaques with thick scaling that can occur anywhere on the body.” The disease causes symptoms that typically include itchiness, pain, and bleeding from scratching, which often results in scarring and disfiguration. The firm stated that according to the National Psoriasis Association, psoriasis affects about 125 million people globally.
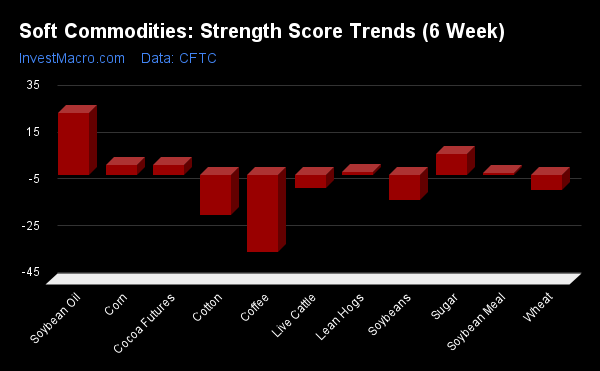
DICE Therapeutics is a clinical-stage biopharma company based in South San Francisco, Calif., that focuses on developing and advancing new medicines for treating chronic autoimmune and inflammatory diseases.

The firm uses its proprietary DELSCAPE platform to build a pipeline of novel oral therapeutics to address well-validated targets in immunology that match or exceed the potency of their systemic biologic counterparts. The DELSCAPE platform can identify and discover selective oral small molecules that demonstrate potential for modulating protein-protein interactions (PPIs) that are equal to or better than systemic biologics.

DICE Therapeutics started off yesterday with a market cap of around $941.9 million, with approximately 38.21 million shares outstanding and a short interest of about 12.9%. DICE shares opened 79% higher yesterday at $44.18 (+$14.265, +57.87%) over last Friday’s $24.65 closing price and reached a new 52-week high price yesterday morning of $45.99. The stock traded between $36.56 and $45.99 per share and closed for trading at $40.00 (+$15.35, +62.27%).

Disclosures:
1) Stephen Hytha wrote this article for Streetwise Reports LLC and provides services to Streetwise Reports as an independent contractor. He or members of his household own securities of the following companies mentioned in the article: None. He or members of his household are paid by the following companies mentioned in this article: None.

2) The following companies mentioned in this article are billboard sponsors of Streetwise Reports: None. Click here for important disclosures about sponsor fees.

3) Comments and opinions expressed are those of the specific experts and not of Streetwise Reports or its officers. The information provided above is for informational purposes only and is not a recommendation to buy or sell any security.

4) The article does not constitute investment advice. Each reader is encouraged to consult with his or her individual financial professional and any action a reader takes as a result of information presented here is his or her own responsibility. By opening this page, each reader accepts and agrees to Streetwise Reports’ terms of use and full legal disclaimer. This article is not a solicitation for investment. Streetwise Reports does not render general or specific investment advice and the information on Streetwise Reports should not be considered a recommendation to buy or sell any security. Streetwise Reports does not endorse or recommend the business, products, services or securities of any company mentioned on Streetwise Reports.

5) From time to time, Streetwise Reports LLC and its directors, officers, employees or members of their families, as well as persons interviewed for articles and interviews on the site, may have a long or short position in securities mentioned. Directors, officers, employees or members of their immediate families are prohibited from making purchases and/or sales of those securities in the open market or otherwise from the time of the decision to publish an article until three business days after the publication of the article. The foregoing prohibition does not apply to articles that in substance only restate previously published company releases.

6) This article does not constitute medical advice. Officers, employees and contributors to Streetwise Reports are not licensed medical professionals. Readers should always contact their healthcare professionals for medical advice.