By Robert Lempert, Pardee RAND Graduate School and Elisabeth Gilmore, Carleton University
It’s easy to feel pessimistic when scientists around the world are warning that climate change has advanced so far, it’s now inevitable that societies will either transform themselves or be transformed. But as two of the authors of a recent international climate report, we also see reason for optimism.
The latest reports from the Intergovernmental Panel on Climate Change, including the synthesis report released March 20, 2023, discuss changes ahead, but they also describe how existing solutions can reduce greenhouse gas emissions and help people adjust to impacts of climate change that can’t be avoided.
The problem is that these solutions aren’t being deployed fast enough. In addition to pushback from industries, people’s fear of change has helped maintain the status quo.
To slow climate change and adapt to the damage already underway, the world will have to shift how it generates and uses energy, transports people and goods, designs buildings and grows food. That starts with embracing innovation and change.
Fear of change can lead to worsening change
From the industrial revolution to the rise of social media, societies have undergone fundamental changes in how people live and understand their place in the world.
Some transformations are widely regarded as bad, including many of those connected to climate change. For example, about half the world’s coral reef ecosystems have died because of increasing heat and acidity in the oceans. Island nations like Kiribati and coastal communities, including in Louisiana and Alaska, are losing land into rising seas.
Other transformations have had both good and bad effects. The industrial revolution vastly raised standards of living for many people, but it spawned inequality, social disruption and environmental destruction.
People often resist transformation because their fear of losing what they have is more powerful than knowing they might gain something better. Wanting to retain things as they are – known as status quo bias – explains all sorts of individual decisions, from sticking with incumbent politicians to not enrolling in retirement or health plans even when the alternatives may be rationally better.
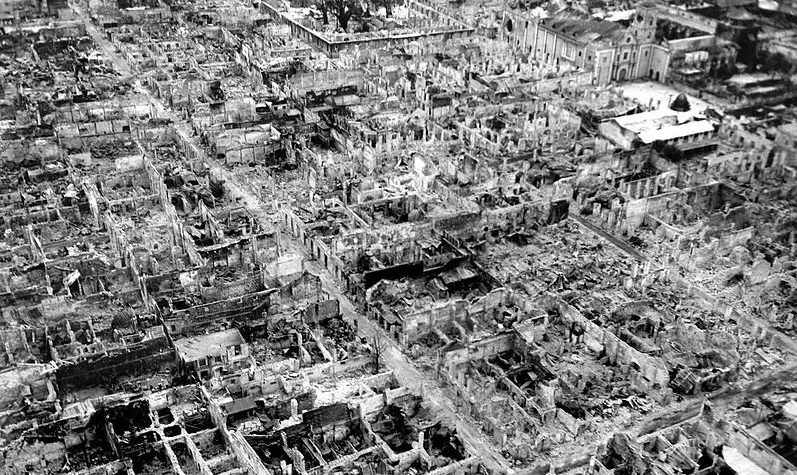
This effect may be even more pronounced for larger changes. In the past, delaying inevitable change has led to transformations that are unnecessarily harsh, such as the collapse of some 13th-century civilizations in what is now the U.S. Southwest. As more people experience the harms of climate change firsthand, they may begin to realize that transformation is inevitable and embrace new solutions.
A mix of good and bad
The IPCC reports make clear that the future inevitably involves more and larger climate-related transformations. The question is what the mix of good and bad will be in those transformations.
If countries allow greenhouse gas emissions to continue at a high rate and communities adapt only incrementally to the resulting climate change, the transformations will be mostly forced and mostly bad.
For example, a riverside town might raise its levees as spring flooding worsens. At some point, as the scale of flooding increases, such adaptation hits its limits. The levees necessary to hold back the water may become too expensive or so intrusive that they undermine any benefit of living near the river. The community may wither away.
The riverside community could also take a more deliberate and anticipatory approach to transformation. It might shift to higher ground, turn its riverfront into parkland while developing affordable housing for people who are displaced by the project, and collaborate with upstream communities to expand landscapes that capture floodwaters. Simultaneously, the community can shift to renewable energy and electrified transportation to help slow global warming.
Optimism resides in deliberate action
The IPCC reports include numerous examples that can help steer such positive transformation.
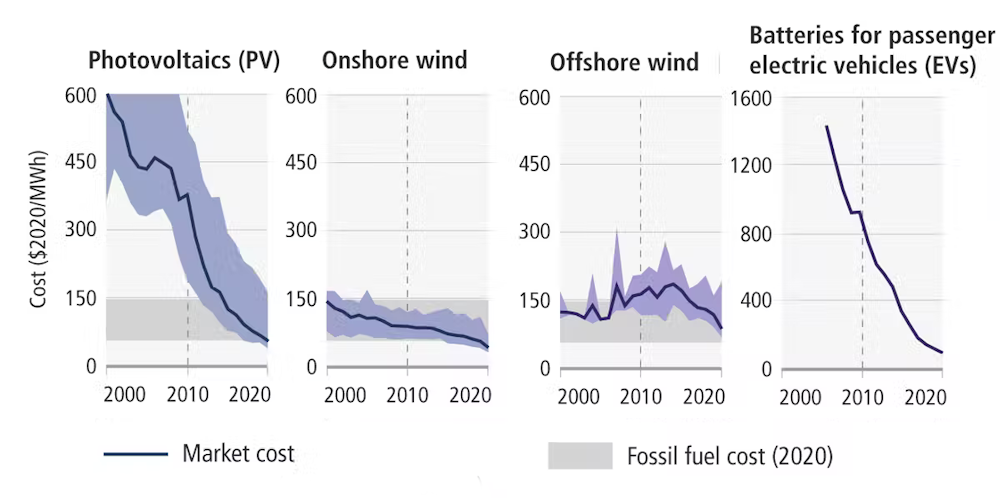
For example, renewable energy is now generally less expensive than fossil fuels, so a shift to clean energy can often save money. Communities can also be redesigned to better survive natural hazards through steps such as maintaining natural wildfire breaks and building homes to be less susceptible to burning.
IPCC sixth assessment report
Land use and the design of infrastructure, such as roads and bridges, can be based on forward-looking climate information. Insurance pricing and corporate climate risk disclosures can help the public recognize hazards in the products they buy and companies they support as investors.
No one group can enact these changes alone. Everyone must be involved, including governments that can mandate and incentivize changes, businesses that often control decisions about greenhouse gas emissions, and citizens who can turn up the pressure on both.
Transformation is inevitable
Efforts to both adapt to and mitigate climate change have advanced substantially in the last five years, but not fast enough to prevent the transformations already underway.
Doing more to disrupt the status quo with proven solutions can help smooth these transformations and create a better future in the process.
Editor’s note: This is an update to an article originally published April 18, 2022.![]()
About the Author:
Robert Lempert, Professor of Policy Analysis, Pardee RAND Graduate School and Elisabeth Gilmore, Associate Professor of Climate Change, Technology and Policy, Carleton University
This article is republished from The Conversation under a Creative Commons license. Read the original article.