By InvestMacro
Here are the latest charts and statistics for the Commitment of Traders (COT) data published by the Commodities Futures Trading Commission (CFTC).
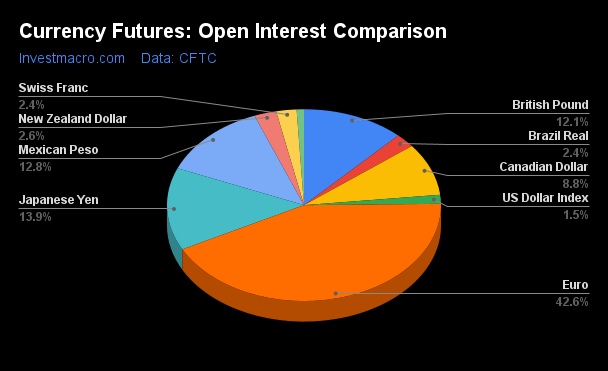
The latest COT data is updated through Tuesday August 15th and shows a quick view of how large market participants (for-profit speculators and commercial traders) were positioned in the futures markets. All currency positions are in direct relation to the US dollar where, for example, a bet for the euro is a bet that the euro will rise versus the dollar while a bet against the euro will be a bet that the euro will decline versus the dollar.
Weekly Speculator Changes led by EuroFX & British Pound
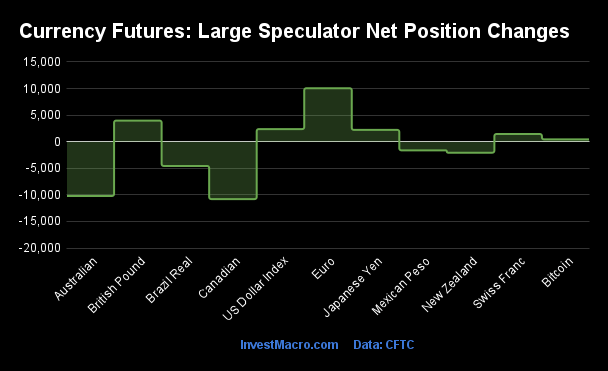
The COT currency market speculator bets were higher this week as six out of the eleven currency markets we cover had higher positioning while the other five markets had lower speculator contracts.
Leading the gains for the currency markets was the EuroFX (10,052 contracts) with the British Pound (3,968 contracts), US Dollar Index (2,367 contracts), Japanese Yen (2,219 contracts), the Swiss Franc (1,445 contracts) and Bitcoin (437 contracts) also recording positive weeks.
The currencies seeing declines in speculator bets on the week were the Canadian Dollar (-10,788 contracts) with the Australian Dollar (-10,205 contracts), the Brazilian Real (-4,564 contracts), New Zealand Dollar (-2,068 contracts) and the Mexican Peso (-1,628 contracts) also registering lower bets on the week.
British Pound Sterling Speculator Bets rebound this week
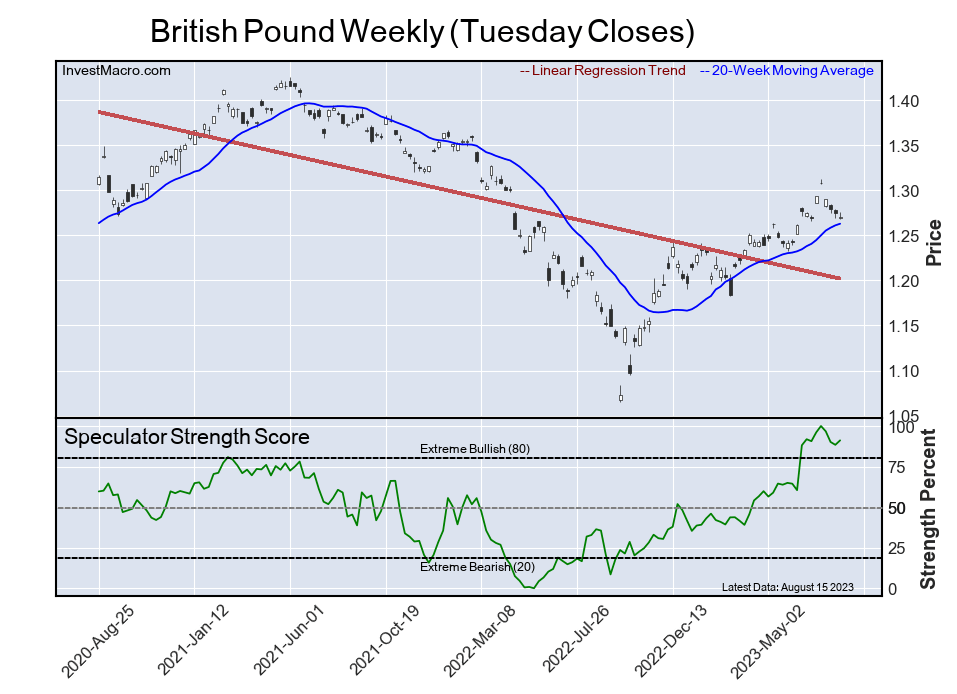
Highlighting the COT currency’s data is this week’s rebound and the overall strength in the speculator’s positioning of the British Pound Sterling. Large speculative Sterling positions rose this week by almost +4,000 contracts and turned around a three-week streak of declines.
The Sterling speculative level has been on the move higher recently and is at its strongest levels in years with the average contract level of the past ten weeks right around +50,000 contracts. On July 18th, the bullish bets for the Sterling (+63,729 contracts) ascended to the highest level since July 31st of 2007, a span of almost exactly sixteen years.
The Pound’s positioning has been helped out by continued high inflation in the United Kingdom which brings forecasts for higher interest rates. The UK consumer inflation numbers for July came in at 6.8 percent with a core inflation reading of 6.9 percent. The Bank of England has boosted the interest rate to combat inflation for fourteen consecutive meetings and brought the rate to 5.25 percent at it’s last meeting which is the highest since 2008. The BOE may need to further push the rate higher to bring inflation back down to reasonable levels which in turn can provide the UK currency with an interest rate differential advantage against other currencies.
The Pound Sterling exchange rate against the US Dollar has been in an uptrend over recent months with the exchange rate hitting over 1.3000 in July. Since that 2023 high, the Sterling has cooled off some but remains over the psychologically significant 1.2500 exchange rate.
| Aug-15-2023 | OI | OI-Index | Spec-Net | Spec-Index | Com-Net | COM-Index | Smalls-Net | Smalls-Index |
|---|
| USD Index | 26,954 | 1 | 4,991 | 33 | -6,048 | 66 | 1,057 | 23 |
| EUR | 760,233 | 69 | 159,863 | 80 | -205,284 | 21 | 45,421 | 51 |
| GBP | 215,340 | 46 | 50,988 | 91 | -60,188 | 12 | 9,200 | 76 |
| JPY | 247,954 | 75 | -80,961 | 22 | 90,497 | 80 | -9,536 | 34 |
| CHF | 42,794 | 45 | -4,007 | 46 | 4,200 | 49 | -193 | 57 |
| CAD | 157,827 | 32 | -11,411 | 44 | 13,769 | 66 | -2,358 | 18 |
| AUD | 204,458 | 91 | -53,397 | 35 | 65,258 | 68 | -11,861 | 24 |
| NZD | 46,781 | 53 | -2,436 | 47 | 4,969 | 58 | -2,533 | 20 |
| MXN | 228,984 | 48 | 82,023 | 89 | -85,227 | 11 | 3,204 | 32 |
| RUB | 20,930 | 4 | 7,543 | 31 | -7,150 | 69 | -393 | 24 |
| BRL | 42,031 | 28 | 23,475 | 66 | -25,216 | 34 | 1,741 | 58 |
| Bitcoin | 15,432 | 73 | -712 | 65 | 14 | 0 | 698 | 29 |
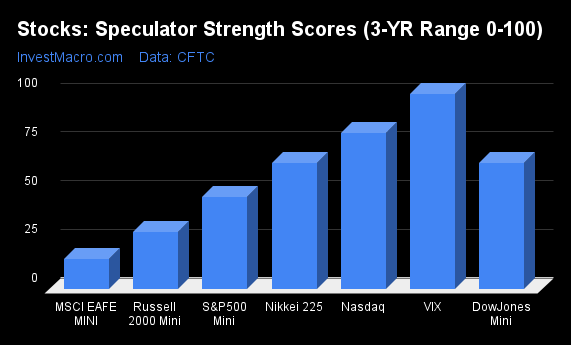
Strength Scores led by British Pound & Mexican Peso
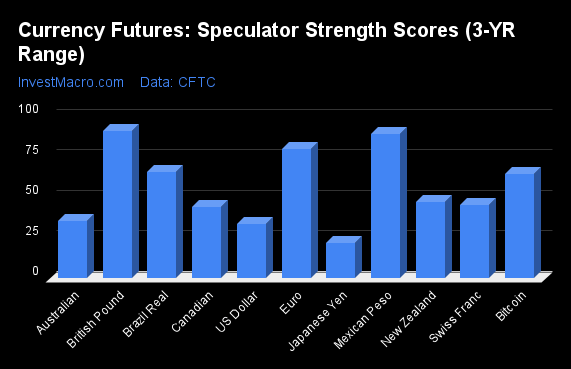
COT Strength Scores (a normalized measure of Speculator positions over a 3-Year range, from 0 to 100 where above 80 is Extreme-Bullish and below 20 is Extreme-Bearish) showed that the British Pound (91 percent), the Mexican Peso (89 percent) and the EuroFX (80 percent) lead the currency markets this week. The Brazilian Real (66 percent) and Bitcoin (65 percent) come in as the next highest in the weekly strength scores.
On the downside, the Japanese Yen (22 percent) and the US Dollar Index (33 percent) come in at the lowest strength levels currently. The next lowest strength scores are the Australian Dollar (35 percent) and the Canadian Dollar (44 percent).
Strength Statistics:
US Dollar Index (33.3 percent) vs US Dollar Index previous week (29.3 percent)
EuroFX (80.0 percent) vs EuroFX previous week (76.1 percent)
British Pound Sterling (91.2 percent) vs British Pound Sterling previous week (88.4 percent)
Japanese Yen (21.9 percent) vs Japanese Yen previous week (20.6 percent)
Swiss Franc (45.5 percent) vs Swiss Franc previous week (41.6 percent)
Canadian Dollar (43.9 percent) vs Canadian Dollar previous week (54.0 percent)
Australian Dollar (35.3 percent) vs Australian Dollar previous week (44.8 percent)
New Zealand Dollar (47.0 percent) vs New Zealand Dollar previous week (52.6 percent)
Mexican Peso (89.2 percent) vs Mexican Peso previous week (90.2 percent)
Brazilian Real (65.6 percent) vs Brazilian Real previous week (71.4 percent)
Bitcoin (64.5 percent) vs Bitcoin previous week (56.9 percent)
Bitcoin & Japanese Yen top the 6-Week Strength Trends
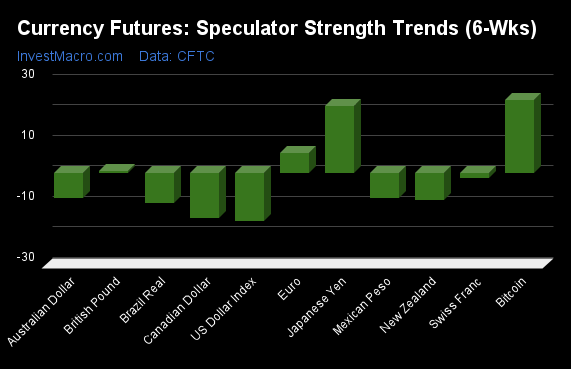
COT Strength Score Trends (or move index, calculates the 6-week changes in strength scores) showed that Bitcoin (24 percent) and the Japanese Yen (22 percent) lead the past six weeks trends for the currencies. The EuroFX (7 percent) and the British Pound (1 percent) are the next highest positive movers in the latest trends data.
The US Dollar Index (-16 percent) leads the downside trend scores currently with the Canadian Dollar (-15 percent), Brazilian Real (-10 percent) and the New Zealand Dollar (-9 percent) following next with lower trend scores.
Strength Trend Statistics:
US Dollar Index (-15.6 percent) vs US Dollar Index previous week (-20.6 percent)
EuroFX (6.6 percent) vs EuroFX previous week (1.8 percent)
British Pound Sterling (0.5 percent) vs British Pound Sterling previous week (-3.5 percent)
Japanese Yen (21.9 percent) vs Japanese Yen previous week (17.6 percent)
Swiss Franc (-1.6 percent) vs Swiss Franc previous week (-1.4 percent)
Canadian Dollar (-14.9 percent) vs Canadian Dollar previous week (2.1 percent)
Australian Dollar (-8.2 percent) vs Australian Dollar previous week (-3.5 percent)
New Zealand Dollar (-8.9 percent) vs New Zealand Dollar previous week (1.3 percent)
Mexican Peso (-8.1 percent) vs Mexican Peso previous week (-7.8 percent)
Brazilian Real (-9.7 percent) vs Brazilian Real previous week (-4.5 percent)
Bitcoin (23.8 percent) vs Bitcoin previous week (16.5 percent)
Individual COT Forex Markets:
US Dollar Index Futures:
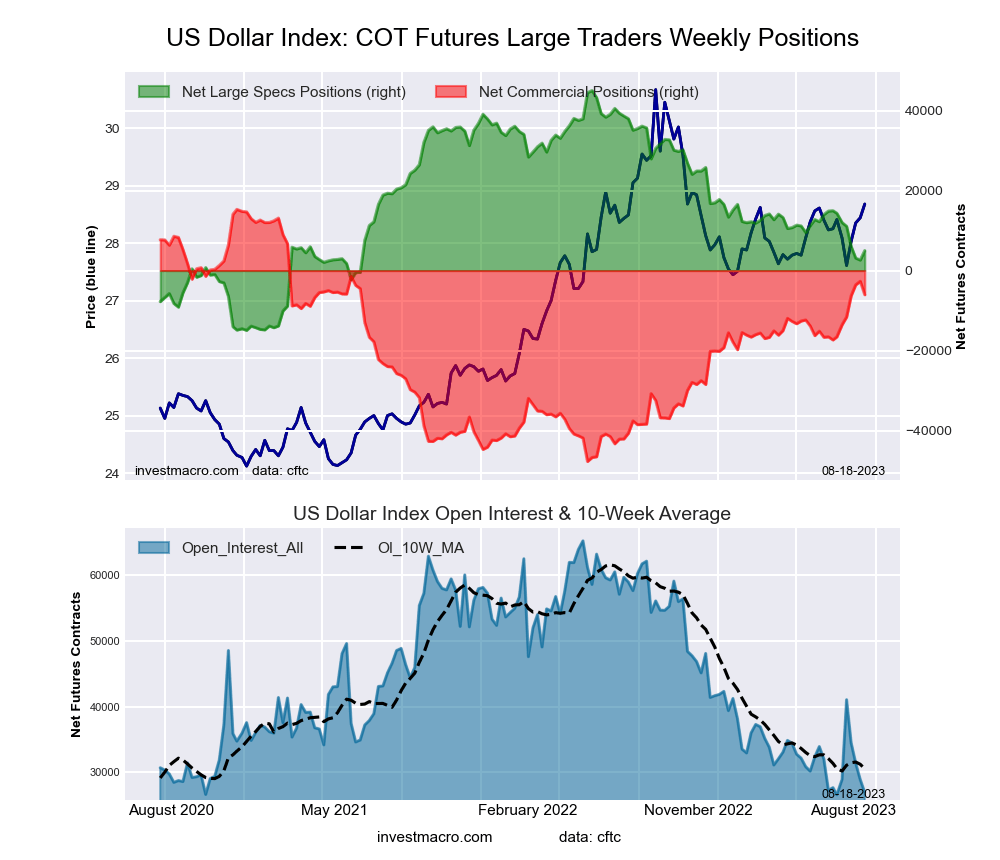 The US Dollar Index large speculator standing this week totaled a net position of 4,991 contracts in the data reported through Tuesday. This was a weekly boost of 2,367 contracts from the previous week which had a total of 2,624 net contracts.
This week’s current strength score (the trader positioning range over the past three years, measured from 0 to 100) shows the speculators are currently Bearish with a score of 33.3 percent. The commercials are Bullish with a score of 66.1 percent and the small traders (not shown in chart) are Bearish with a score of 23.0 percent.
Price Trend-Following Model: Strong Uptrend
Our weekly trend-following model classifies the current market price position as: Strong Uptrend. The current action for the model is considered to be: Hold – Maintain Long Position.
| US DOLLAR INDEX Statistics | SPECULATORS | COMMERCIALS | SMALL TRADERS |
| – Percent of Open Interest Longs: | 72.8 | 5.8 | 16.3 |
| – Percent of Open Interest Shorts: | 54.3 | 28.2 | 12.4 |
| – Net Position: | 4,991 | -6,048 | 1,057 |
| – Gross Longs: | 19,617 | 1,556 | 4,404 |
| – Gross Shorts: | 14,626 | 7,604 | 3,347 |
| – Long to Short Ratio: | 1.3 to 1 | 0.2 to 1 | 1.3 to 1 |
| NET POSITION TREND: | | | |
| – Strength Index Score (3 Year Range Pct): | 33.3 | 66.1 | 23.0 |
| – Strength Index Reading (3 Year Range): | Bearish | Bullish | Bearish |
| NET POSITION MOVEMENT INDEX: | | | |
| – 6-Week Change in Strength Index: | -15.6 | 16.7 | -14.1 |
Euro Currency Futures:
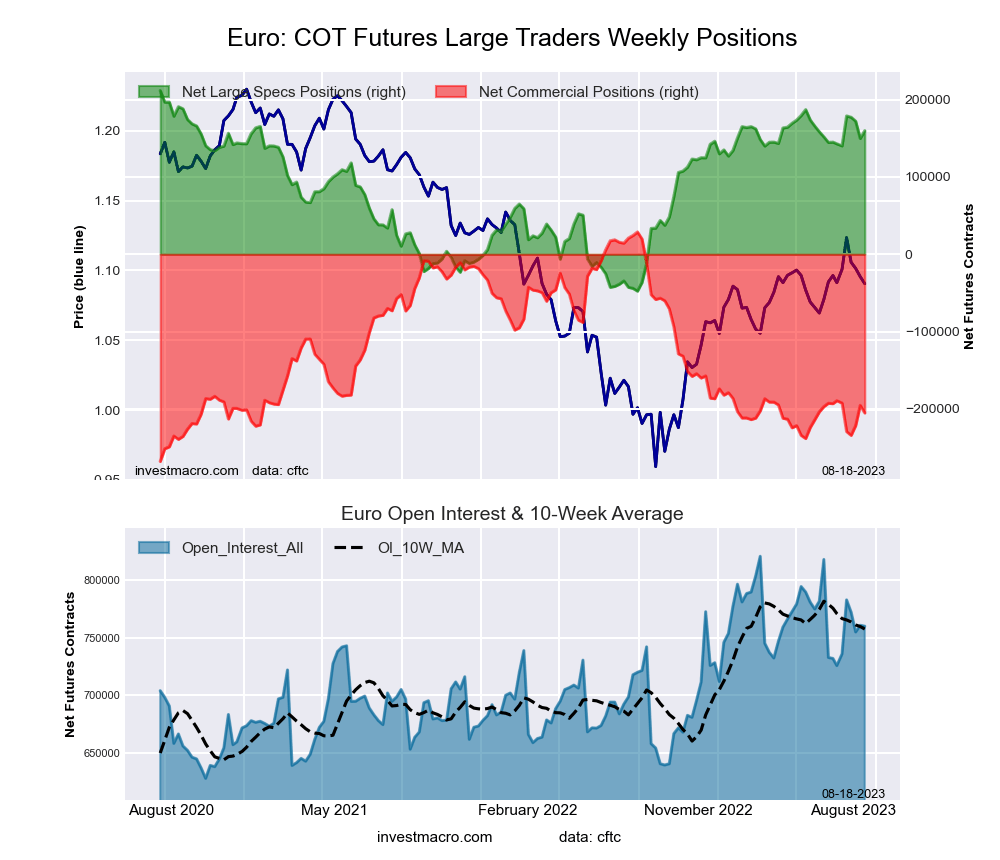 The Euro Currency large speculator standing this week totaled a net position of 159,863 contracts in the data reported through Tuesday. This was a weekly lift of 10,052 contracts from the previous week which had a total of 149,811 net contracts.
This week’s current strength score (the trader positioning range over the past three years, measured from 0 to 100) shows the speculators are currently Bullish with a score of 80.0 percent. The commercials are Bearish with a score of 21.1 percent and the small traders (not shown in chart) are Bullish with a score of 51.4 percent.
Price Trend-Following Model: Weak Uptrend
Our weekly trend-following model classifies the current market price position as: Weak Uptrend. The current action for the model is considered to be: Hold – Maintain Long Position.
| EURO Currency Statistics | SPECULATORS | COMMERCIALS | SMALL TRADERS |
| – Percent of Open Interest Longs: | 30.6 | 55.4 | 12.0 |
| – Percent of Open Interest Shorts: | 9.6 | 82.4 | 6.0 |
| – Net Position: | 159,863 | -205,284 | 45,421 |
| – Gross Longs: | 232,466 | 420,942 | 90,895 |
| – Gross Shorts: | 72,603 | 626,226 | 45,474 |
| – Long to Short Ratio: | 3.2 to 1 | 0.7 to 1 | 2.0 to 1 |
| NET POSITION TREND: | | | |
| – Strength Index Score (3 Year Range Pct): | 80.0 | 21.1 | 51.4 |
| – Strength Index Reading (3 Year Range): | Bullish | Bearish | Bullish |
| NET POSITION MOVEMENT INDEX: | | | |
| – 6-Week Change in Strength Index: | 6.6 | -5.3 | -1.9 |
British Pound Sterling Futures:
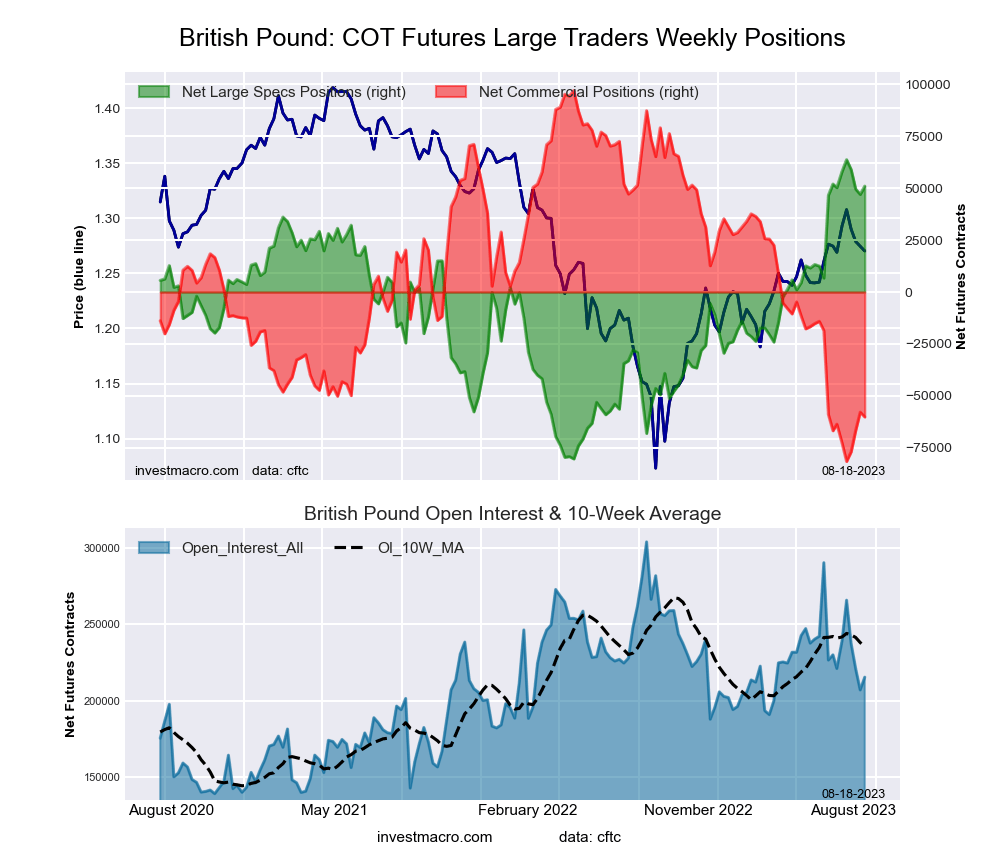 The British Pound Sterling large speculator standing this week totaled a net position of 50,988 contracts in the data reported through Tuesday. This was a weekly advance of 3,968 contracts from the previous week which had a total of 47,020 net contracts.
This week’s current strength score (the trader positioning range over the past three years, measured from 0 to 100) shows the speculators are currently Bullish-Extreme with a score of 91.2 percent. The commercials are Bearish-Extreme with a score of 12.0 percent and the small traders (not shown in chart) are Bullish with a score of 76.1 percent.
Price Trend-Following Model: Uptrend
Our weekly trend-following model classifies the current market price position as: Uptrend. The current action for the model is considered to be: Hold – Maintain Long Position.
| BRITISH POUND Statistics | SPECULATORS | COMMERCIALS | SMALL TRADERS |
| – Percent of Open Interest Longs: | 42.0 | 36.0 | 16.1 |
| – Percent of Open Interest Shorts: | 18.4 | 63.9 | 11.8 |
| – Net Position: | 50,988 | -60,188 | 9,200 |
| – Gross Longs: | 90,541 | 77,496 | 34,690 |
| – Gross Shorts: | 39,553 | 137,684 | 25,490 |
| – Long to Short Ratio: | 2.3 to 1 | 0.6 to 1 | 1.4 to 1 |
| NET POSITION TREND: | | | |
| – Strength Index Score (3 Year Range Pct): | 91.2 | 12.0 | 76.1 |
| – Strength Index Reading (3 Year Range): | Bullish-Extreme | Bearish-Extreme | Bullish |
| NET POSITION MOVEMENT INDEX: | | | |
| – 6-Week Change in Strength Index: | 0.5 | 1.9 | -8.2 |
Japanese Yen Futures:
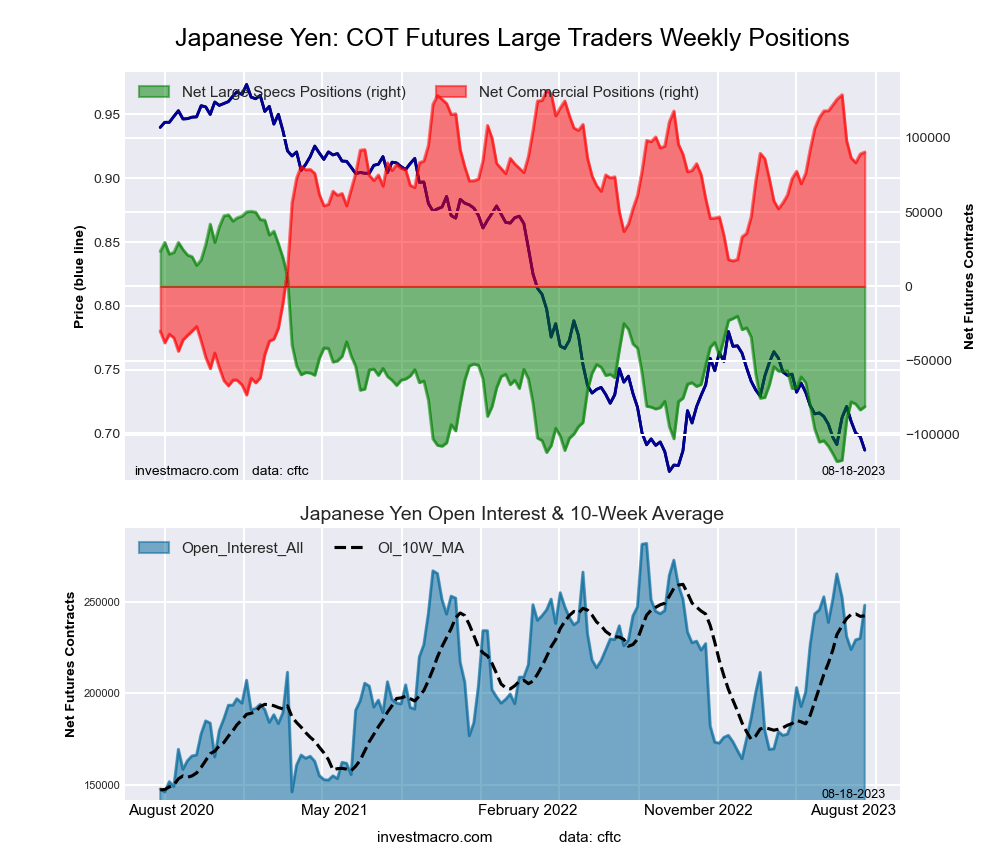 The Japanese Yen large speculator standing this week totaled a net position of -80,961 contracts in the data reported through Tuesday. This was a weekly boost of 2,219 contracts from the previous week which had a total of -83,180 net contracts.
This week’s current strength score (the trader positioning range over the past three years, measured from 0 to 100) shows the speculators are currently Bearish with a score of 21.9 percent. The commercials are Bullish with a score of 79.8 percent and the small traders (not shown in chart) are Bearish with a score of 34.1 percent.
Price Trend-Following Model: Downtrend
Our weekly trend-following model classifies the current market price position as: Downtrend. The current action for the model is considered to be: Hold – Maintain Short Position.
| JAPANESE YEN Statistics | SPECULATORS | COMMERCIALS | SMALL TRADERS |
| – Percent of Open Interest Longs: | 14.0 | 70.8 | 13.8 |
| – Percent of Open Interest Shorts: | 46.7 | 34.3 | 17.6 |
| – Net Position: | -80,961 | 90,497 | -9,536 |
| – Gross Longs: | 34,789 | 175,636 | 34,192 |
| – Gross Shorts: | 115,750 | 85,139 | 43,728 |
| – Long to Short Ratio: | 0.3 to 1 | 2.1 to 1 | 0.8 to 1 |
| NET POSITION TREND: | | | |
| – Strength Index Score (3 Year Range Pct): | 21.9 | 79.8 | 34.1 |
| – Strength Index Reading (3 Year Range): | Bearish | Bullish | Bearish |
| NET POSITION MOVEMENT INDEX: | | | |
| – 6-Week Change in Strength Index: | 21.9 | -17.3 | -2.9 |
Swiss Franc Futures:
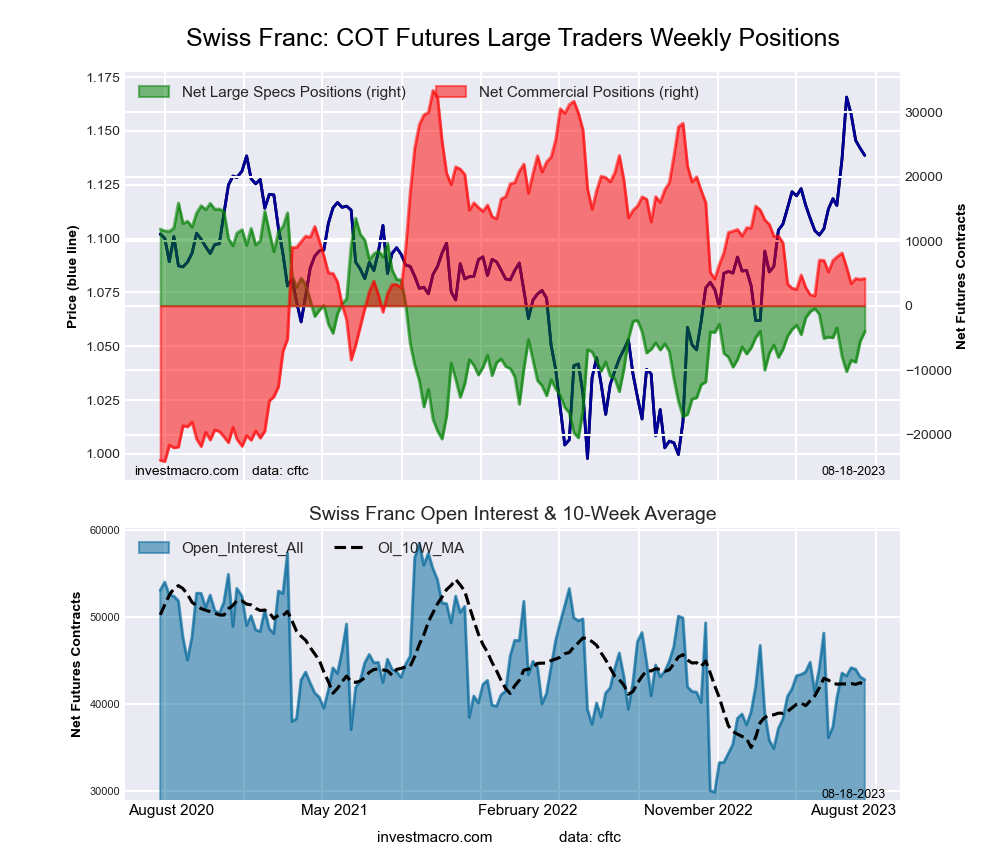 The Swiss Franc large speculator standing this week totaled a net position of -4,007 contracts in the data reported through Tuesday. This was a weekly gain of 1,445 contracts from the previous week which had a total of -5,452 net contracts.
This week’s current strength score (the trader positioning range over the past three years, measured from 0 to 100) shows the speculators are currently Bearish with a score of 45.5 percent. The commercials are Bearish with a score of 49.3 percent and the small traders (not shown in chart) are Bullish with a score of 56.9 percent.
Price Trend-Following Model: Uptrend
Our weekly trend-following model classifies the current market price position as: Uptrend. The current action for the model is considered to be: Hold – Maintain Long Position.
| SWISS FRANC Statistics | SPECULATORS | COMMERCIALS | SMALL TRADERS |
| – Percent of Open Interest Longs: | 20.3 | 44.0 | 35.7 |
| – Percent of Open Interest Shorts: | 29.7 | 34.1 | 36.1 |
| – Net Position: | -4,007 | 4,200 | -193 |
| – Gross Longs: | 8,693 | 18,812 | 15,262 |
| – Gross Shorts: | 12,700 | 14,612 | 15,455 |
| – Long to Short Ratio: | 0.7 to 1 | 1.3 to 1 | 1.0 to 1 |
| NET POSITION TREND: | | | |
| – Strength Index Score (3 Year Range Pct): | 45.5 | 49.3 | 56.9 |
| – Strength Index Reading (3 Year Range): | Bearish | Bearish | Bullish |
| NET POSITION MOVEMENT INDEX: | | | |
| – 6-Week Change in Strength Index: | -1.6 | -5.9 | 13.4 |
Canadian Dollar Futures:
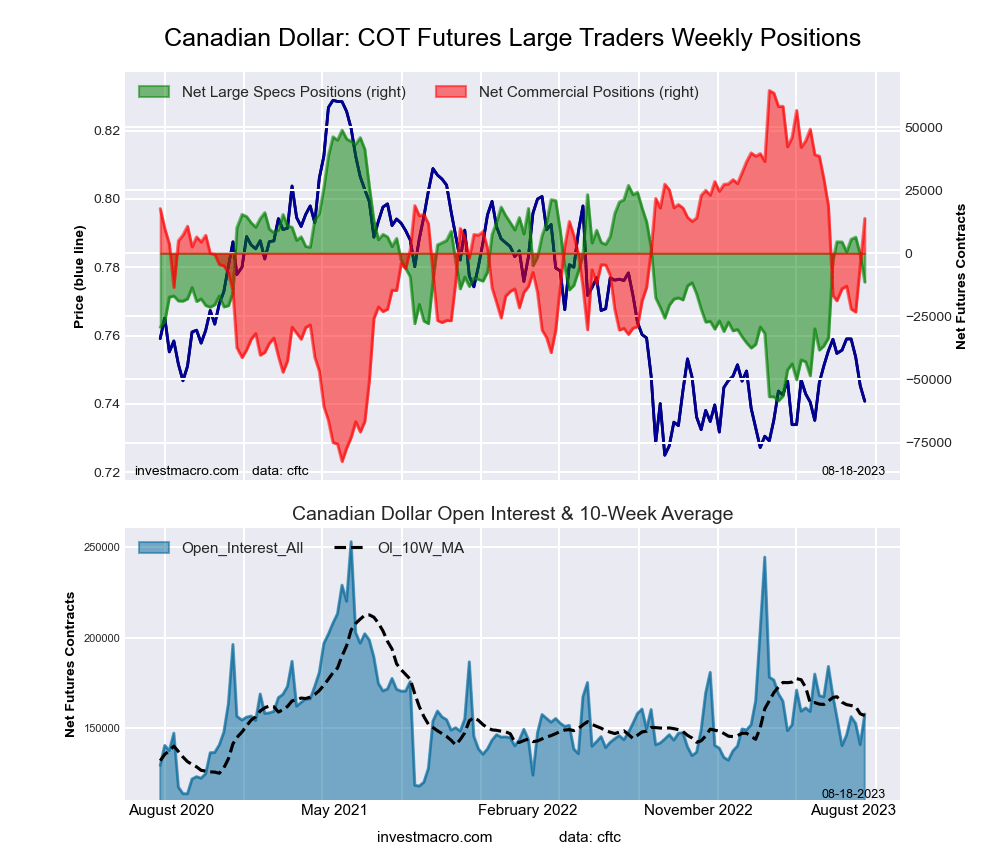 The Canadian Dollar large speculator standing this week totaled a net position of -11,411 contracts in the data reported through Tuesday. This was a weekly fall of -10,788 contracts from the previous week which had a total of -623 net contracts.
This week’s current strength score (the trader positioning range over the past three years, measured from 0 to 100) shows the speculators are currently Bearish with a score of 43.9 percent. The commercials are Bullish with a score of 65.5 percent and the small traders (not shown in chart) are Bearish-Extreme with a score of 17.6 percent.
Price Trend-Following Model: Weak Uptrend
Our weekly trend-following model classifies the current market price position as: Weak Uptrend. The current action for the model is considered to be: Hold – Maintain Long Position.
| CANADIAN DOLLAR Statistics | SPECULATORS | COMMERCIALS | SMALL TRADERS |
| – Percent of Open Interest Longs: | 23.5 | 54.3 | 19.3 |
| – Percent of Open Interest Shorts: | 30.7 | 45.6 | 20.8 |
| – Net Position: | -11,411 | 13,769 | -2,358 |
| – Gross Longs: | 37,112 | 85,774 | 30,496 |
| – Gross Shorts: | 48,523 | 72,005 | 32,854 |
| – Long to Short Ratio: | 0.8 to 1 | 1.2 to 1 | 0.9 to 1 |
| NET POSITION TREND: | | | |
| – Strength Index Score (3 Year Range Pct): | 43.9 | 65.5 | 17.6 |
| – Strength Index Reading (3 Year Range): | Bearish | Bullish | Bearish-Extreme |
| NET POSITION MOVEMENT INDEX: | | | |
| – 6-Week Change in Strength Index: | -14.9 | 22.2 | -37.0 |
Australian Dollar Futures:
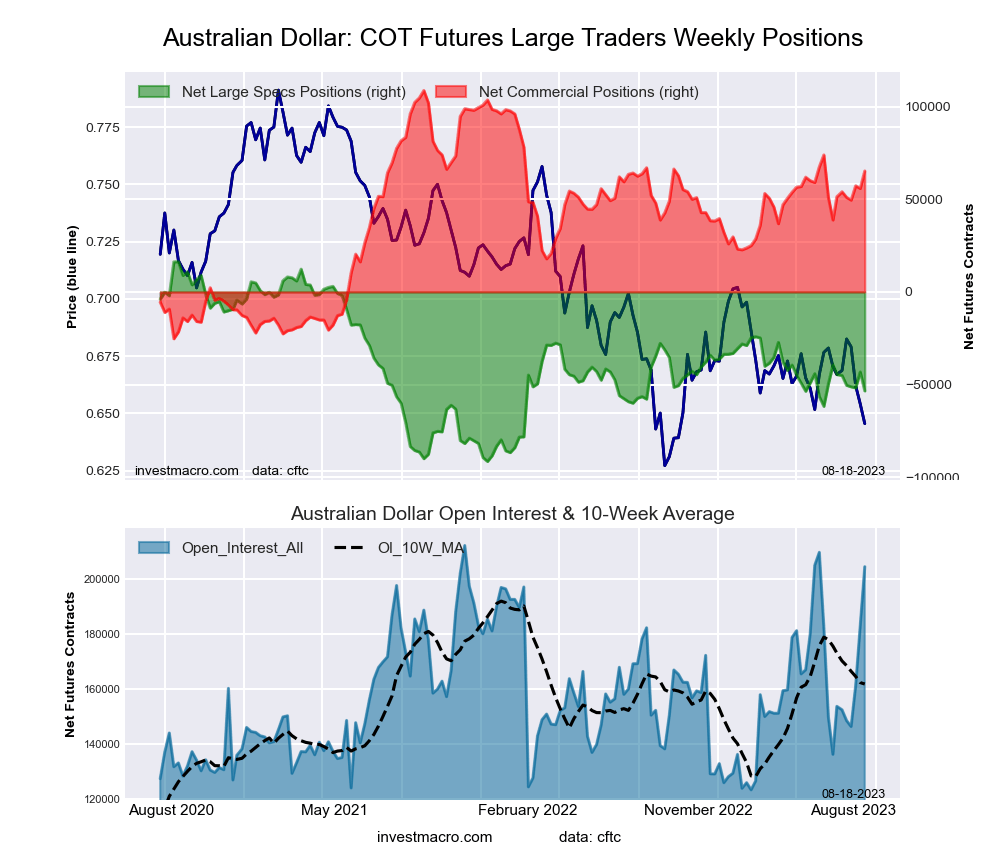 The Australian Dollar large speculator standing this week totaled a net position of -53,397 contracts in the data reported through Tuesday. This was a weekly fall of -10,205 contracts from the previous week which had a total of -43,192 net contracts.
This week’s current strength score (the trader positioning range over the past three years, measured from 0 to 100) shows the speculators are currently Bearish with a score of 35.3 percent. The commercials are Bullish with a score of 67.6 percent and the small traders (not shown in chart) are Bearish with a score of 23.5 percent.
Price Trend-Following Model: Strong Downtrend
Our weekly trend-following model classifies the current market price position as: Strong Downtrend. The current action for the model is considered to be: Hold – Maintain Short Position.
| AUSTRALIAN DOLLAR Statistics | SPECULATORS | COMMERCIALS | SMALL TRADERS |
| – Percent of Open Interest Longs: | 33.6 | 53.4 | 10.0 |
| – Percent of Open Interest Shorts: | 59.7 | 21.4 | 15.8 |
| – Net Position: | -53,397 | 65,258 | -11,861 |
| – Gross Longs: | 68,623 | 109,110 | 20,392 |
| – Gross Shorts: | 122,020 | 43,852 | 32,253 |
| – Long to Short Ratio: | 0.6 to 1 | 2.5 to 1 | 0.6 to 1 |
| NET POSITION TREND: | | | |
| – Strength Index Score (3 Year Range Pct): | 35.3 | 67.6 | 23.5 |
| – Strength Index Reading (3 Year Range): | Bearish | Bullish | Bearish |
| NET POSITION MOVEMENT INDEX: | | | |
| – 6-Week Change in Strength Index: | -8.2 | 10.4 | -12.4 |
New Zealand Dollar Futures:
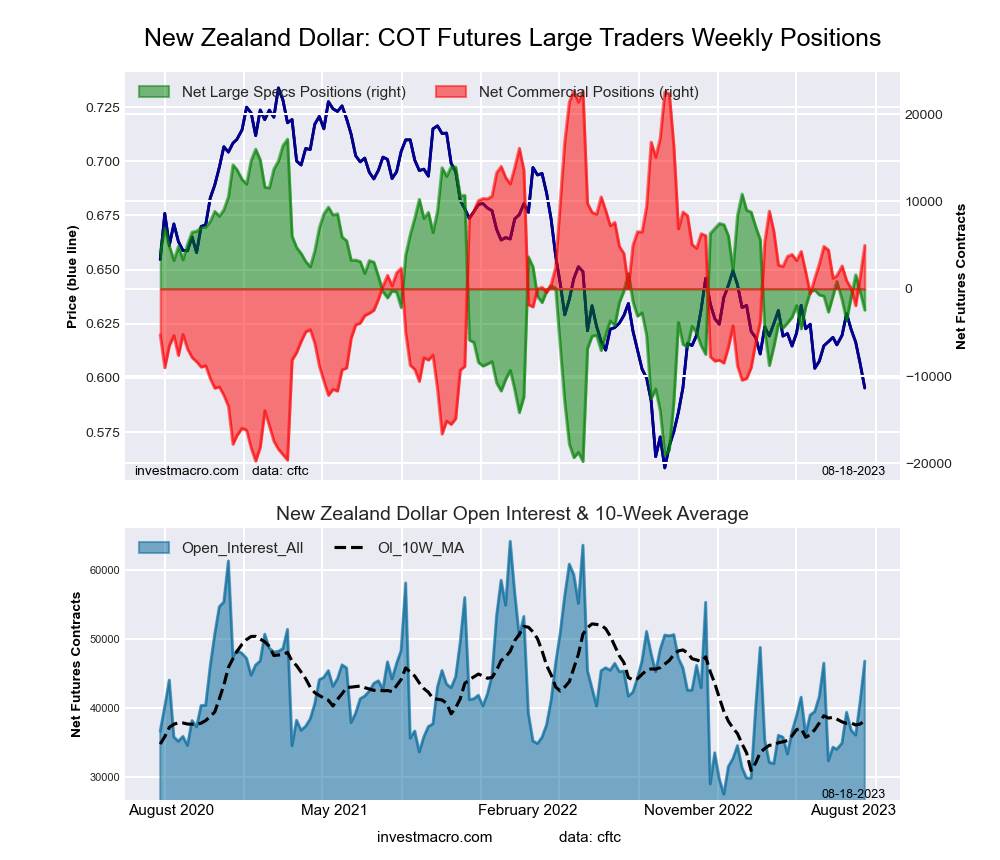 The New Zealand Dollar large speculator standing this week totaled a net position of -2,436 contracts in the data reported through Tuesday. This was a weekly decline of -2,068 contracts from the previous week which had a total of -368 net contracts.
This week’s current strength score (the trader positioning range over the past three years, measured from 0 to 100) shows the speculators are currently Bearish with a score of 47.0 percent. The commercials are Bullish with a score of 58.2 percent and the small traders (not shown in chart) are Bearish-Extreme with a score of 19.9 percent.
Price Trend-Following Model: Strong Downtrend
Our weekly trend-following model classifies the current market price position as: Strong Downtrend. The current action for the model is considered to be: Hold – Maintain Short Position.
| NEW ZEALAND DOLLAR Statistics | SPECULATORS | COMMERCIALS | SMALL TRADERS |
| – Percent of Open Interest Longs: | 46.8 | 46.6 | 6.3 |
| – Percent of Open Interest Shorts: | 52.0 | 36.0 | 11.7 |
| – Net Position: | -2,436 | 4,969 | -2,533 |
| – Gross Longs: | 21,910 | 21,795 | 2,942 |
| – Gross Shorts: | 24,346 | 16,826 | 5,475 |
| – Long to Short Ratio: | 0.9 to 1 | 1.3 to 1 | 0.5 to 1 |
| NET POSITION TREND: | | | |
| – Strength Index Score (3 Year Range Pct): | 47.0 | 58.2 | 19.9 |
| – Strength Index Reading (3 Year Range): | Bearish | Bullish | Bearish-Extreme |
| NET POSITION MOVEMENT INDEX: | | | |
| – 6-Week Change in Strength Index: | -8.9 | 8.2 | -2.3 |
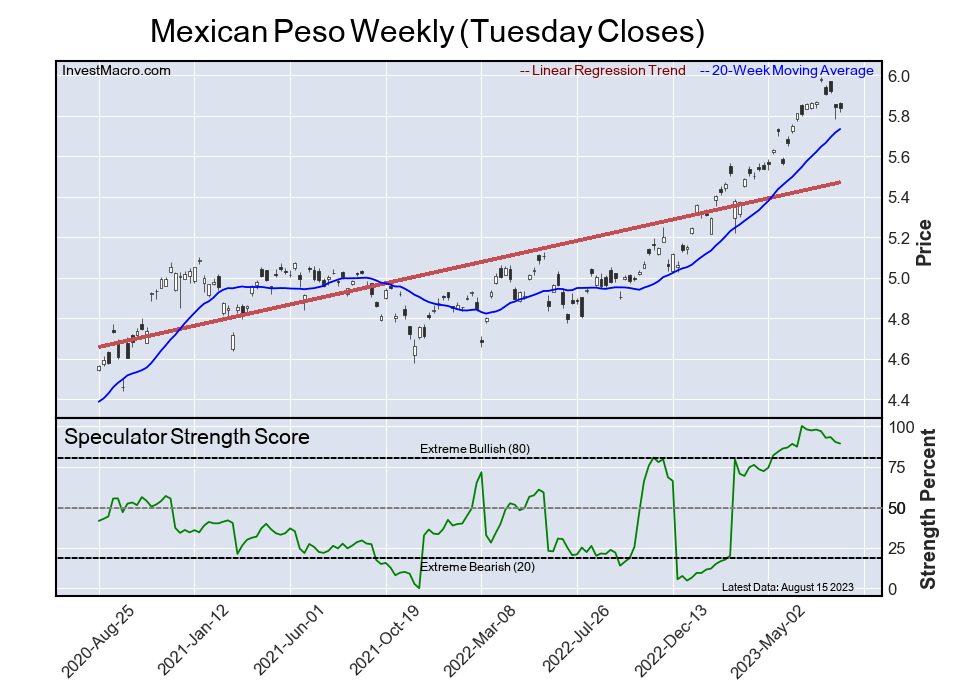
Mexican Peso Futures:
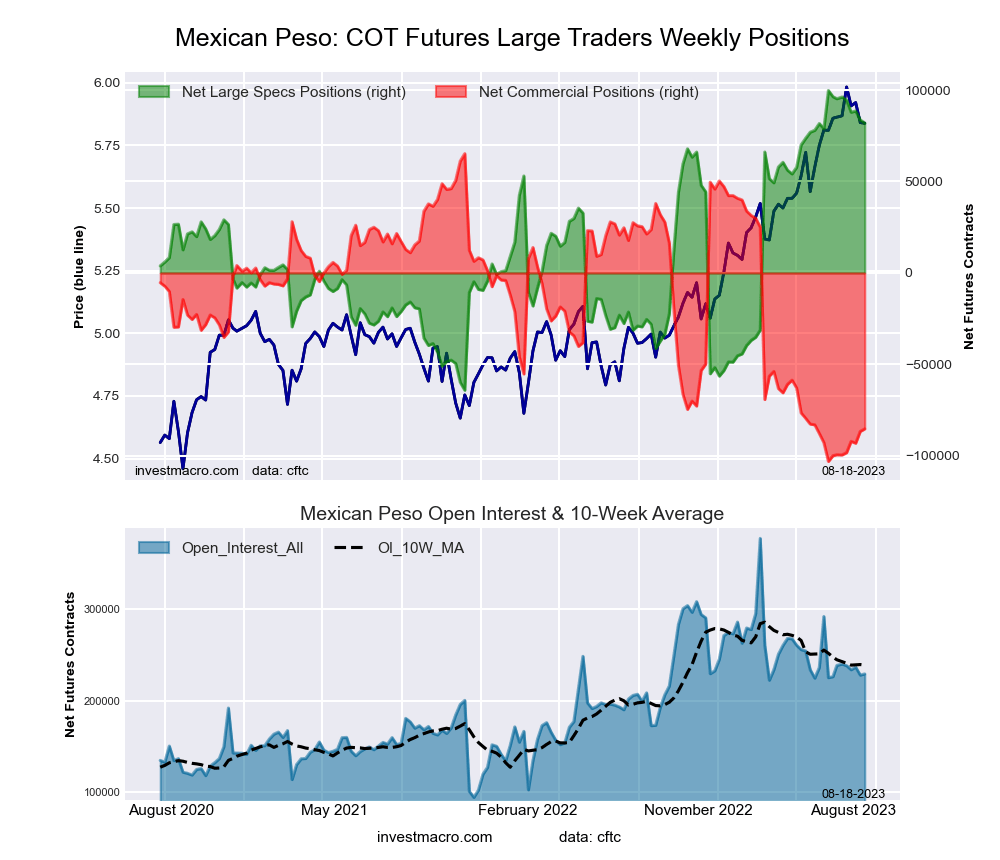 The Mexican Peso large speculator standing this week totaled a net position of 82,023 contracts in the data reported through Tuesday. This was a weekly decrease of -1,628 contracts from the previous week which had a total of 83,651 net contracts.
This week’s current strength score (the trader positioning range over the past three years, measured from 0 to 100) shows the speculators are currently Bullish-Extreme with a score of 89.2 percent. The commercials are Bearish-Extreme with a score of 10.6 percent and the small traders (not shown in chart) are Bearish with a score of 31.6 percent.
Price Trend-Following Model: Uptrend
Our weekly trend-following model classifies the current market price position as: Uptrend. The current action for the model is considered to be: Hold – Maintain Long Position.
| MEXICAN PESO Statistics | SPECULATORS | COMMERCIALS | SMALL TRADERS |
| – Percent of Open Interest Longs: | 47.8 | 47.4 | 3.6 |
| – Percent of Open Interest Shorts: | 11.9 | 84.6 | 2.2 |
| – Net Position: | 82,023 | -85,227 | 3,204 |
| – Gross Longs: | 109,340 | 108,596 | 8,197 |
| – Gross Shorts: | 27,317 | 193,823 | 4,993 |
| – Long to Short Ratio: | 4.0 to 1 | 0.6 to 1 | 1.6 to 1 |
| NET POSITION TREND: | | | |
| – Strength Index Score (3 Year Range Pct): | 89.2 | 10.6 | 31.6 |
| – Strength Index Reading (3 Year Range): | Bullish-Extreme | Bearish-Extreme | Bearish |
| NET POSITION MOVEMENT INDEX: | | | |
| – 6-Week Change in Strength Index: | -8.1 | 8.4 | -6.1 |
Brazilian Real Futures:
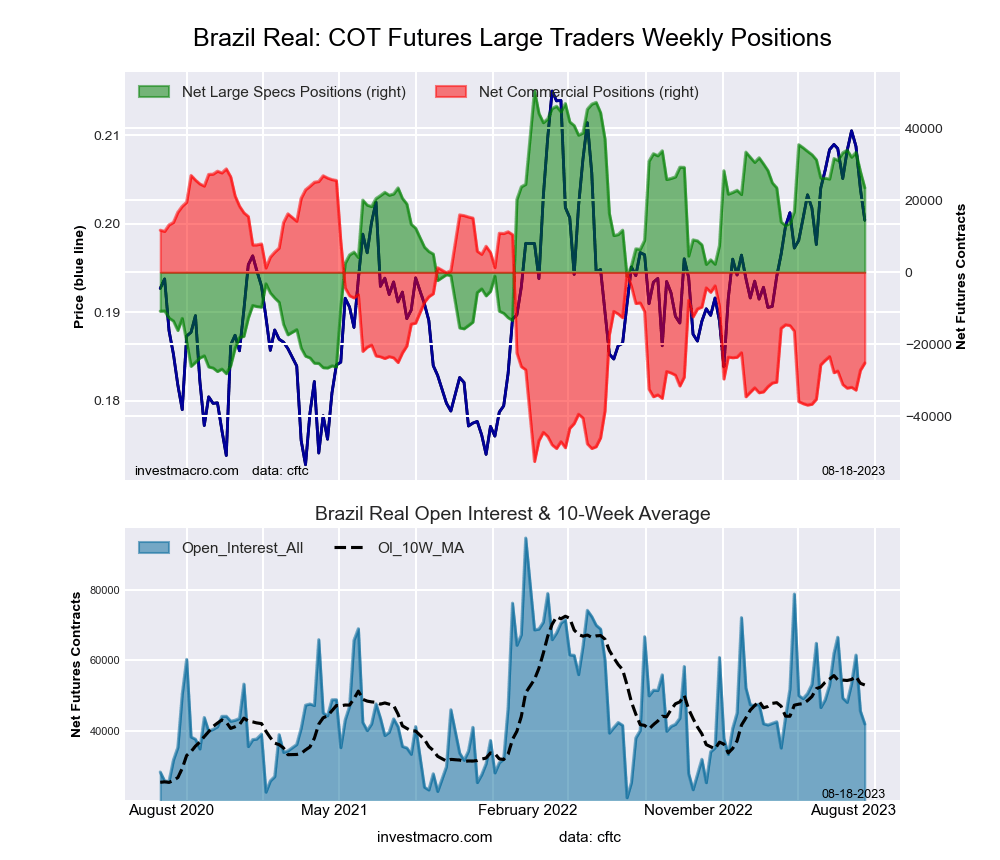 The Brazilian Real large speculator standing this week totaled a net position of 23,475 contracts in the data reported through Tuesday. This was a weekly lowering of -4,564 contracts from the previous week which had a total of 28,039 net contracts.
This week’s current strength score (the trader positioning range over the past three years, measured from 0 to 100) shows the speculators are currently Bullish with a score of 65.6 percent. The commercials are Bearish with a score of 33.6 percent and the small traders (not shown in chart) are Bullish with a score of 57.8 percent.
Price Trend-Following Model: Weak Uptrend
Our weekly trend-following model classifies the current market price position as: Weak Uptrend. The current action for the model is considered to be: Hold – Maintain Long Position.
| BRAZIL REAL Statistics | SPECULATORS | COMMERCIALS | SMALL TRADERS |
| – Percent of Open Interest Longs: | 65.8 | 23.9 | 9.0 |
| – Percent of Open Interest Shorts: | 10.0 | 83.9 | 4.8 |
| – Net Position: | 23,475 | -25,216 | 1,741 |
| – Gross Longs: | 27,676 | 10,065 | 3,774 |
| – Gross Shorts: | 4,201 | 35,281 | 2,033 |
| – Long to Short Ratio: | 6.6 to 1 | 0.3 to 1 | 1.9 to 1 |
| NET POSITION TREND: | | | |
| – Strength Index Score (3 Year Range Pct): | 65.6 | 33.6 | 57.8 |
| – Strength Index Reading (3 Year Range): | Bullish | Bearish | Bullish |
| NET POSITION MOVEMENT INDEX: | | | |
| – 6-Week Change in Strength Index: | -9.7 | 2.7 | 43.0 |
Bitcoin Futures:
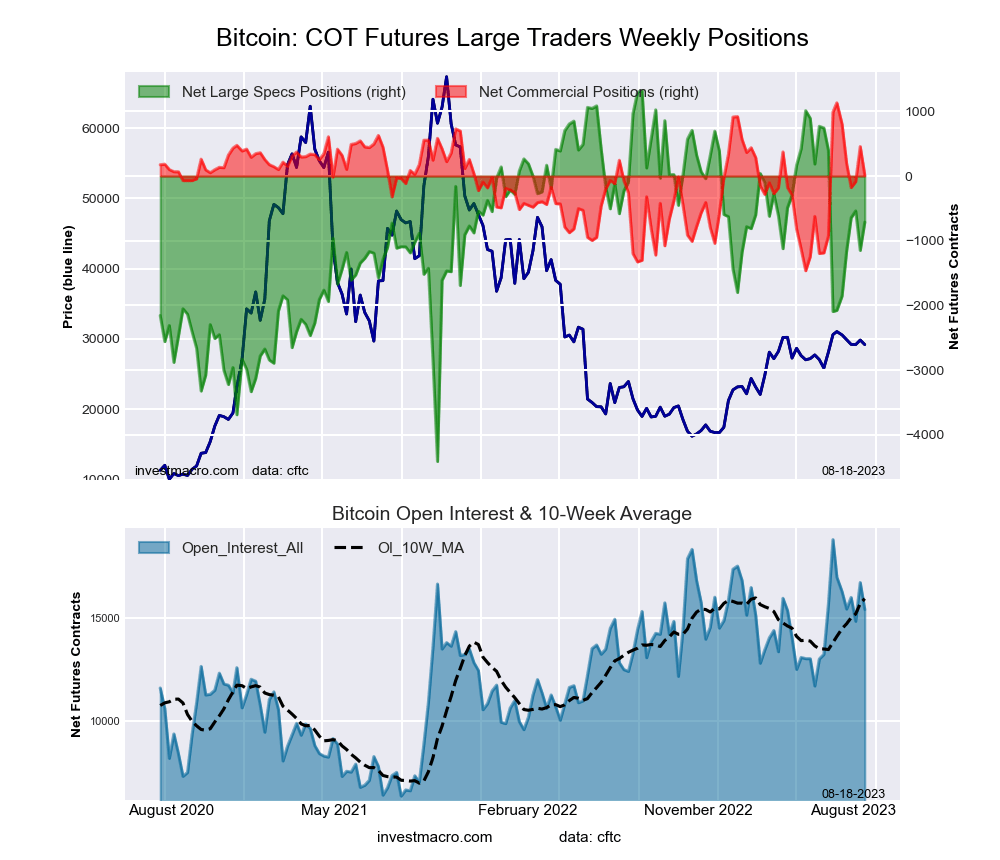 The Bitcoin large speculator standing this week totaled a net position of -712 contracts in the data reported through Tuesday. This was a weekly increase of 437 contracts from the previous week which had a total of -1,149 net contracts.
This week’s current strength score (the trader positioning range over the past three years, measured from 0 to 100) shows the speculators are currently Bullish with a score of 64.5 percent. The commercials are Bullish with a score of 56.9 percent and the small traders (not shown in chart) are Bearish with a score of 28.8 percent.
Price Trend-Following Model: Weak Uptrend
Our weekly trend-following model classifies the current market price position as: Weak Uptrend. The current action for the model is considered to be: Hold – Maintain Long Position.
| BITCOIN Statistics | SPECULATORS | COMMERCIALS | SMALL TRADERS |
| – Percent of Open Interest Longs: | 77.6 | 3.9 | 8.4 |
| – Percent of Open Interest Shorts: | 82.3 | 3.8 | 3.9 |
| – Net Position: | -712 | 14 | 698 |
| – Gross Longs: | 11,981 | 602 | 1,299 |
| – Gross Shorts: | 12,693 | 588 | 601 |
| – Long to Short Ratio: | 0.9 to 1 | 1.0 to 1 | 2.2 to 1 |
| NET POSITION TREND: | | | |
| – Strength Index Score (3 Year Range Pct): | 64.5 | 56.9 | 28.8 |
| – Strength Index Reading (3 Year Range): | Bullish | Bullish | Bearish |
| NET POSITION MOVEMENT INDEX: | | | |
| – 6-Week Change in Strength Index: | 23.8 | -43.1 | -5.6 |
Article By InvestMacro – Receive our weekly COT Newsletter
*COT Report: The COT data, released weekly to the public each Friday, is updated through the most recent Tuesday (data is 3 days old) and shows a quick view of how large speculators or non-commercials (for-profit traders) were positioned in the futures markets.
The CFTC categorizes trader positions according to commercial hedgers (traders who use futures contracts for hedging as part of the business), non-commercials (large traders who speculate to realize trading profits) and nonreportable traders (usually small traders/speculators) as well as their open interest (contracts open in the market at time of reporting). See CFTC criteria here.


