By ForexTime
- Risk aversion grips global stock markets
- Brent crude hovers around triple digits amid supply shocks
- Gold pressured by stronger dollar and inflation fears
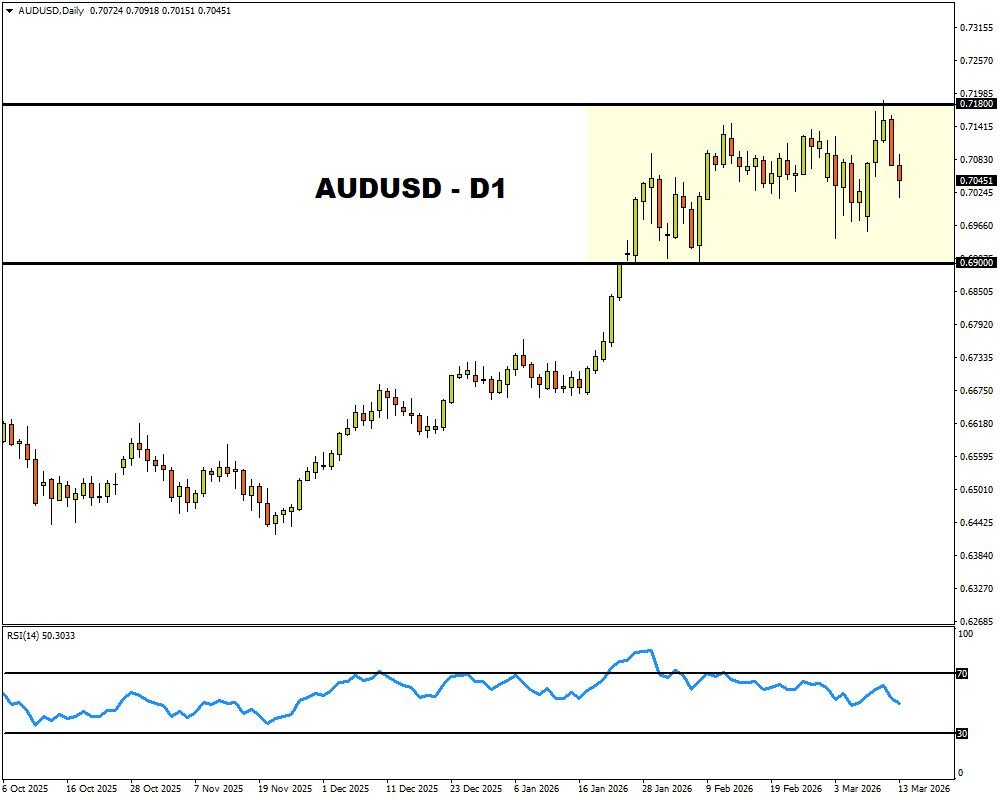
- RBA raises rates for second consecutive time
- Fed seen leaving rates unchanged on Wednesday
Risk aversion returned to global markets on Tuesday as tensions in the Middle East sapped risk appetite.
The brief tech rally in the previous session merely served as a small distraction with equities on the back foot amid the overall caution.
All eyes remain on the ship traffic through the Strait of Hormuz as Trump calls for other nations to secure the critical waterway.
Ultimately, this has injected oil prices with monstrous levels of volatility with Brent rallying above $103 a barrel on Tuesday. Iran’s attacks on energy infrastructure around the Middle East have intensified fears around supply shocks, injecting oil bulls with renewed vigour.
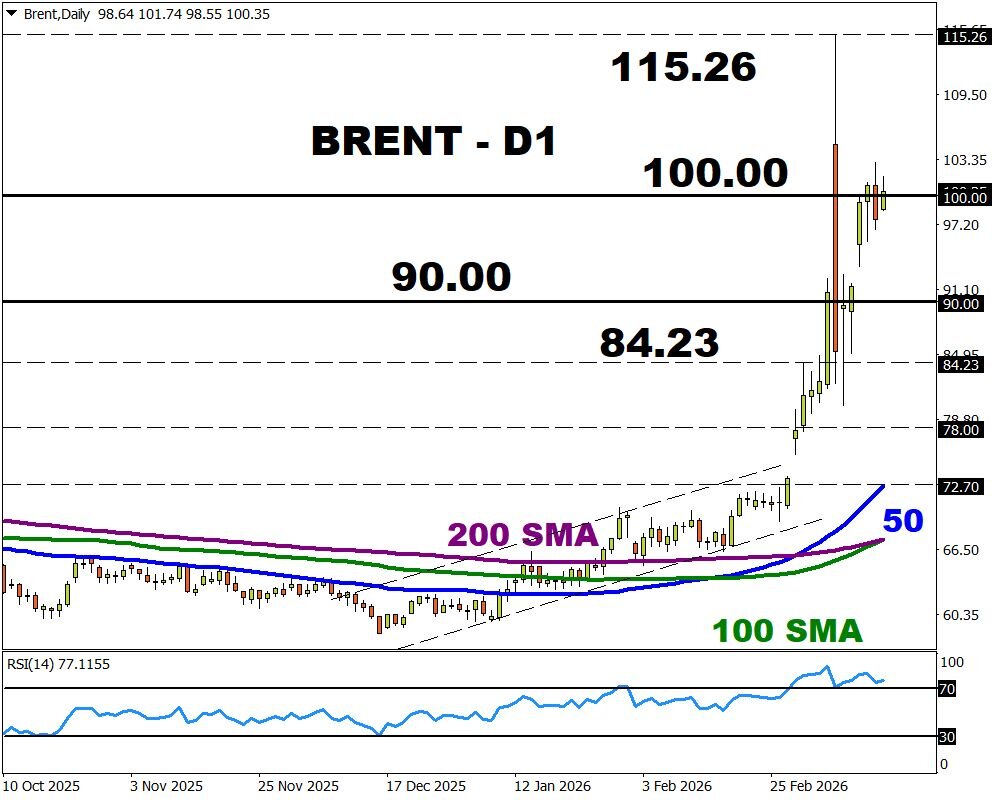
To counter such shocks, the IEA launched its largest ever oil release amounting to 400million barrels of oil from their emergency stocks. In addition, the US issued its second temporary waiver for the purchase of Russian oil. Despite all of this, Brent is finding comfort at triple digits and could extend gains on geopolitical risk.
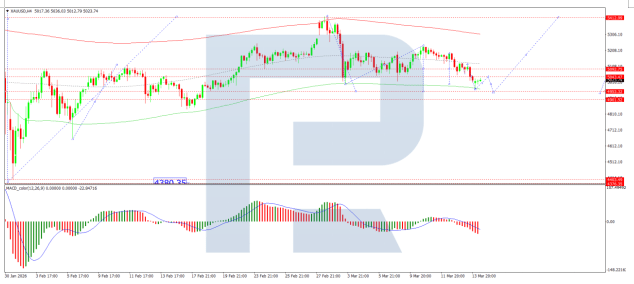
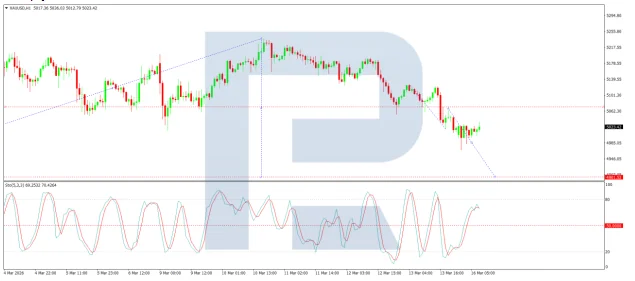
Gold remains on the back foot despite the growing risk aversion.
A broadly stronger dollar and dwindling bets around lower US interest rates have dealt gold a double blow. Traders are only pricing in just one Fed cut in 2026, thanks to concerns around conflict-induced inflation.
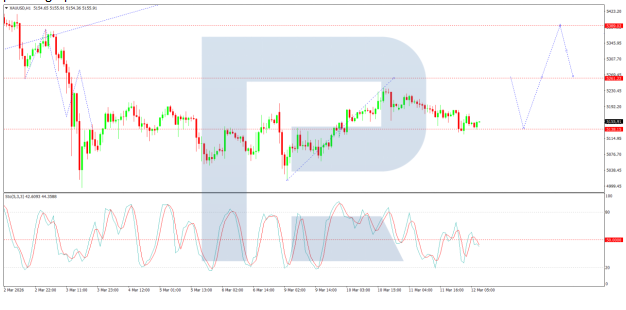
Gold’s near-term outlook may be influenced by the Fed decision on Wednesday. No changes are expected, but the Fed may be forced to reassess its policy strategy for 2026. Looking at the charts, gold is wobbling above $5000 as of writing. Weakness below this point may open a path toward $4900 while a rebound could see prices retest resistance at $5100.
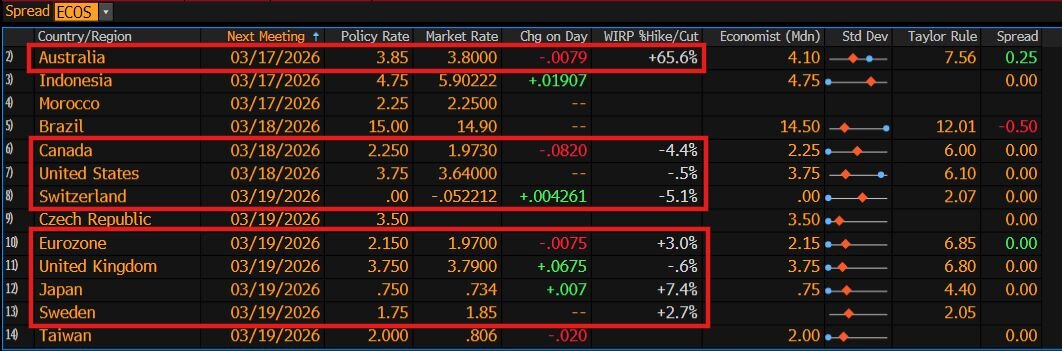
Speaking of central banks, the RBA raised interest rates on Tuesday for a second consecutive meeting.
Growing concerns around conflict-induced inflation shocks may prompt central banks to reassess their policy strategies for 2026.
The Federal Reserve (Fed), European Central Bank (ECB) and Bank of England (BoE), among many others will be under the spotlight this week.
Market expectations have rapidly evaporated over the Fed cutting rates anytime while the BoE/ECB are seen potentially hiking rates by the end of the year if inflation persists. These sharp shifts in policy expectations may translate to heightened levels of volatility.
![]() Article by ForexTime
Article by ForexTime
ForexTime Ltd (FXTM) is an award winning international online forex broker regulated by CySEC 185/12 www.forextime.com