By InvestMacro | COT | Data Tables | COT Leaders | Downloads | COT Newsletter

Here are the latest charts and statistics for the Commitment of Traders (COT) data published by the Commodities Futures Trading Commission (CFTC).
The latest COT data is updated through Tuesday March 17th and shows a quick view of how large market participants (for-profit speculators and commercial traders) were positioned in the futures markets. All currency positions are in direct relation to the US dollar where, for example, a bet for the euro is a bet that the euro will rise versus the dollar while a bet against the euro will be a bet that the euro will decline versus the dollar.
Weekly Speculator Changes led by GBP, Swiss Franc, Australian & New Zealand Dollars
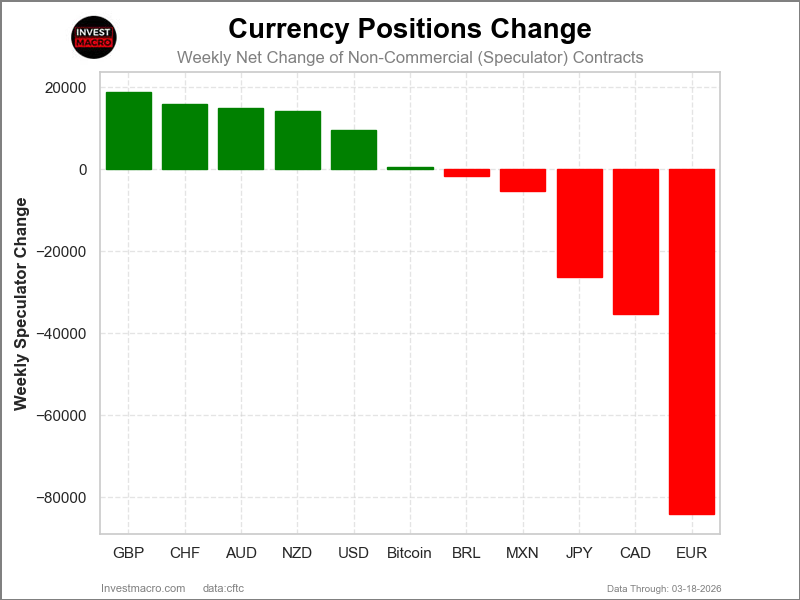
The COT currency market speculator bets were overall slightly higher this week as six out of the eleven currency markets we cover had higher positioning while the other five markets had lower speculator contracts.
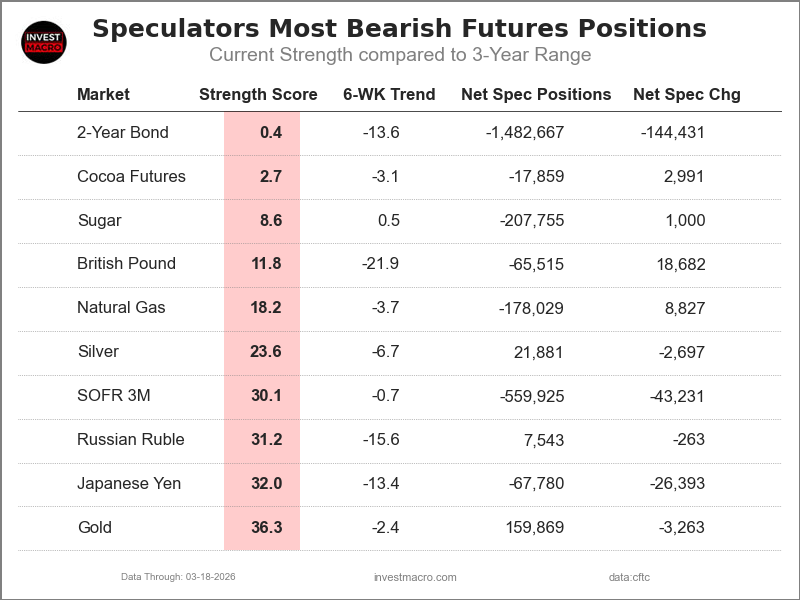
Leading the gains for the currency markets was British Pound (18,682 contracts) with the Swiss Franc (15,879 contracts), the Australian Dollar (14,864 contracts), the New Zealand Dollar (14,054 contracts), the US Dollar Index (9,575 contracts) and Bitcoin (471 contracts) also showing a small positive week.
The currencies seeing declines in speculator bets on the week were the EuroFX (-84,012 contracts), the Canadian Dollar (-35,273 contracts), the Japanese Yen (-26,393 contracts), the Mexican Peso (-5,351 contracts) and with the Brazilian Real (-1,711 contracts) also registering lower bets on the week.
Currency Speculators sharply drop Euro, CAD bets while boosting GBP, CHF & AUD
The COT market data for Currencies this week saw a bunch of extremely significant changes in the speculator positioning through Tuesday.
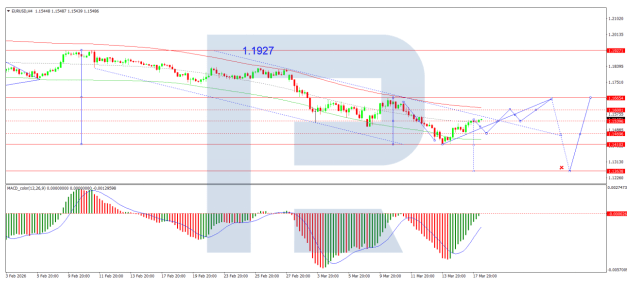
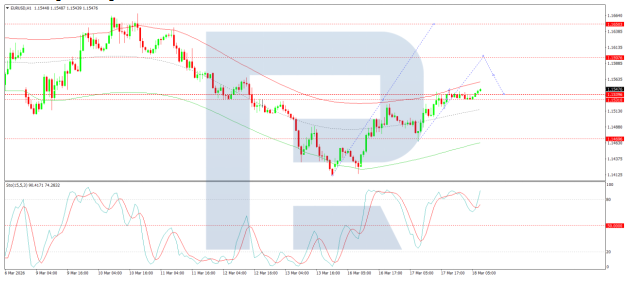
First off, the biggest mover on the week was the Euro, which saw a gigantic drawback in speculative bullish bets by -84,012 contracts. This marks the biggest drawdown for one week in Euro futures history. The Euro position has now fallen for five consecutive weeks, and that has taken off roughly -160,000 contracts from the bullish position, which has now fallen to a paltry +21,132 net contracts this week. This breaks a streak of fifteen consecutive weeks where the net contract position was over 100,000 contracts. In the currency exchange market, the Euro managed to have a gaining week after a couple of strong down weeks and trades right below the psychological 1.1600 resistance level, with support below at the 1.1475 to 1.1500 exchange levels.
Next up, the Canadian Dollar contracts saw a similar shortfall on the week with a -35,273 net contract decline this week. Unlike the Euro, the Canadian Dollar contracts had been ascending over the past weeks – as speculator contracts had risen in seven out of the previous eight weeks and had pushed the net contract position up to a +36,159 net contract position on March 10th. After this week’s sharp decline, the net position is virtually unchanged at a small +886 net speculator position. The CAD price in the currency markets has been treading water without much direction recently with the CAD ranging between 0.7200 and 0.7400 over the past eight weeks.
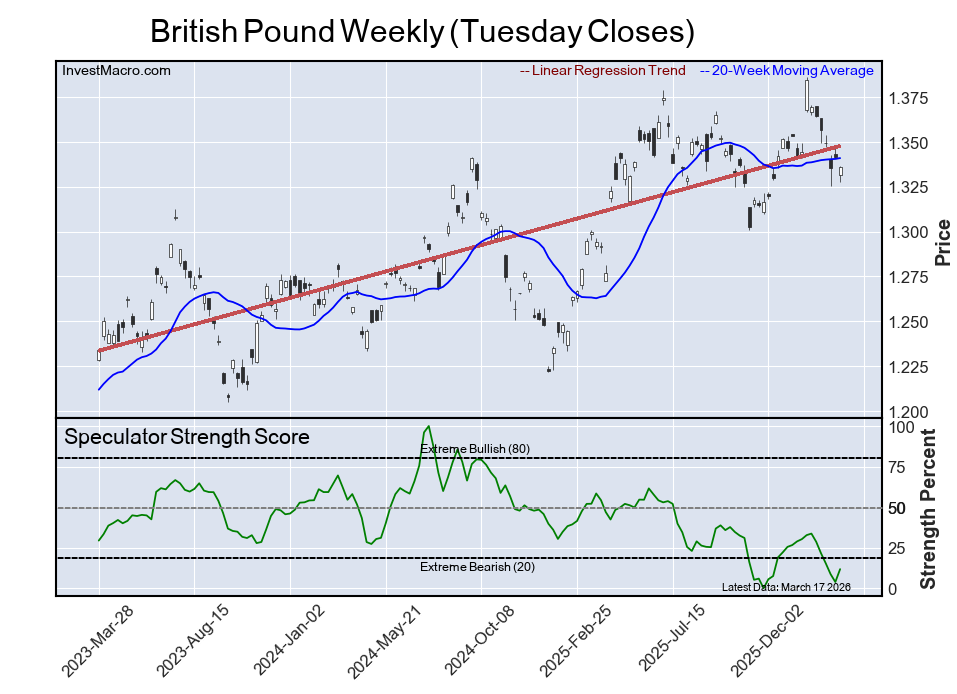
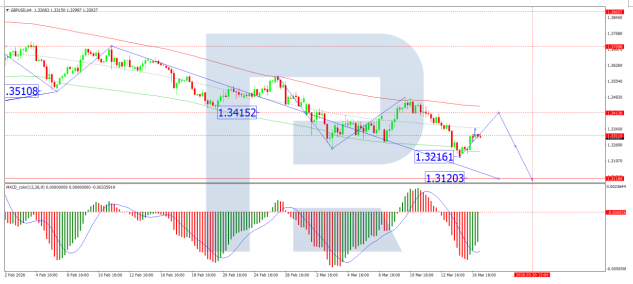
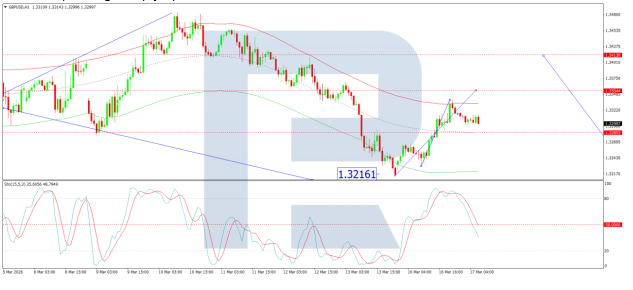
On the plus side, the British Pound Sterling saw a strong rise this week after declining in the previous five consecutive weeks. This week’s gain by over +18,000 net contracts was the highest weekly gain out of the past three months dating back to December 16th, 2025. However, the British Pound Sterling net position remains bearish. Overall, this currency speculator position has now been in a continuous bearish position for the past 34 weeks, dating back to July 22nd of 2025. In the Foreign Exchange Markets, the British Pound Sterling against the US Dollar saw a modest rise this week for the first time out of the past four weeks and now trades right around the 1.3300 exchange level. The Pound Sterling has recently been retreating after reaching a high in January around the 1.3870 level.
The Swiss Franc saw strong speculator demand this week with a gain of over +15,000 contracts. The Swiss Franc speculator position is usually a safe haven bid, and you would typically think the speculator position would be super strong. But there has been quite a lot of hedging in the Swiss Franc futures markets, so many of the moves are counterintuitive. However, this week obviously saw some safe haven speculator bids. While the Franchas been super strong in the Exchange Markets against the US Dollar, with the price of the Franc up around 17% higher since the beginning of January 2025. Currently, the Franc against the US Dollar trades at the 1.2797 exchange rate and has been as high as 1.3219 in late January.
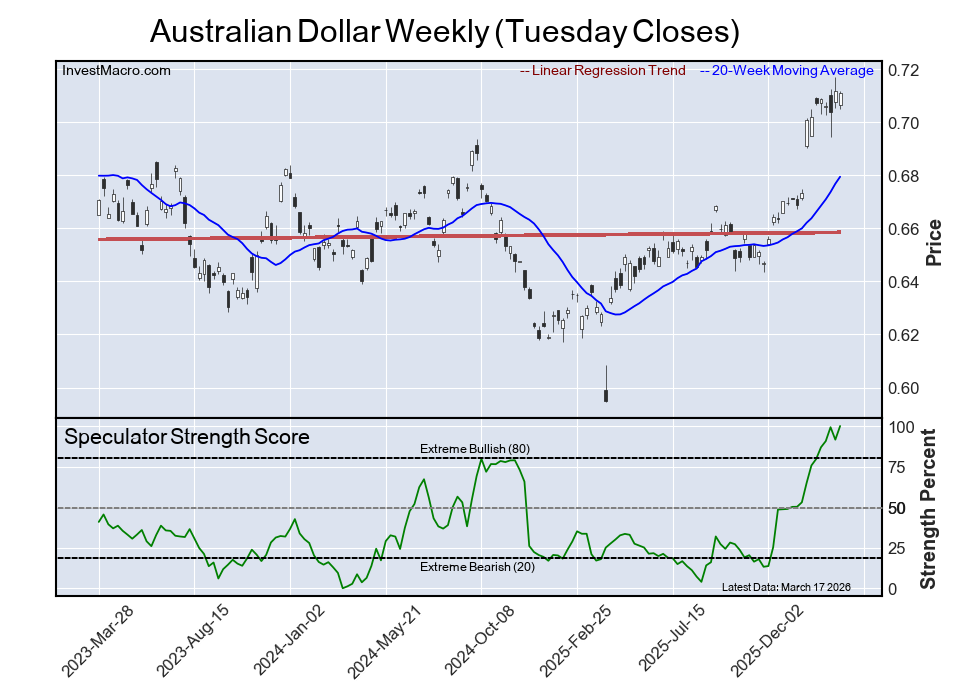
The Australian Dollar, on the other hand, has been traditionally the anti-safe haven or high beta and usually plummets along with weakened speculator sentiment in uncertain times. However, the Australian Dollar continues to see strong speculator inflows. Speculator positions have gained in 15 out of the past 16 weeks, with an inflow of +153,237 net contracts over that time. This has brought the overall speculator position to a bullish level of +69,061 net contracts. This is the highest level for a standing speculator position since 2017, or a difference of about 441 weeks. The Australian Dollar against the US Dollar in the forex market dipped this week but remains trading right at the important psychological support and resistance level of 0.7000.
The New Zealand Dollar speculator position also saw strong inflows this week with a weekly gain of 14,054 net contracts. The New Zealand Dollar has been somewhat on a different path than the Australian Dollar, as the overall net position has been bearish for the past 35 weeks, dating back to July 15th, 2025. Over that time, we have seen a few record-breaking bearish positions, with December 9th reaching the highest bearish level on record at -56,781 net contracts. Since that all-time bearish position, the New Zealand Dollar speculator position has shed almost 30,000 contracts, and this week leveled the position at -23,057 net contracts. In the Forex Markets, the New Zealand Dollar against the US Dollar has been in a multi-year downtrend, with prices in January hitting the 200-weekly moving average and fading lower and with the NZD trading currently at 0.5840 exchange levels.
Leading the Currencies market price performances was the Euro and British Pound
Seeing the highest weekly price changes this week was the Euro with a 1.35% increase over the last five days. The British Pound Sterling came in second with a 0.90% change, while the New Zealand Dollar saw a 0.89% gain on the week. Next up, the Mexican Peso was higher by 0.62%, followed by the Australian Dollar which rose by 0.56%. The Swiss Franc was also higher by 0.42% on the week. The Japanese Yen managed to see an uptick by 0.28%, while the Canadian Dollar was virtually unchanged but edged up by 0.04% on the week.
The Brazilian Real dipped by -0.03%, while the US Dollar Index was lower by -0.79%. Bitcoin saw the biggest shortfall in the week with a -1.80% decline.
Currencies Data:
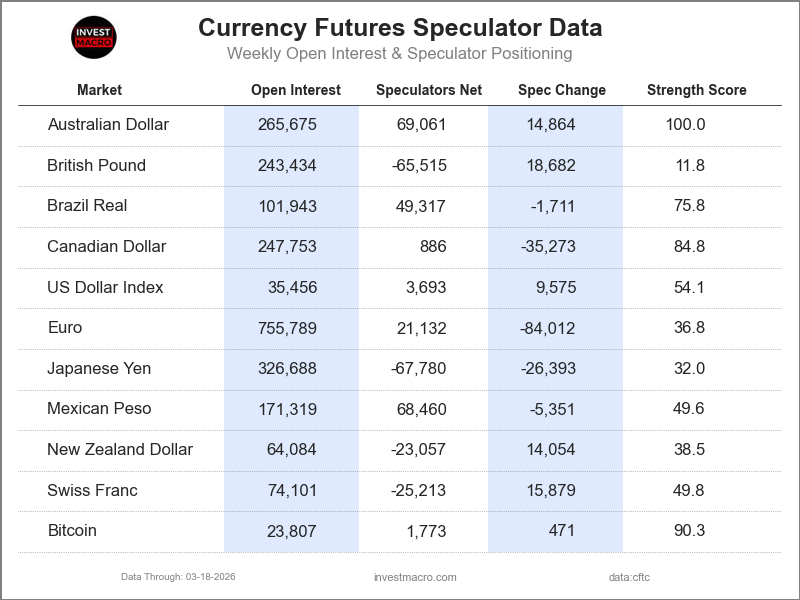
Legend: Open Interest | Speculators Current Net Position | Weekly Specs Change | Specs Strength Score compared to last 3-Years (0-100 range)
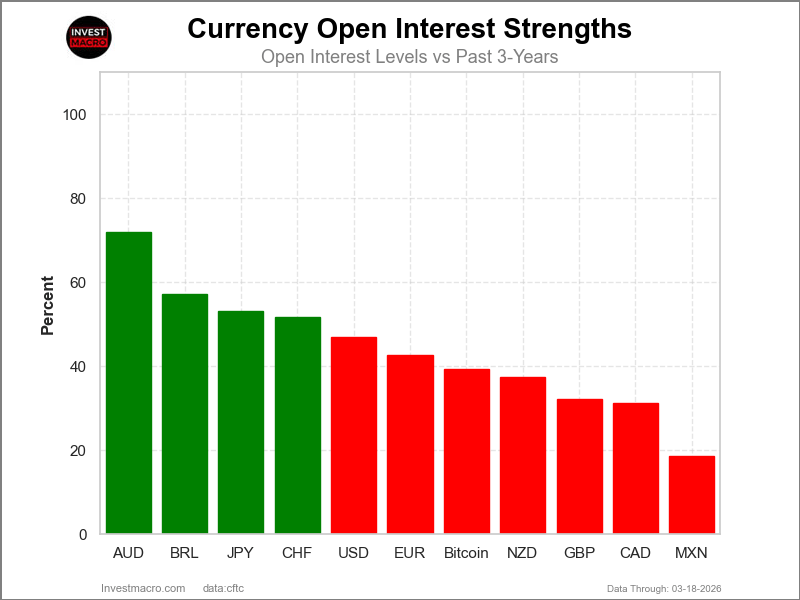
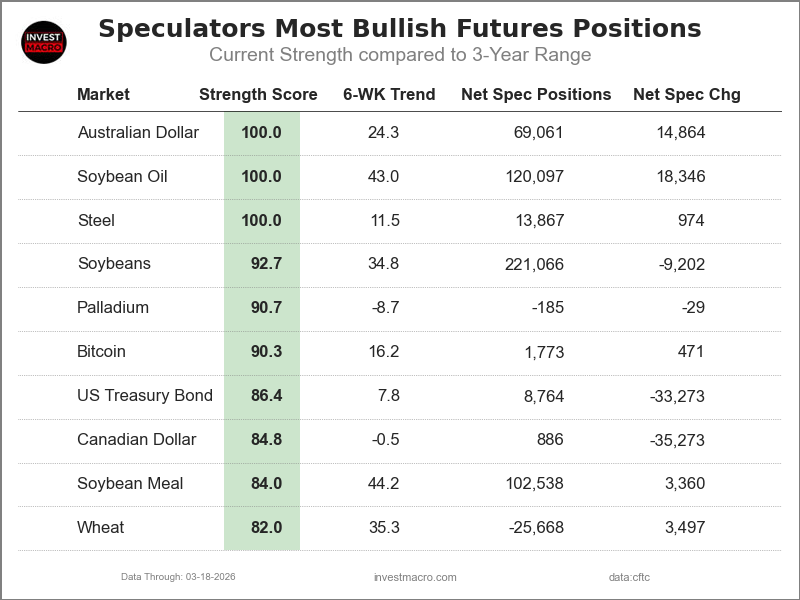
Strength Scores led by Australian Dollar & Bitcoin
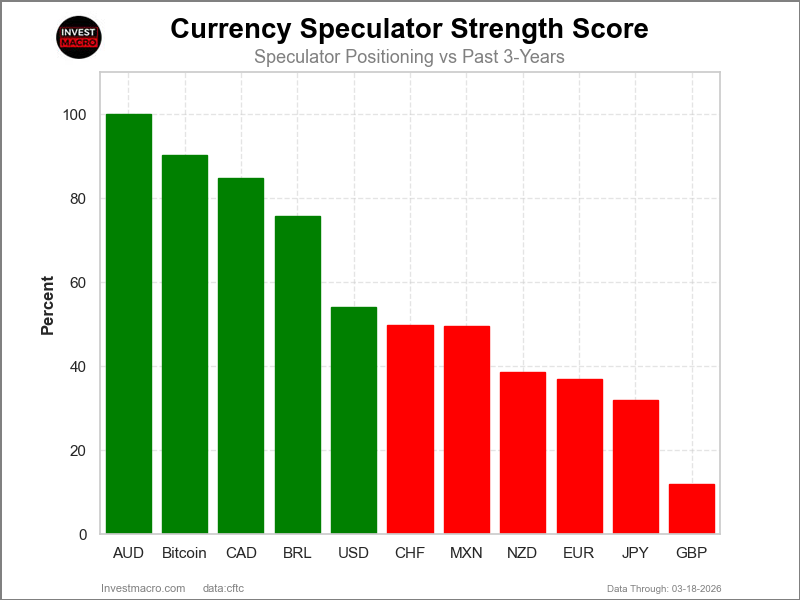
COT Strength Scores (a normalized measure of Speculator positions over a 3-Year range, from 0 to 100 where above 80 is Extreme-Bullish and below 20 is Extreme-Bearish) showed that the Australian Dollar (100 percent) and the Bitcoin (90 percent) lead the currency markets this week. The Canadian Dollar (85 percent), Brazilian Real (76 percent) and the US Dollar Index (54 percent) come in as the next highest in the weekly strength scores.
On the downside, the British Pound (12 percent) comes in at the lowest strength levels currently and are in Extreme-Bearish territory (below 20 percent). The next lowest strength scores are the Japanese Yen (32 percent), the EuroFX (37 percent) and the New Zealand Dollar (39 percent).
3-Year Strength Statistics:
US Dollar Index (54.1 percent) vs US Dollar Index previous week (28.3 percent)
EuroFX (36.8 percent) vs EuroFX previous week (68.8 percent)
British Pound Sterling (11.8 percent) vs British Pound Sterling previous week (3.8 percent)
Japanese Yen (32.0 percent) vs Japanese Yen previous week (39.3 percent)
Swiss Franc (49.8 percent) vs Swiss Franc previous week (17.6 percent)
Canadian Dollar (84.8 percent) vs Canadian Dollar previous week (100.0 percent)
Australian Dollar (100.0 percent) vs Australian Dollar previous week (91.6 percent)
New Zealand Dollar (38.5 percent) vs New Zealand Dollar previous week (22.5 percent)
Mexican Peso (49.6 percent) vs Mexican Peso previous week (53.4 percent)
Brazilian Real (75.8 percent) vs Brazilian Real previous week (77.1 percent)
Bitcoin (90.3 percent) vs Bitcoin previous week (80.3 percent)
Swiss Franc & Australian Dollar top the 6-Week Strength Trends
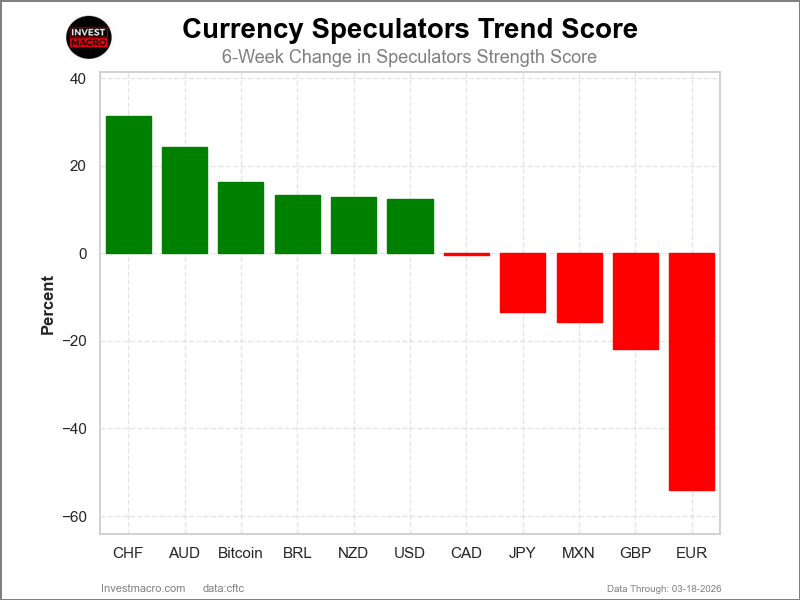
COT Strength Score Trends (or move index, calculates the 6-week changes in strength scores) showed that the Swiss Franc (31 percent) and the Australian Dollar (24 percent) lead the past six weeks trends for the currencies. Bitcoin (16 percent), the New Zealand Dollar (13 percent) and the Brazilian Real (13 percent) are the next highest positive movers in the 3-Year trends data.
The EuroFX (-54 percent) leads the downside trend scores currently with the British Pound (-22 percent), Mexican Peso (-16 percent) and the Japanese Yen (-13 percent) following next with lower trend scores.
3-Year Strength Trends:
US Dollar Index (12.3 percent) vs US Dollar Index previous week (-4.0 percent)
EuroFX (-54.1 percent) vs EuroFX previous week (-10.3 percent)
British Pound Sterling (-21.9 percent) vs British Pound Sterling previous week (-28.9 percent)
Japanese Yen (-13.4 percent) vs Japanese Yen previous week (-2.1 percent)
Swiss Franc (31.4 percent) vs Swiss Franc previous week (3.6 percent)
Canadian Dollar (-0.5 percent) vs Canadian Dollar previous week (22.5 percent)
Australian Dollar (24.3 percent) vs Australian Dollar previous week (26.6 percent)
New Zealand Dollar (12.8 percent) vs New Zealand Dollar previous week (12.1 percent)
Mexican Peso (-15.7 percent) vs Mexican Peso previous week (-20.7 percent)
Brazilian Real (13.4 percent) vs Brazilian Real previous week (23.4 percent)
Bitcoin (16.2 percent) vs Bitcoin previous week (13.0 percent)
Individual COT Forex Markets:
US Dollar Index Futures:
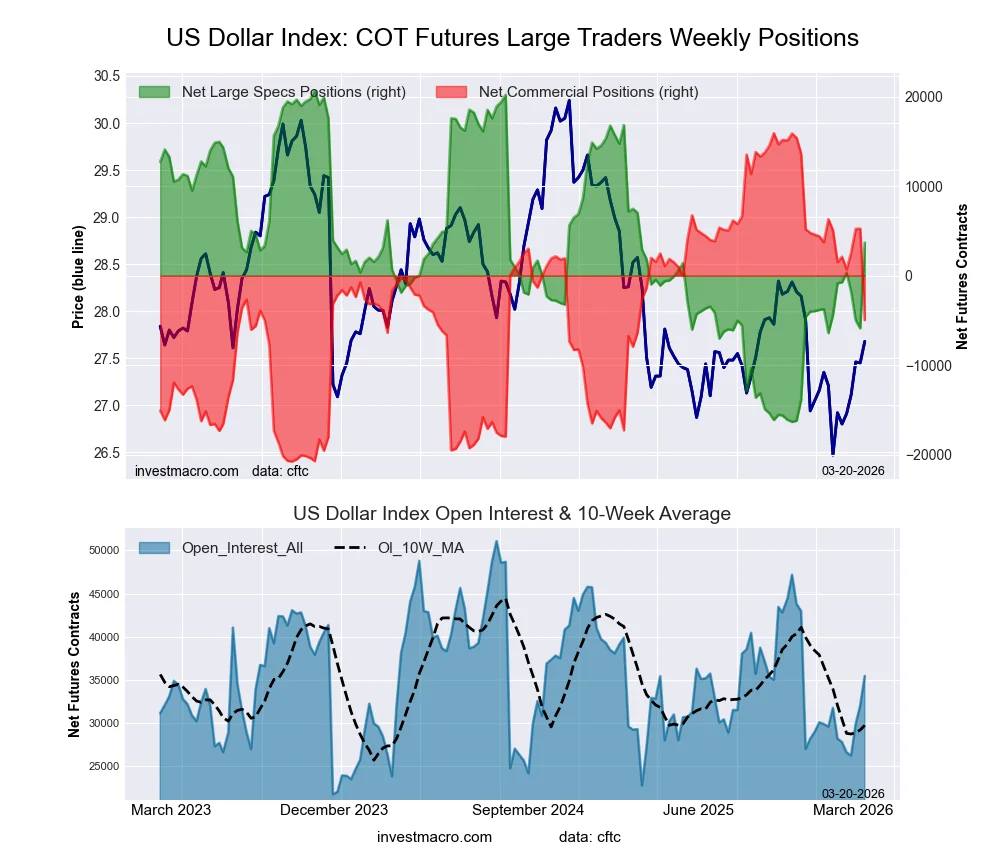 The US Dollar Index large speculator standing this week resulted in a net position of 3,693 contracts in the data reported through Tuesday. This was a weekly increase of 9,575 contracts from the previous week which had a total of -5,882 net contracts.
This week’s current strength score (the trader positioning range over the past three years, measured from 0 to 100) shows the speculators are currently Bullish with a score of 54.1 percent. The commercials are Bearish with a score of 43.1 percent and the small traders (not shown in chart) are Bullish with a score of 61.1 percent.
Price Trend-Following Model: Weak Downtrend
Our weekly trend-following model classifies the current market price position as: Weak Downtrend.
| US DOLLAR INDEX Statistics | SPECULATORS | COMMERCIALS | SMALL TRADERS |
| – Percent of Open Interest Longs: | 60.4 | 25.2 | 8.8 |
| – Percent of Open Interest Shorts: | 50.0 | 39.2 | 5.3 |
| – Net Position: | 3,693 | -4,957 | 1,264 |
| – Gross Longs: | 21,426 | 8,932 | 3,132 |
| – Gross Shorts: | 17,733 | 13,889 | 1,868 |
| – Long to Short Ratio: | 1.2 to 1 | 0.6 to 1 | 1.7 to 1 |
| NET POSITION TREND: | | | |
| – Strength Index Score (3 Year Range Pct): | 54.1 | 43.1 | 61.1 |
| – Strength Index Reading (3 Year Range): | Bullish | Bearish | Bullish |
| NET POSITION MOVEMENT INDEX: | | | |
| – 6-Week Change in Strength Index: | 12.3 | -17.7 | 33.9 |
Euro Currency Futures:
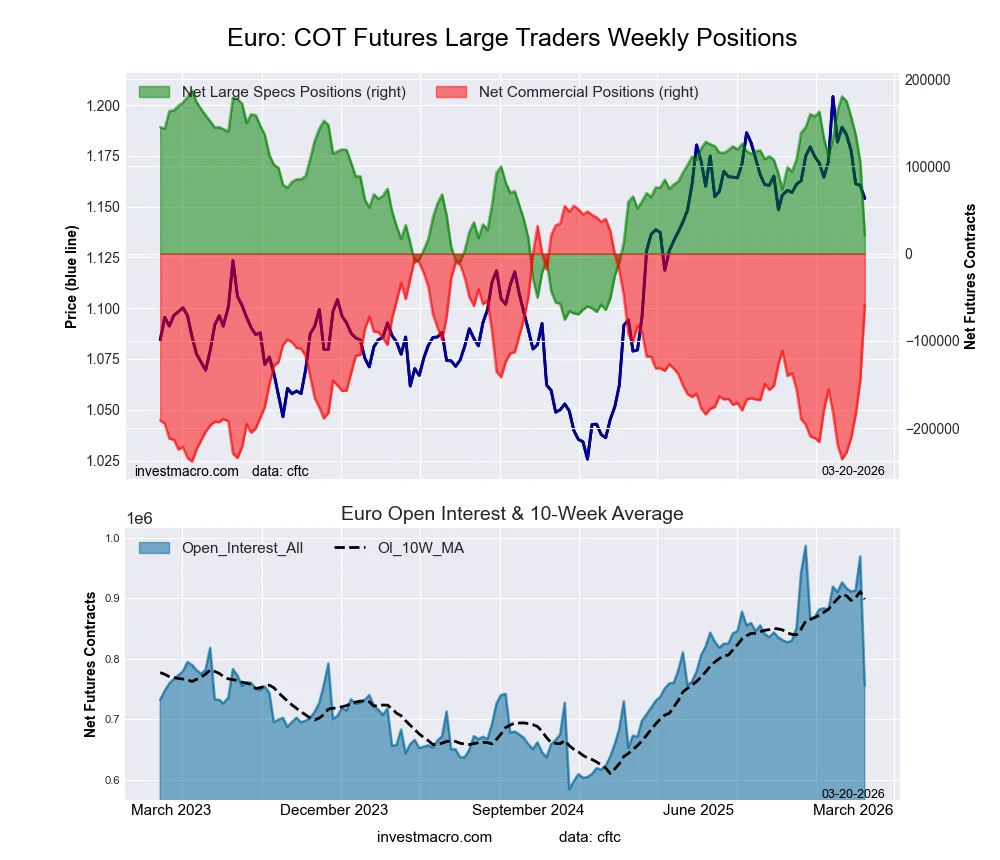 The Euro Currency large speculator standing this week resulted in a net position of 21,132 contracts in the data reported through Tuesday. This was a weekly decline of -84,012 contracts from the previous week which had a total of 105,144 net contracts.
This week’s current strength score (the trader positioning range over the past three years, measured from 0 to 100) shows the speculators are currently Bearish with a score of 36.8 percent. The commercials are Bullish with a score of 61.3 percent and the small traders (not shown in chart) are Bullish with a score of 53.2 percent.
Price Trend-Following Model: Weak Uptrend
Our weekly trend-following model classifies the current market price position as: Weak Uptrend.
| EURO Currency Statistics | SPECULATORS | COMMERCIALS | SMALL TRADERS |
| – Percent of Open Interest Longs: | 28.2 | 57.6 | 11.3 |
| – Percent of Open Interest Shorts: | 25.4 | 65.3 | 6.4 |
| – Net Position: | 21,132 | -58,433 | 37,301 |
| – Gross Longs: | 212,886 | 435,130 | 85,722 |
| – Gross Shorts: | 191,754 | 493,563 | 48,421 |
| – Long to Short Ratio: | 1.1 to 1 | 0.9 to 1 | 1.8 to 1 |
| NET POSITION TREND: | | | |
| – Strength Index Score (3 Year Range Pct): | 36.8 | 61.3 | 53.2 |
| – Strength Index Reading (3 Year Range): | Bearish | Bullish | Bullish |
| NET POSITION MOVEMENT INDEX: | | | |
| – 6-Week Change in Strength Index: | -54.1 | 54.6 | -37.7 |
British Pound Sterling Futures:
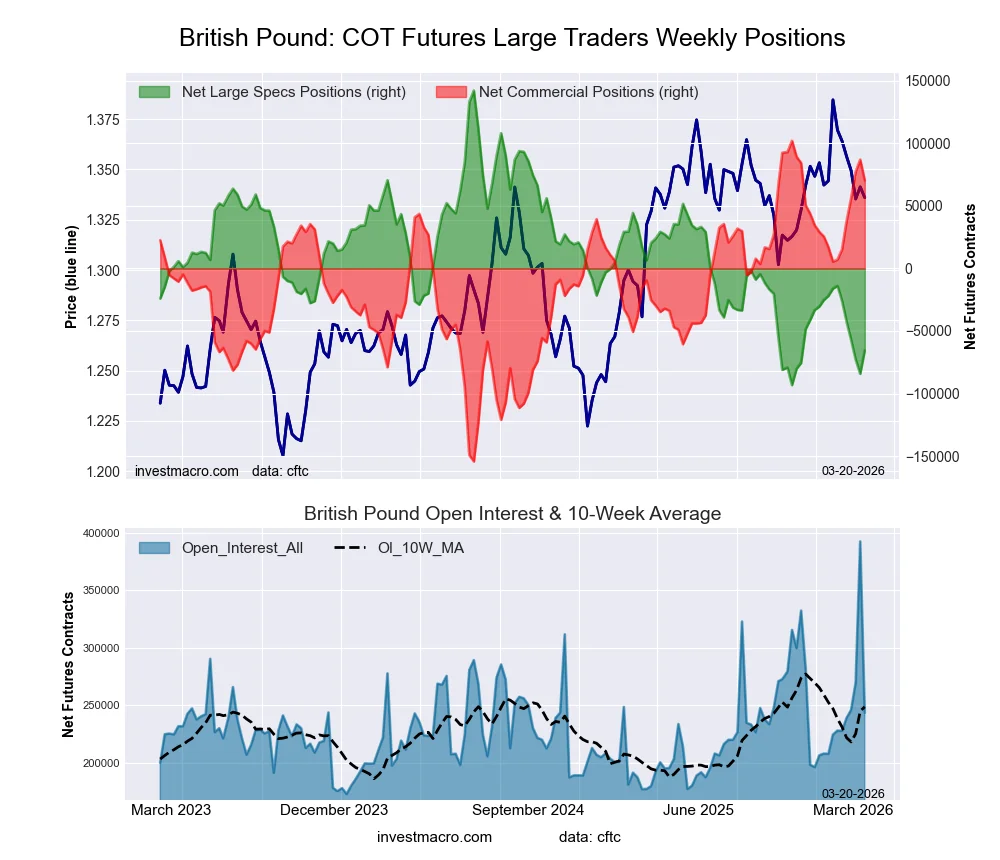 The British Pound Sterling large speculator standing this week resulted in a net position of -65,515 contracts in the data reported through Tuesday. This was a weekly rise of 18,682 contracts from the previous week which had a total of -84,197 net contracts.
This week’s current strength score (the trader positioning range over the past three years, measured from 0 to 100) shows the speculators are currently Bearish-Extreme with a score of 11.8 percent. The commercials are Bullish-Extreme with a score of 87.6 percent and the small traders (not shown in chart) are Bearish with a score of 40.7 percent.
Price Trend-Following Model: Weak Uptrend
Our weekly trend-following model classifies the current market price position as: Weak Uptrend.
| BRITISH POUND Statistics | SPECULATORS | COMMERCIALS | SMALL TRADERS |
| – Percent of Open Interest Longs: | 18.2 | 70.0 | 10.0 |
| – Percent of Open Interest Shorts: | 45.1 | 41.2 | 12.0 |
| – Net Position: | -65,515 | 70,330 | -4,815 |
| – Gross Longs: | 44,293 | 170,509 | 24,456 |
| – Gross Shorts: | 109,808 | 100,179 | 29,271 |
| – Long to Short Ratio: | 0.4 to 1 | 1.7 to 1 | 0.8 to 1 |
| NET POSITION TREND: | | | |
| – Strength Index Score (3 Year Range Pct): | 11.8 | 87.6 | 40.7 |
| – Strength Index Reading (3 Year Range): | Bearish-Extreme | Bullish-Extreme | Bearish |
| NET POSITION MOVEMENT INDEX: | | | |
| – 6-Week Change in Strength Index: | -21.9 | 24.7 | -30.3 |
Japanese Yen Futures:
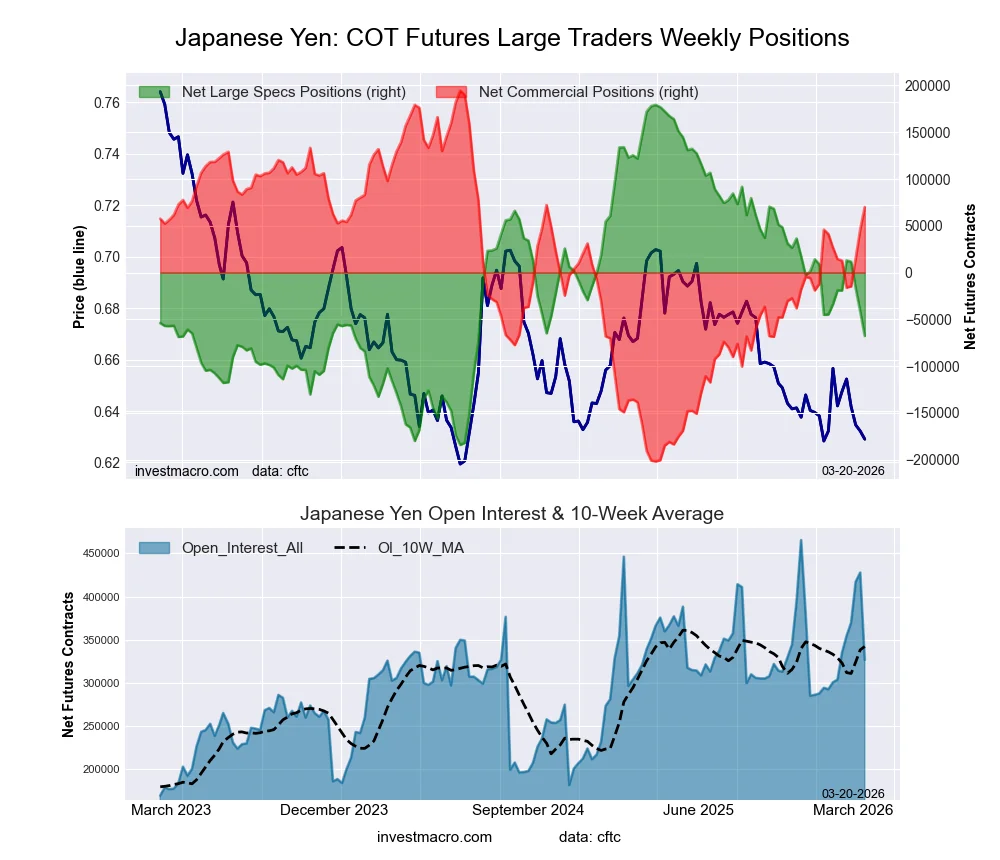 The Japanese Yen large speculator standing this week resulted in a net position of -67,780 contracts in the data reported through Tuesday. This was a weekly decrease of -26,393 contracts from the previous week which had a total of -41,387 net contracts.
This week’s current strength score (the trader positioning range over the past three years, measured from 0 to 100) shows the speculators are currently Bearish with a score of 32.0 percent. The commercials are Bullish with a score of 68.6 percent and the small traders (not shown in chart) are Bearish with a score of 31.0 percent.
Price Trend-Following Model: Strong Downtrend
Our weekly trend-following model classifies the current market price position as: Strong Downtrend.
| JAPANESE YEN Statistics | SPECULATORS | COMMERCIALS | SMALL TRADERS |
| – Percent of Open Interest Longs: | 32.7 | 50.2 | 12.1 |
| – Percent of Open Interest Shorts: | 53.4 | 28.8 | 12.8 |
| – Net Position: | -67,780 | 70,002 | -2,222 |
| – Gross Longs: | 106,819 | 163,975 | 39,497 |
| – Gross Shorts: | 174,599 | 93,973 | 41,719 |
| – Long to Short Ratio: | 0.6 to 1 | 1.7 to 1 | 0.9 to 1 |
| NET POSITION TREND: | | | |
| – Strength Index Score (3 Year Range Pct): | 32.0 | 68.6 | 31.0 |
| – Strength Index Reading (3 Year Range): | Bearish | Bullish | Bearish |
| NET POSITION MOVEMENT INDEX: | | | |
| – 6-Week Change in Strength Index: | -13.4 | 14.0 | -18.2 |
Swiss Franc Futures:
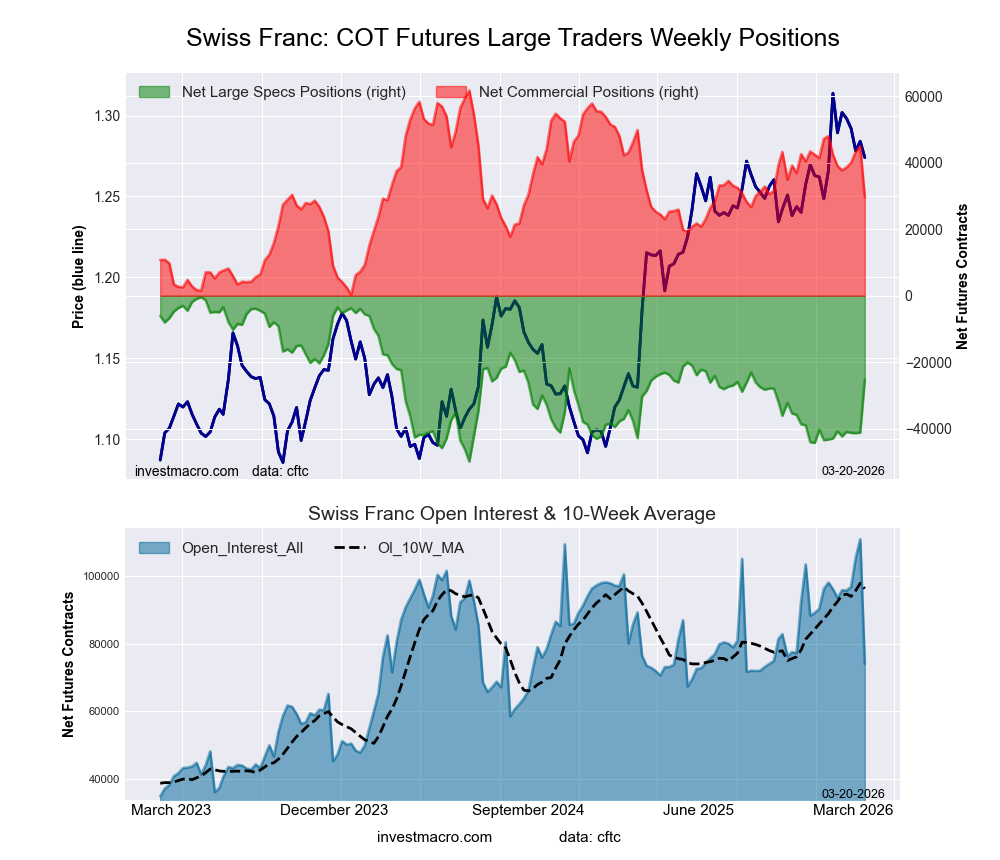 The Swiss Franc large speculator standing this week resulted in a net position of -25,213 contracts in the data reported through Tuesday. This was a weekly boost of 15,879 contracts from the previous week which had a total of -41,092 net contracts.
This week’s current strength score (the trader positioning range over the past three years, measured from 0 to 100) shows the speculators are currently Bearish with a score of 49.8 percent. The commercials are Bearish with a score of 47.8 percent and the small traders (not shown in chart) are Bullish with a score of 60.2 percent.
Price Trend-Following Model: Uptrend
Our weekly trend-following model classifies the current market price position as: Uptrend.
| SWISS FRANC Statistics | SPECULATORS | COMMERCIALS | SMALL TRADERS |
| – Percent of Open Interest Longs: | 11.0 | 71.8 | 16.8 |
| – Percent of Open Interest Shorts: | 45.1 | 31.9 | 22.8 |
| – Net Position: | -25,213 | 29,602 | -4,389 |
| – Gross Longs: | 8,175 | 53,236 | 12,475 |
| – Gross Shorts: | 33,388 | 23,634 | 16,864 |
| – Long to Short Ratio: | 0.2 to 1 | 2.3 to 1 | 0.7 to 1 |
| NET POSITION TREND: | | | |
| – Strength Index Score (3 Year Range Pct): | 49.8 | 47.8 | 60.2 |
| – Strength Index Reading (3 Year Range): | Bearish | Bearish | Bullish |
| NET POSITION MOVEMENT INDEX: | | | |
| – 6-Week Change in Strength Index: | 31.4 | -15.3 | -25.8 |
Canadian Dollar Futures:
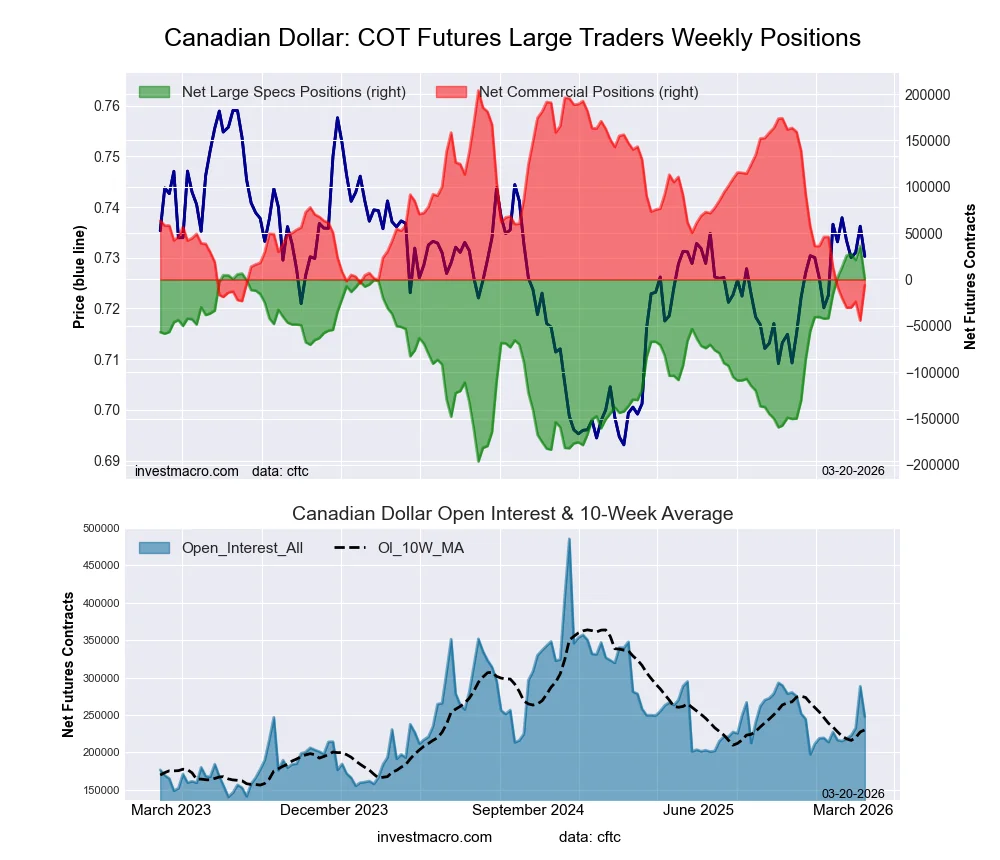 The Canadian Dollar large speculator standing this week resulted in a net position of 886 contracts in the data reported through Tuesday. This was a weekly fall of -35,273 contracts from the previous week which had a total of 36,159 net contracts.
This week’s current strength score (the trader positioning range over the past three years, measured from 0 to 100) shows the speculators are currently Bullish-Extreme with a score of 84.8 percent. The commercials are Bearish-Extreme with a score of 15.4 percent and the small traders (not shown in chart) are Bullish with a score of 60.2 percent.
Price Trend-Following Model: Uptrend
Our weekly trend-following model classifies the current market price position as: Uptrend.
| CANADIAN DOLLAR Statistics | SPECULATORS | COMMERCIALS | SMALL TRADERS |
| – Percent of Open Interest Longs: | 26.8 | 58.2 | 12.1 |
| – Percent of Open Interest Shorts: | 26.5 | 60.8 | 9.9 |
| – Net Position: | 886 | -6,206 | 5,320 |
| – Gross Longs: | 66,507 | 144,314 | 29,911 |
| – Gross Shorts: | 65,621 | 150,520 | 24,591 |
| – Long to Short Ratio: | 1.0 to 1 | 1.0 to 1 | 1.2 to 1 |
| NET POSITION TREND: | | | |
| – Strength Index Score (3 Year Range Pct): | 84.8 | 15.4 | 60.2 |
| – Strength Index Reading (3 Year Range): | Bullish-Extreme | Bearish-Extreme | Bullish |
| NET POSITION MOVEMENT INDEX: | | | |
| – 6-Week Change in Strength Index: | -0.5 | 0.7 | -1.3 |
Australian Dollar Futures:
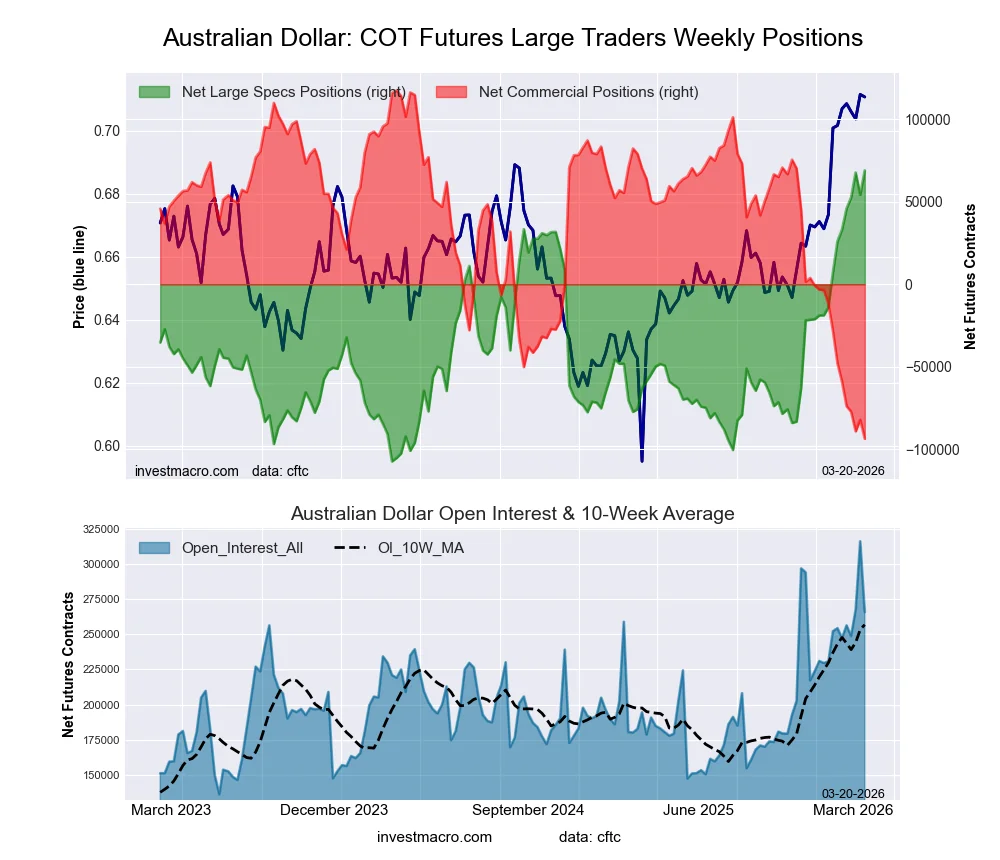 The Australian Dollar large speculator standing this week resulted in a net position of 69,061 contracts in the data reported through Tuesday. This was a weekly boost of 14,864 contracts from the previous week which had a total of 54,197 net contracts.
This week’s current strength score (the trader positioning range over the past three years, measured from 0 to 100) shows the speculators are currently Bullish-Extreme with a score of 100.0 percent. The commercials are Bearish-Extreme with a score of 0.0 percent and the small traders (not shown in chart) are Bullish-Extreme with a score of 92.8 percent.
Price Trend-Following Model: Uptrend
Our weekly trend-following model classifies the current market price position as: Uptrend.
| AUSTRALIAN DOLLAR Statistics | SPECULATORS | COMMERCIALS | SMALL TRADERS |
| – Percent of Open Interest Longs: | 51.2 | 31.5 | 15.4 |
| – Percent of Open Interest Shorts: | 25.2 | 66.8 | 6.1 |
| – Net Position: | 69,061 | -93,772 | 24,711 |
| – Gross Longs: | 136,074 | 83,769 | 40,933 |
| – Gross Shorts: | 67,013 | 177,541 | 16,222 |
| – Long to Short Ratio: | 2.0 to 1 | 0.5 to 1 | 2.5 to 1 |
| NET POSITION TREND: | | | |
| – Strength Index Score (3 Year Range Pct): | 100.0 | 0.0 | 92.8 |
| – Strength Index Reading (3 Year Range): | Bullish-Extreme | Bearish-Extreme | Bullish-Extreme |
| NET POSITION MOVEMENT INDEX: | | | |
| – 6-Week Change in Strength Index: | 24.3 | -21.6 | 5.9 |
New Zealand Dollar Futures:
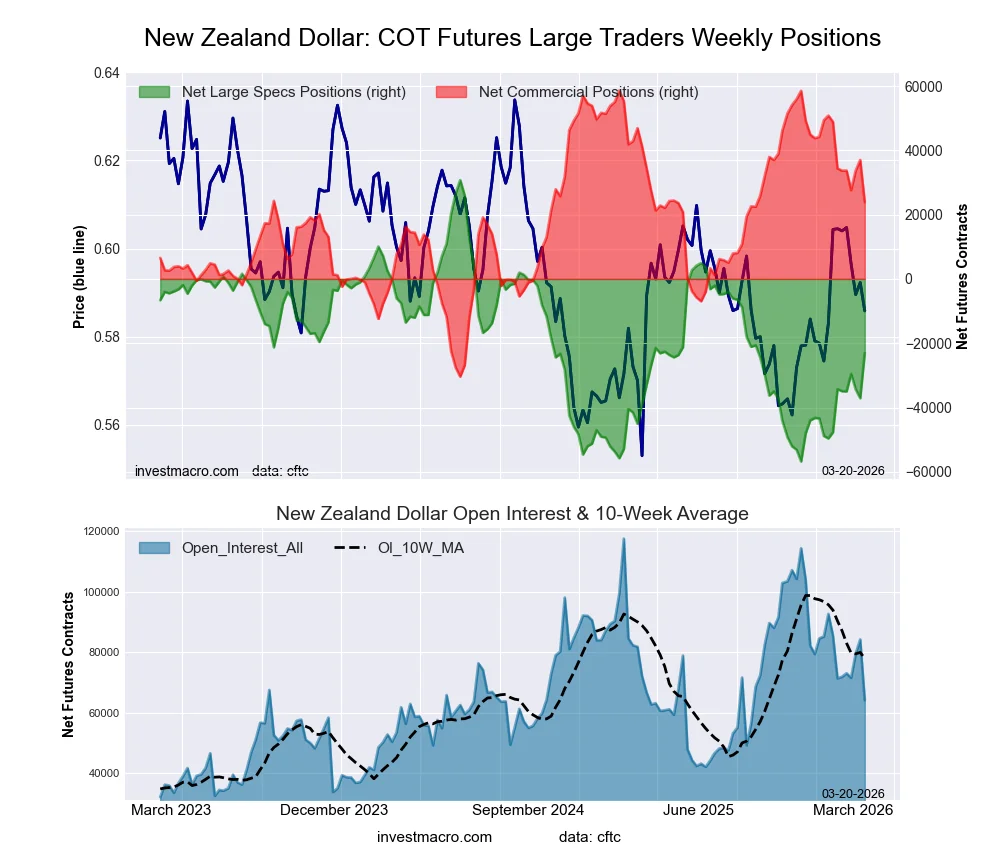 The New Zealand Dollar large speculator standing this week resulted in a net position of -23,057 contracts in the data reported through Tuesday. This was a weekly gain of 14,054 contracts from the previous week which had a total of -37,111 net contracts.
This week’s current strength score (the trader positioning range over the past three years, measured from 0 to 100) shows the speculators are currently Bearish with a score of 38.5 percent. The commercials are Bullish with a score of 61.0 percent and the small traders (not shown in chart) are Bearish with a score of 41.9 percent.
Price Trend-Following Model: Weak Uptrend
Our weekly trend-following model classifies the current market price position as: Weak Uptrend.
| NEW ZEALAND DOLLAR Statistics | SPECULATORS | COMMERCIALS | SMALL TRADERS |
| – Percent of Open Interest Longs: | 17.2 | 77.0 | 4.8 |
| – Percent of Open Interest Shorts: | 53.1 | 39.7 | 6.1 |
| – Net Position: | -23,057 | 23,860 | -803 |
| – Gross Longs: | 10,998 | 49,317 | 3,090 |
| – Gross Shorts: | 34,055 | 25,457 | 3,893 |
| – Long to Short Ratio: | 0.3 to 1 | 1.9 to 1 | 0.8 to 1 |
| NET POSITION TREND: | | | |
| – Strength Index Score (3 Year Range Pct): | 38.5 | 61.0 | 41.9 |
| – Strength Index Reading (3 Year Range): | Bearish | Bullish | Bearish |
| NET POSITION MOVEMENT INDEX: | | | |
| – 6-Week Change in Strength Index: | 12.8 | -11.8 | -9.4 |
Mexican Peso Futures:
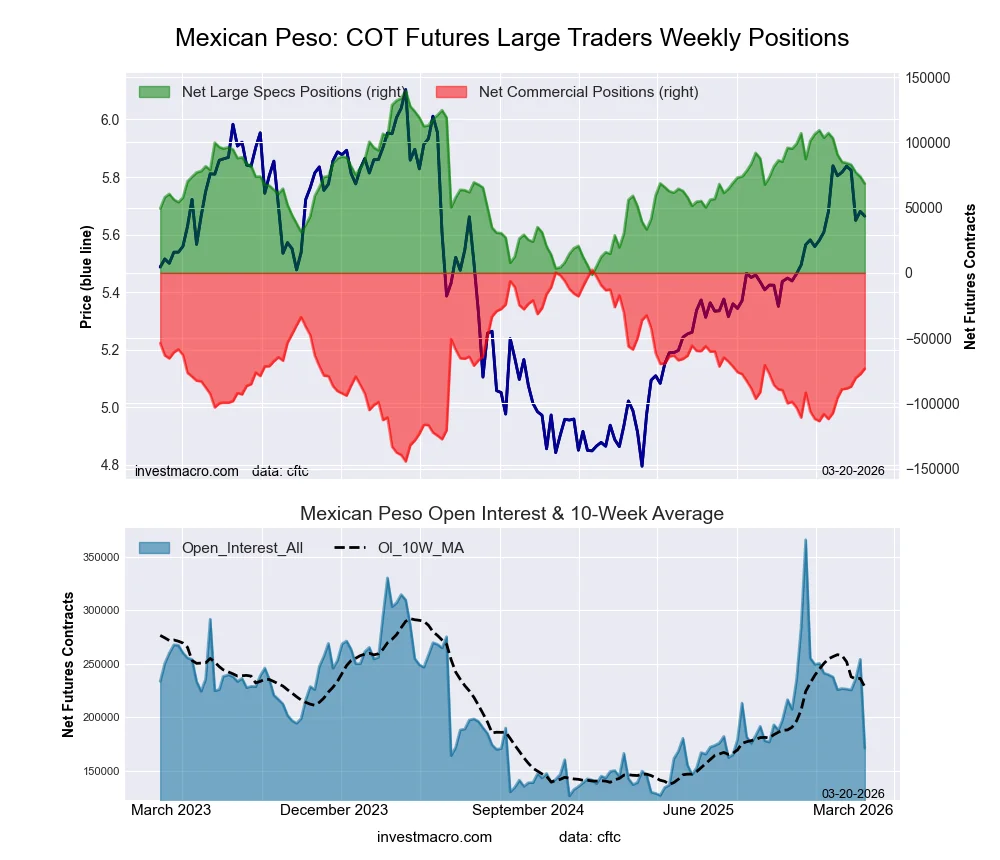 The Mexican Peso large speculator standing this week resulted in a net position of 68,460 contracts in the data reported through Tuesday. This was a weekly decline of -5,351 contracts from the previous week which had a total of 73,811 net contracts.
This week’s current strength score (the trader positioning range over the past three years, measured from 0 to 100) shows the speculators are currently Bearish with a score of 49.6 percent. The commercials are Bearish with a score of 48.3 percent and the small traders (not shown in chart) are Bullish with a score of 50.4 percent.
Price Trend-Following Model: Weak Uptrend
Our weekly trend-following model classifies the current market price position as: Weak Uptrend.
| MEXICAN PESO Statistics | SPECULATORS | COMMERCIALS | SMALL TRADERS |
| – Percent of Open Interest Longs: | 53.1 | 42.5 | 3.5 |
| – Percent of Open Interest Shorts: | 13.2 | 85.4 | 0.6 |
| – Net Position: | 68,460 | -73,440 | 4,980 |
| – Gross Longs: | 90,997 | 72,821 | 5,994 |
| – Gross Shorts: | 22,537 | 146,261 | 1,014 |
| – Long to Short Ratio: | 4.0 to 1 | 0.5 to 1 | 5.9 to 1 |
| NET POSITION TREND: | | | |
| – Strength Index Score (3 Year Range Pct): | 49.6 | 48.3 | 50.4 |
| – Strength Index Reading (3 Year Range): | Bearish | Bearish | Bullish |
| NET POSITION MOVEMENT INDEX: | | | |
| – 6-Week Change in Strength Index: | -15.7 | 15.2 | -1.3 |
Brazilian Real Futures:
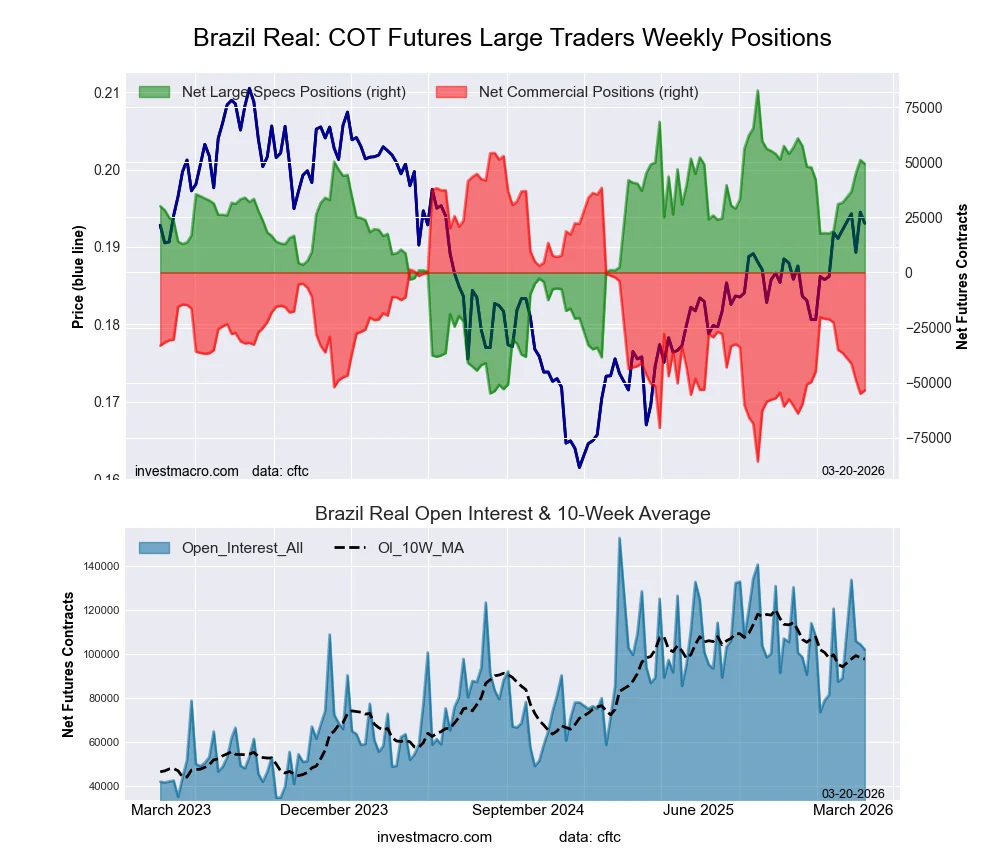 The Brazilian Real large speculator standing this week resulted in a net position of 49,317 contracts in the data reported through Tuesday. This was a weekly fall of -1,711 contracts from the previous week which had a total of 51,028 net contracts.
This week’s current strength score (the trader positioning range over the past three years, measured from 0 to 100) shows the speculators are currently Bullish with a score of 75.8 percent. The commercials are Bearish with a score of 23.1 percent and the small traders (not shown in chart) are Bearish with a score of 44.5 percent.
Price Trend-Following Model: Uptrend
Our weekly trend-following model classifies the current market price position as: Uptrend.
| BRAZIL REAL Statistics | SPECULATORS | COMMERCIALS | SMALL TRADERS |
| – Percent of Open Interest Longs: | 69.9 | 24.5 | 5.0 |
| – Percent of Open Interest Shorts: | 21.5 | 77.0 | 0.9 |
| – Net Position: | 49,317 | -53,517 | 4,200 |
| – Gross Longs: | 71,255 | 25,006 | 5,124 |
| – Gross Shorts: | 21,938 | 78,523 | 924 |
| – Long to Short Ratio: | 3.2 to 1 | 0.3 to 1 | 5.5 to 1 |
| NET POSITION TREND: | | | |
| – Strength Index Score (3 Year Range Pct): | 75.8 | 23.1 | 44.5 |
| – Strength Index Reading (3 Year Range): | Bullish | Bearish | Bearish |
| NET POSITION MOVEMENT INDEX: | | | |
| – 6-Week Change in Strength Index: | 13.4 | -13.1 | 0.2 |
Bitcoin Futures:
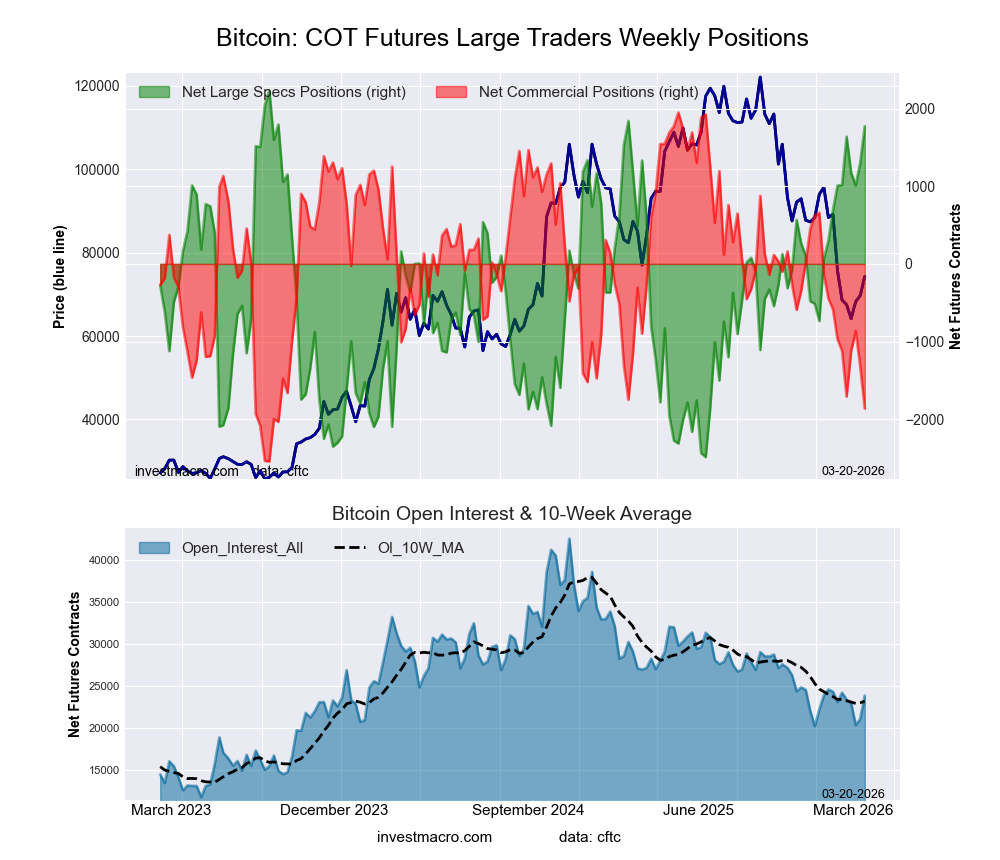 The Bitcoin large speculator standing this week resulted in a net position of 1,773 contracts in the data reported through Tuesday. This was a weekly rise of 471 contracts from the previous week which had a total of 1,302 net contracts.
This week’s current strength score (the trader positioning range over the past three years, measured from 0 to 100) shows the speculators are currently Bullish-Extreme with a score of 90.3 percent. The commercials are Bearish-Extreme with a score of 15.2 percent and the small traders (not shown in chart) are Bearish with a score of 41.9 percent.
Price Trend-Following Model: Downtrend
Our weekly trend-following model classifies the current market price position as: Downtrend.
| BITCOIN Statistics | SPECULATORS | COMMERCIALS | SMALL TRADERS |
| – Percent of Open Interest Longs: | 70.3 | 1.6 | 5.2 |
| – Percent of Open Interest Shorts: | 62.9 | 9.4 | 4.9 |
| – Net Position: | 1,773 | -1,862 | 89 |
| – Gross Longs: | 16,741 | 379 | 1,246 |
| – Gross Shorts: | 14,968 | 2,241 | 1,157 |
| – Long to Short Ratio: | 1.1 to 1 | 0.2 to 1 | 1.1 to 1 |
| NET POSITION TREND: | | | |
| – Strength Index Score (3 Year Range Pct): | 90.3 | 15.2 | 41.9 |
| – Strength Index Reading (3 Year Range): | Bullish-Extreme | Bearish-Extreme | Bearish |
| NET POSITION MOVEMENT INDEX: | | | |
| – 6-Week Change in Strength Index: | 16.2 | -19.9 | 6.7 |
Article By InvestMacro – Receive our weekly COT Reports by Email
*COT Report: The COT data, released weekly to the public each Friday, is updated through the most recent Tuesday (data is 3 days old) and shows a quick view of how large speculators or non-commercials (for-profit traders) were positioned in the futures markets.
The CFTC categorizes trader positions according to commercial hedgers (traders who use futures contracts for hedging as part of the business), non-commercials (large traders who speculate to realize trading profits) and nonreportable traders (usually small traders/speculators) as well as their open interest (contracts open in the market at time of reporting).See CFTC criteria here.
All information and opinions on this website and contained in this article are for general informational purposes only and do not constitute investment advice.


