By InvestMacro

Here are the latest charts and statistics for the Commitment of Traders (COT) data published by the Commodities Futures Trading Commission (CFTC).
The latest COT data is updated through Tuesday April 30th and shows a quick view of how large market participants (for-profit speculators and commercial traders) were positioned in the futures markets. All currency positions are in direct relation to the US dollar where, for example, a bet for the euro is a bet that the euro will rise versus the dollar while a bet against the euro will be a bet that the euro will decline versus the dollar.
Weekly Speculator Changes led by Canadian & Australian Dollars
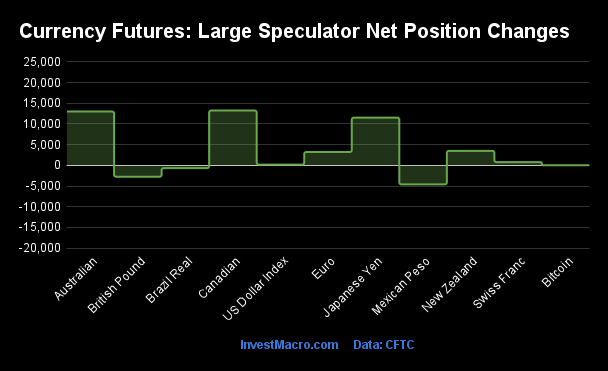
The COT currency market speculator bets were higher this week as eight out of the eleven currency markets we cover had higher positioning while the other three markets had lower speculator contracts.
Leading the gains for the currency markets was the Canadian Dollar (13,249 contracts) with the Australian Dollar (13,004 contracts), the Japanese Yen (11,531 contracts), the New Zealand Dollar (3,496 contracts), EuroFX (3,212 contracts), the Swiss Franc (776 contracts), the US Dollar Index (178 contracts) and Bitcoin (6 contracts) also showing positive weeks.
The currencies seeing declines in speculator bets on the week were the Mexican Peso (-4,610 contracts), the British Pound (-2,757 contracts) and the Brazilian Real (-678 contracts).
Speculators reduce bearish bets for Yen, Canadian & Australian Dollars
This week’s COT currency’s data was mixed in the overall big picture and saw a pause in some of the major trends. There were many extremely weak currency positions (JPY, AUD, CAD, CHF, EUR) that saw a little turnaround for the week in their speculator bets while the extremely strong Mexican peso saw a little slide in its bullishness. The US dollar continues to remain in a strong speculative position overall versus just about all of the major currencies except the peso.
Here is this week’s COT currency roundup:
The British pound sterling speculator was one of the currencies that saw a weaker position on the week and contracts have now fallen for two consecutive weeks. The GBP bets have also dropped in six out of the last 7 weeks for a total 7-week change of -99,441 contracts — illuminating the deteriorating sentiment for the GBP. This has dropped the current speculator contract level to a new lowpoint since January 2023.
The Euro bounced back very slightly this week with a gain of +3,212 contracts. The overall net position, however, is now in bearish territory for a second straight week. This is the first time the Euro contracts have been bearish since September of 2022.
The Canadian dollar speculative position has bounced back with two weeks of gains following eight straight weeks of declines. The overall net position (currently at -63,201 contracts) remains extremely bearish with the current strength level at 15 percent of the past three-years range of positions.
Swiss franc speculator positions remain extremely bearish (1 percent strength score) and the overall net speculator position is greater than -40,000 contracts for a second consecutive week. The franc spec positioning is at the lowest levels since 2019.
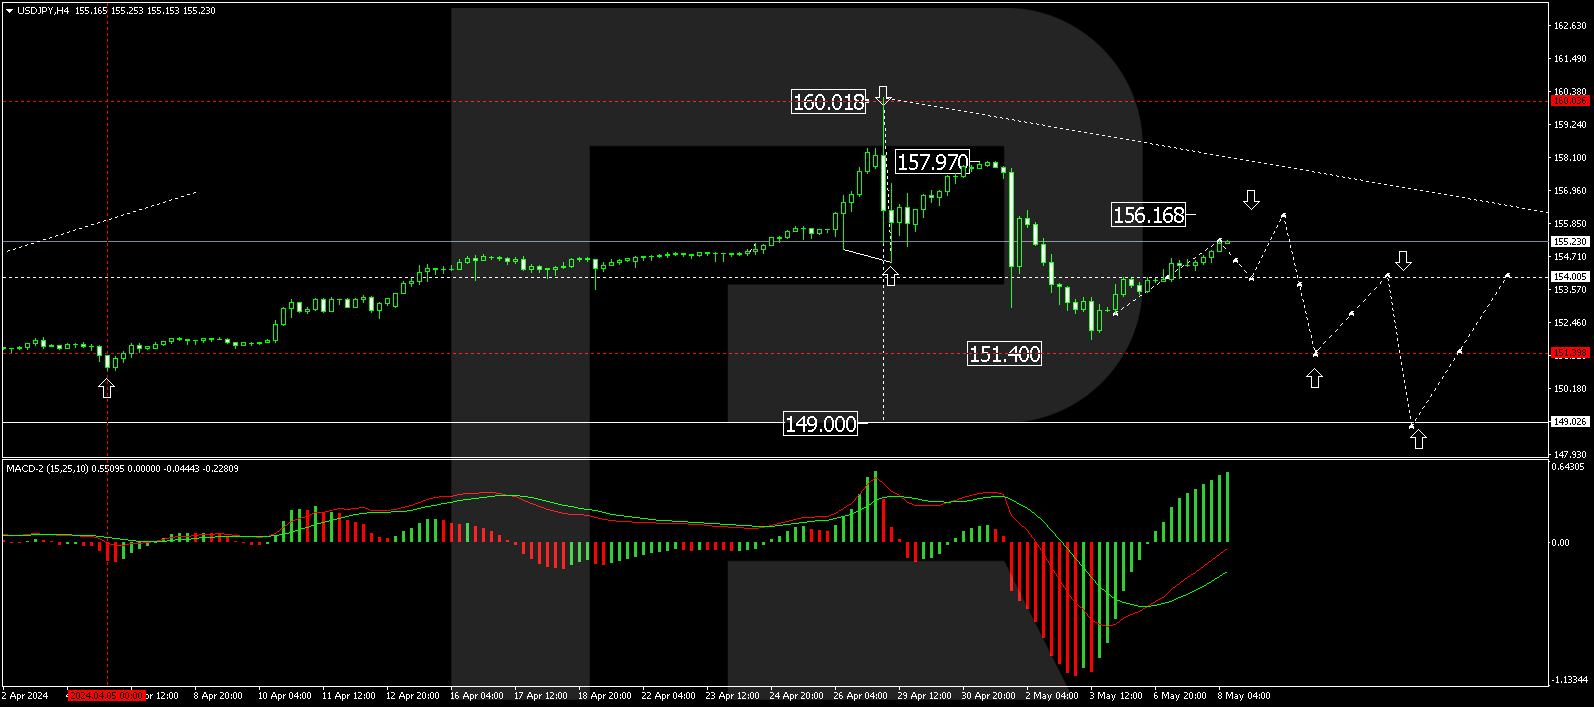
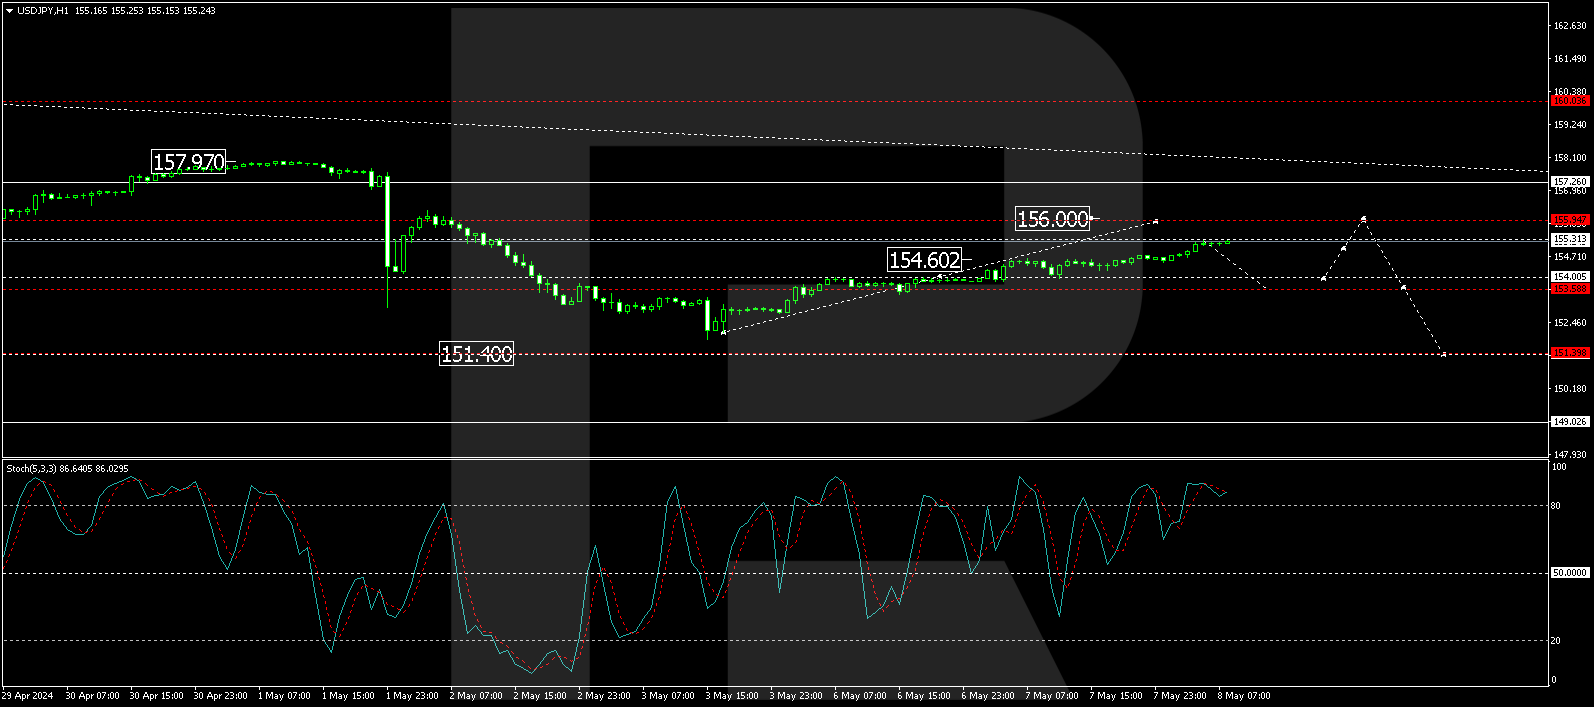
The Japanese yen contracts got a little relief this week from the continued downtrend with a rise of +11,531 contracts. Previously, the JPY contracts had dropped in 13 out of 15 weeks for a -123,970 contract decline over those 15 weeks. The current speculative sentiment remains near the lowest standing since 2007. The Japanese authorities likely intervened in the currency markets earlier this week in order to pause the steep decline in the yen and the yen managed to end the week higher by approximately 3 percent vs the USD.
The Australian dollar speculator position saw improvement for a second straight week this week with a gain of +13,004 contracts through Tuesday. The Aussie spec position and sentiment have been historically bearish over the past few months with an all-time record low position reached on March 19th at a total of -107,538 contracts. The current positioning level sits at -83,235 contracts.
The Mexican Peso remains the one strong currency in the mix against the US dollar. The MXN speculative position has fallen for three straight weeks but remains in a very strong position with a current total of +119,045 contracts. The MXN speculator level has remained above the +100,000 level for nine consecutive weeks which is the first time that type of streak has taken place since late-2019 into early-2020. The MXN exchange rate versus the USD has experienced a pullback over the past month but remains slightly higher for 2024 so far and closed this week higher by over 1 percent.
Currencies Net Speculators Leaderboard
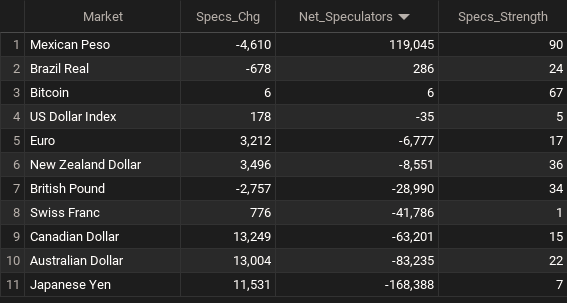
Legend: Weekly Speculators Change | Speculators Current Net Position | Speculators Strength Score compared to last 3-Years (0-100 range)
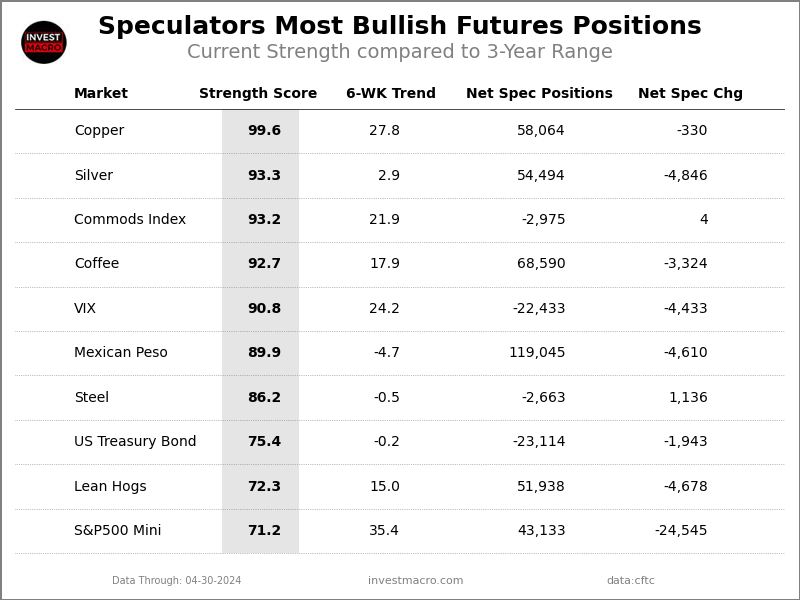
Strength Scores led by Mexican Peso & Bitcoin
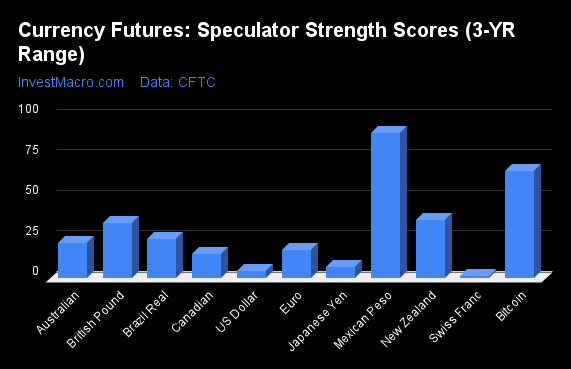
COT Strength Scores (a normalized measure of Speculator positions over a 3-Year range, from 0 to 100 where above 80 is Extreme-Bullish and below 20 is Extreme-Bearish) showed that the Mexican Peso (90 percent) and Bitcoin (66 percent) lead the currency markets this week.
On the downside, the Swiss Franc (1 percent), the US Dollar Index (5 percent), the Japanese Yen (7 percent), the Canadian Dollar (15 percent) and the EuroFX (17 percent) come in at the lowest strength levels currently and are in Extreme-Bearish territory (below 20 percent).
Strength Statistics:
US Dollar Index (4.8 percent) vs US Dollar Index previous week (4.4 percent)
EuroFX (17.4 percent) vs EuroFX previous week (16.1 percent)
British Pound Sterling (34.1 percent) vs British Pound Sterling previous week (35.9 percent)
Japanese Yen (7.2 percent) vs Japanese Yen previous week (0.0 percent)
Swiss Franc (1.4 percent) vs Swiss Franc previous week (0.0 percent)
Canadian Dollar (14.9 percent) vs Canadian Dollar previous week (4.8 percent)
Australian Dollar (22.0 percent) vs Australian Dollar previous week (10.2 percent)
New Zealand Dollar (36.1 percent) vs New Zealand Dollar previous week (26.2 percent)
Mexican Peso (89.9 percent) vs Mexican Peso previous week (92.1 percent)
Brazilian Real (24.1 percent) vs Brazilian Real previous week (25.2 percent)
Bitcoin (66.5 percent) vs Bitcoin previous week (66.4 percent)
Bitcoin & Australian Dollar top the 6-Week Strength Trends
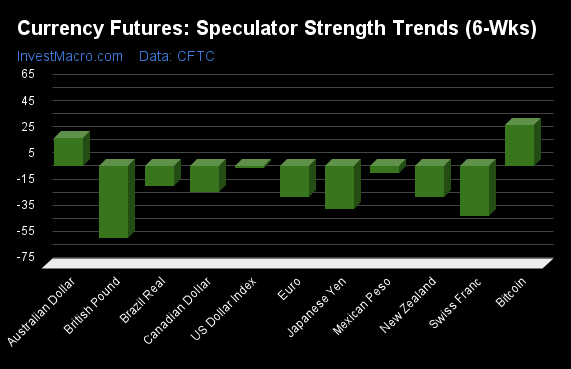
COT Strength Score Trends (or move index, calculates the 6-week changes in strength scores) showed that the Bitcoin (32 percent) and the Australian Dollar (22 percent) lead the past six weeks trends and are the only positive movers for the currencies.
The British Pound (-54 percent) leads the downside trend scores currently with the Swiss Franc (-38 percent), Japanese Yen (-33 percent) and the New Zealand Dollar (-24 percent) following next with lower trend scores.
Strength Trend Statistics:
US Dollar Index (-1.5 percent) vs US Dollar Index previous week (-13.5 percent)
EuroFX (-23.5 percent) vs EuroFX previous week (-35.9 percent)
British Pound Sterling (-54.5 percent) vs British Pound Sterling previous week (-64.1 percent)
Japanese Yen (-32.8 percent) vs Japanese Yen previous week (-48.5 percent)
Swiss Franc (-37.9 percent) vs Swiss Franc previous week (-44.0 percent)
Canadian Dollar (-19.8 percent) vs Canadian Dollar previous week (-34.6 percent)
Australian Dollar (22.0 percent) vs Australian Dollar previous week (-4.9 percent)
New Zealand Dollar (-23.7 percent) vs New Zealand Dollar previous week (-41.2 percent)
Mexican Peso (-4.7 percent) vs Mexican Peso previous week (9.5 percent)
Brazilian Real (-15.1 percent) vs Brazilian Real previous week (-11.7 percent)
Bitcoin (31.6 percent) vs Bitcoin previous week (15.0 percent)
Individual COT Forex Markets:
US Dollar Index Futures:
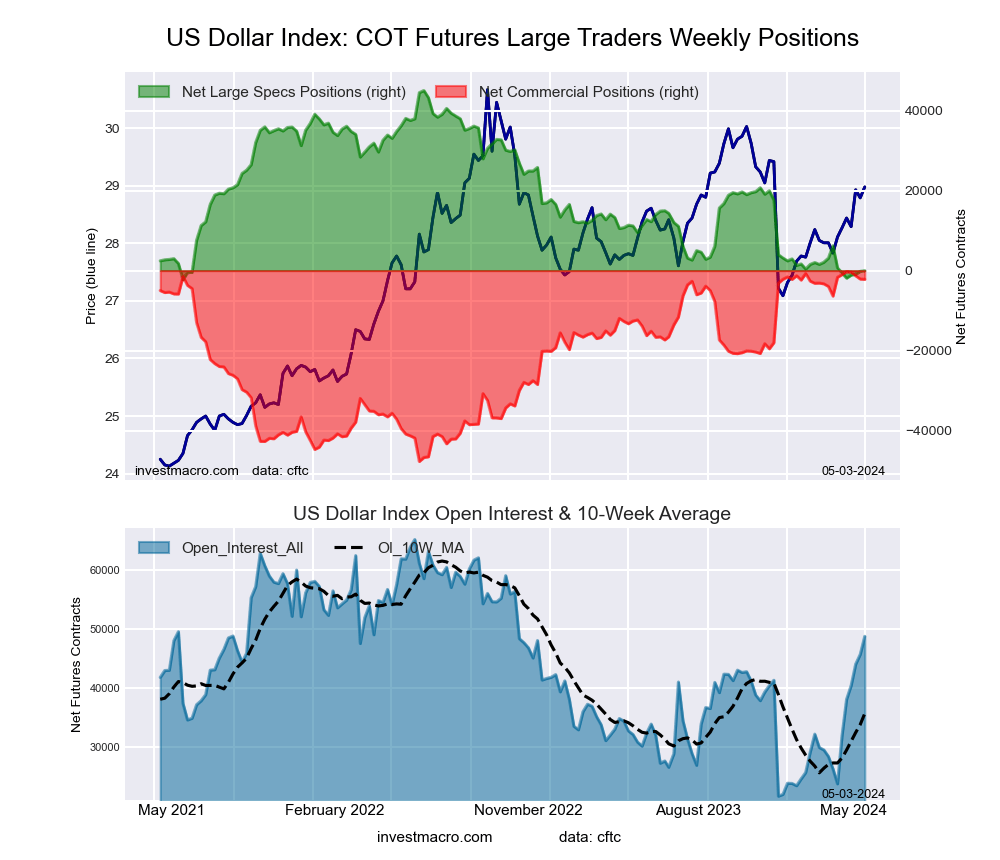 The US Dollar Index large speculator standing this week totaled a net position of -35 contracts in the data reported through Tuesday. This was a weekly increase of 178 contracts from the previous week which had a total of -213 net contracts.
This week’s current strength score (the trader positioning range over the past three years, measured from 0 to 100) shows the speculators are currently Bearish-Extreme with a score of 4.8 percent. The commercials are Bullish-Extreme with a score of 96.0 percent and the small traders (not shown in chart) are Bearish with a score of 37.1 percent.
Price Trend-Following Model: Uptrend
Our weekly trend-following model classifies the current market price position as: Uptrend. The current action for the model is considered to be: Hold – Maintain Long Position.
| US DOLLAR INDEX Statistics | SPECULATORS | COMMERCIALS | SMALL TRADERS |
| – Percent of Open Interest Longs: | 68.9 | 20.3 | 9.0 |
| – Percent of Open Interest Shorts: | 68.9 | 24.8 | 4.5 |
| – Net Position: | -35 | -2,189 | 2,224 |
| – Gross Longs: | 33,593 | 9,894 | 4,410 |
| – Gross Shorts: | 33,628 | 12,083 | 2,186 |
| – Long to Short Ratio: | 1.0 to 1 | 0.8 to 1 | 2.0 to 1 |
| NET POSITION TREND: | | | |
| – Strength Index Score (3 Year Range Pct): | 4.8 | 96.0 | 37.1 |
| – Strength Index Reading (3 Year Range): | Bearish-Extreme | Bullish-Extreme | Bearish |
| NET POSITION MOVEMENT INDEX: | | | |
| – 6-Week Change in Strength Index: | -1.5 | -1.0 | 14.1 |
Euro Currency Futures:
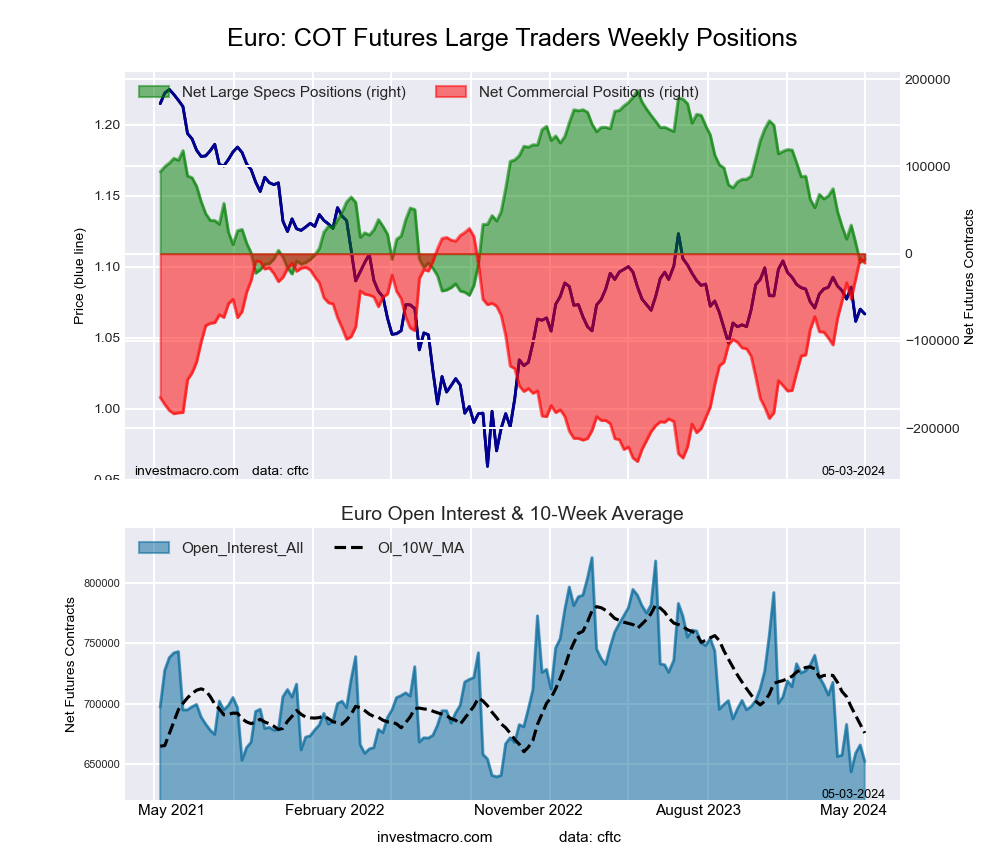 The Euro Currency large speculator standing this week totaled a net position of -6,777 contracts in the data reported through Tuesday. This was a weekly advance of 3,212 contracts from the previous week which had a total of -9,989 net contracts.
This week’s current strength score (the trader positioning range over the past three years, measured from 0 to 100) shows the speculators are currently Bearish-Extreme with a score of 17.4 percent. The commercials are Bullish-Extreme with a score of 85.2 percent and the small traders (not shown in chart) are Bearish-Extreme with a score of 6.9 percent.
Price Trend-Following Model: Downtrend
Our weekly trend-following model classifies the current market price position as: Downtrend. The current action for the model is considered to be: Hold – Maintain Short Position.
| EURO Currency Statistics | SPECULATORS | COMMERCIALS | SMALL TRADERS |
| – Percent of Open Interest Longs: | 25.6 | 61.2 | 11.2 |
| – Percent of Open Interest Shorts: | 26.7 | 62.8 | 8.5 |
| – Net Position: | -6,777 | -10,737 | 17,514 |
| – Gross Longs: | 167,185 | 399,163 | 73,035 |
| – Gross Shorts: | 173,962 | 409,900 | 55,521 |
| – Long to Short Ratio: | 1.0 to 1 | 1.0 to 1 | 1.3 to 1 |
| NET POSITION TREND: | | | |
| – Strength Index Score (3 Year Range Pct): | 17.4 | 85.2 | 6.9 |
| – Strength Index Reading (3 Year Range): | Bearish-Extreme | Bullish-Extreme | Bearish-Extreme |
| NET POSITION MOVEMENT INDEX: | | | |
| – 6-Week Change in Strength Index: | -23.5 | 23.7 | -13.2 |
British Pound Sterling Futures:
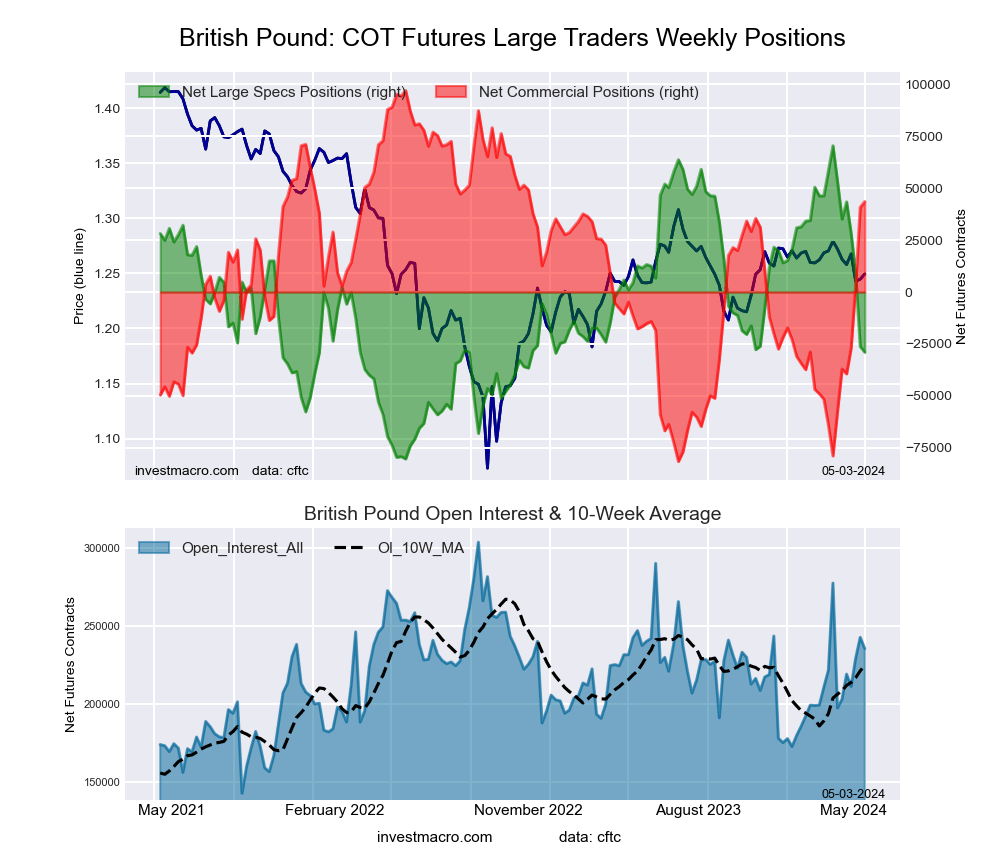 The British Pound Sterling large speculator standing this week totaled a net position of -28,990 contracts in the data reported through Tuesday. This was a weekly lowering of -2,757 contracts from the previous week which had a total of -26,233 net contracts.
This week’s current strength score (the trader positioning range over the past three years, measured from 0 to 100) shows the speculators are currently Bearish with a score of 34.1 percent. The commercials are Bullish with a score of 70.1 percent and the small traders (not shown in chart) are Bearish with a score of 29.4 percent.
Price Trend-Following Model: Downtrend
Our weekly trend-following model classifies the current market price position as: Downtrend. The current action for the model is considered to be: Hold – Maintain Short Position.
| BRITISH POUND Statistics | SPECULATORS | COMMERCIALS | SMALL TRADERS |
| – Percent of Open Interest Longs: | 18.5 | 68.9 | 9.0 |
| – Percent of Open Interest Shorts: | 30.8 | 50.4 | 15.2 |
| – Net Position: | -28,990 | 43,560 | -14,570 |
| – Gross Longs: | 43,668 | 162,366 | 21,215 |
| – Gross Shorts: | 72,658 | 118,806 | 35,785 |
| – Long to Short Ratio: | 0.6 to 1 | 1.4 to 1 | 0.6 to 1 |
| NET POSITION TREND: | | | |
| – Strength Index Score (3 Year Range Pct): | 34.1 | 70.1 | 29.4 |
| – Strength Index Reading (3 Year Range): | Bearish | Bullish | Bearish |
| NET POSITION MOVEMENT INDEX: | | | |
| – 6-Week Change in Strength Index: | -54.5 | 56.6 | -37.2 |
Japanese Yen Futures:
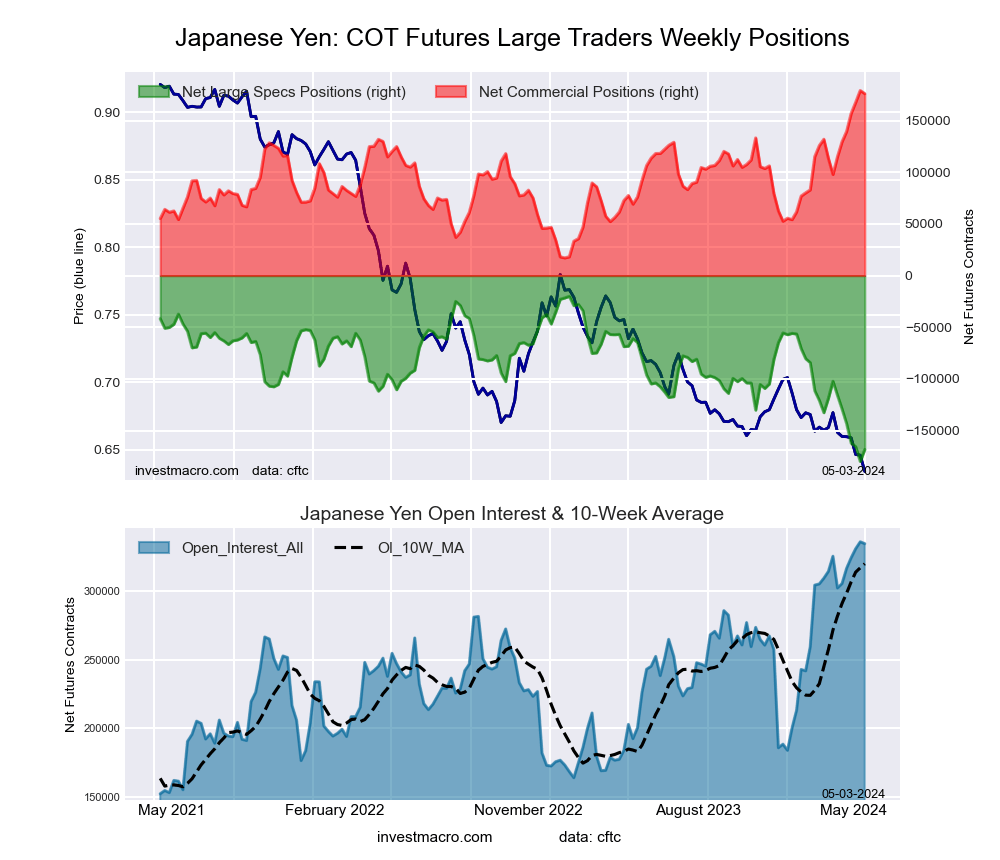 The Japanese Yen large speculator standing this week totaled a net position of -168,388 contracts in the data reported through Tuesday. This was a weekly rise of 11,531 contracts from the previous week which had a total of -179,919 net contracts.
This week’s current strength score (the trader positioning range over the past three years, measured from 0 to 100) shows the speculators are currently Bearish-Extreme with a score of 7.2 percent. The commercials are Bullish-Extreme with a score of 98.1 percent and the small traders (not shown in chart) are Bullish with a score of 58.3 percent.
Price Trend-Following Model: Downtrend
Our weekly trend-following model classifies the current market price position as: Downtrend. The current action for the model is considered to be: Hold – Maintain Short Position.
| JAPANESE YEN Statistics | SPECULATORS | COMMERCIALS | SMALL TRADERS |
| – Percent of Open Interest Longs: | 12.1 | 73.1 | 12.5 |
| – Percent of Open Interest Shorts: | 62.4 | 20.5 | 14.8 |
| – Net Position: | -168,388 | 176,122 | -7,734 |
| – Gross Longs: | 40,435 | 244,920 | 41,917 |
| – Gross Shorts: | 208,823 | 68,798 | 49,651 |
| – Long to Short Ratio: | 0.2 to 1 | 3.6 to 1 | 0.8 to 1 |
| NET POSITION TREND: | | | |
| – Strength Index Score (3 Year Range Pct): | 7.2 | 98.1 | 58.3 |
| – Strength Index Reading (3 Year Range): | Bearish-Extreme | Bullish-Extreme | Bullish |
| NET POSITION MOVEMENT INDEX: | | | |
| – 6-Week Change in Strength Index: | -32.8 | 37.7 | -27.1 |
Swiss Franc Futures:
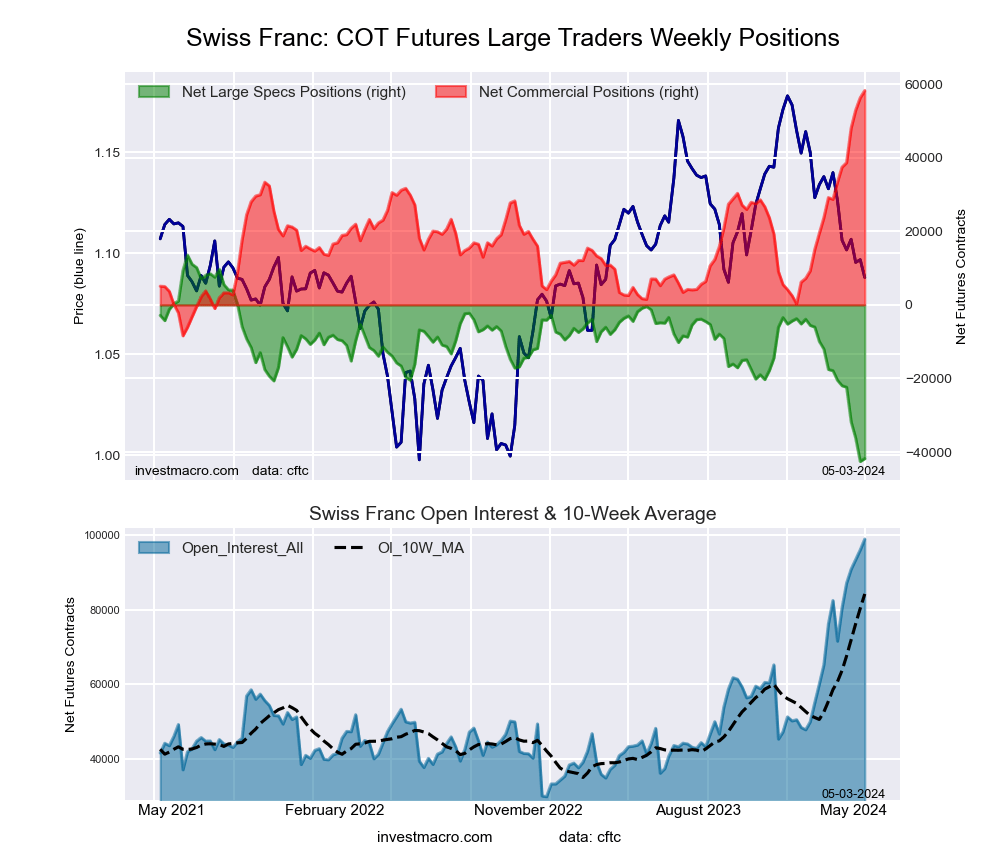 The Swiss Franc large speculator standing this week totaled a net position of -41,786 contracts in the data reported through Tuesday. This was a weekly gain of 776 contracts from the previous week which had a total of -42,562 net contracts.
This week’s current strength score (the trader positioning range over the past three years, measured from 0 to 100) shows the speculators are currently Bearish-Extreme with a score of 1.4 percent. The commercials are Bullish-Extreme with a score of 100.0 percent and the small traders (not shown in chart) are Bearish-Extreme with a score of 2.2 percent.
Price Trend-Following Model: Downtrend
Our weekly trend-following model classifies the current market price position as: Downtrend. The current action for the model is considered to be: Hold – Maintain Short Position.
| SWISS FRANC Statistics | SPECULATORS | COMMERCIALS | SMALL TRADERS |
| – Percent of Open Interest Longs: | 11.2 | 79.3 | 9.2 |
| – Percent of Open Interest Shorts: | 53.4 | 20.4 | 25.9 |
| – Net Position: | -41,786 | 58,283 | -16,497 |
| – Gross Longs: | 11,040 | 78,446 | 9,120 |
| – Gross Shorts: | 52,826 | 20,163 | 25,617 |
| – Long to Short Ratio: | 0.2 to 1 | 3.9 to 1 | 0.4 to 1 |
| NET POSITION TREND: | | | |
| – Strength Index Score (3 Year Range Pct): | 1.4 | 100.0 | 2.2 |
| – Strength Index Reading (3 Year Range): | Bearish-Extreme | Bullish-Extreme | Bearish-Extreme |
| NET POSITION MOVEMENT INDEX: | | | |
| – 6-Week Change in Strength Index: | -37.9 | 37.3 | -16.4 |
Canadian Dollar Futures:
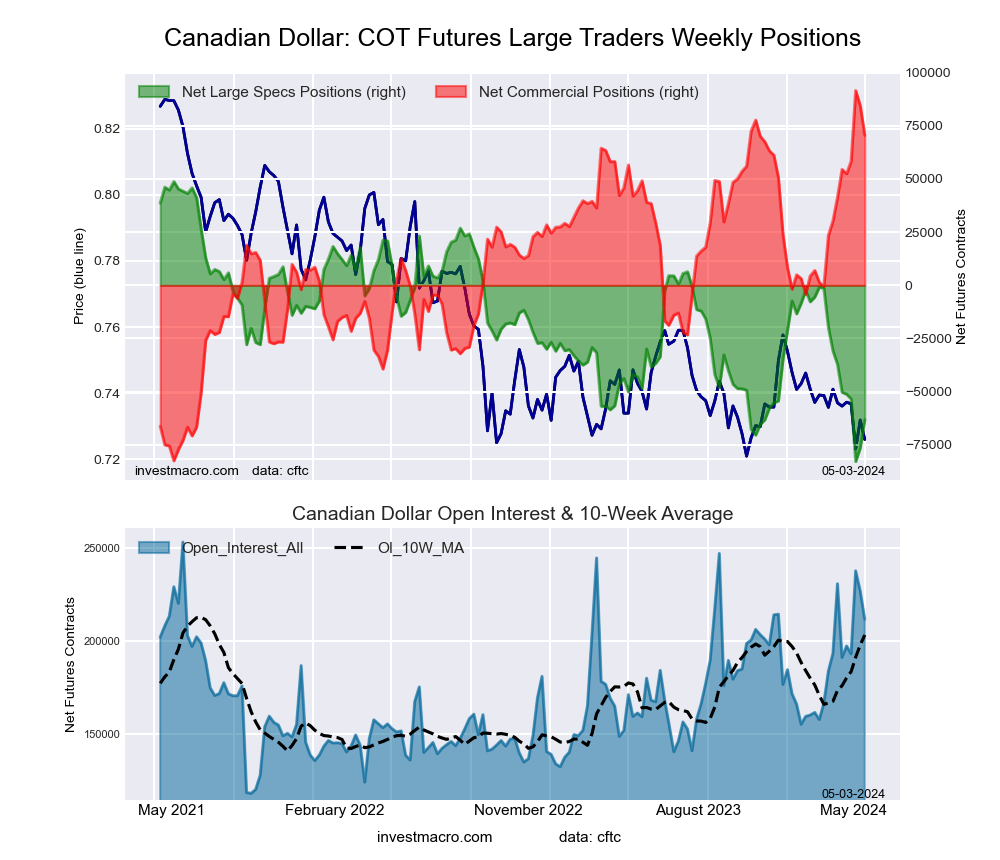 The Canadian Dollar large speculator standing this week totaled a net position of -63,201 contracts in the data reported through Tuesday. This was a weekly advance of 13,249 contracts from the previous week which had a total of -76,450 net contracts.
This week’s current strength score (the trader positioning range over the past three years, measured from 0 to 100) shows the speculators are currently Bearish-Extreme with a score of 14.9 percent. The commercials are Bullish-Extreme with a score of 87.9 percent and the small traders (not shown in chart) are Bearish-Extreme with a score of 6.8 percent.
Price Trend-Following Model: Downtrend
Our weekly trend-following model classifies the current market price position as: Downtrend. The current action for the model is considered to be: Hold – Maintain Short Position.
| CANADIAN DOLLAR Statistics | SPECULATORS | COMMERCIALS | SMALL TRADERS |
| – Percent of Open Interest Longs: | 16.0 | 68.2 | 13.4 |
| – Percent of Open Interest Shorts: | 45.8 | 34.9 | 16.8 |
| – Net Position: | -63,201 | 70,490 | -7,289 |
| – Gross Longs: | 33,793 | 144,359 | 28,321 |
| – Gross Shorts: | 96,994 | 73,869 | 35,610 |
| – Long to Short Ratio: | 0.3 to 1 | 2.0 to 1 | 0.8 to 1 |
| NET POSITION TREND: | | | |
| – Strength Index Score (3 Year Range Pct): | 14.9 | 87.9 | 6.8 |
| – Strength Index Reading (3 Year Range): | Bearish-Extreme | Bullish-Extreme | Bearish-Extreme |
| NET POSITION MOVEMENT INDEX: | | | |
| – 6-Week Change in Strength Index: | -19.8 | 16.7 | -6.8 |
Australian Dollar Futures:
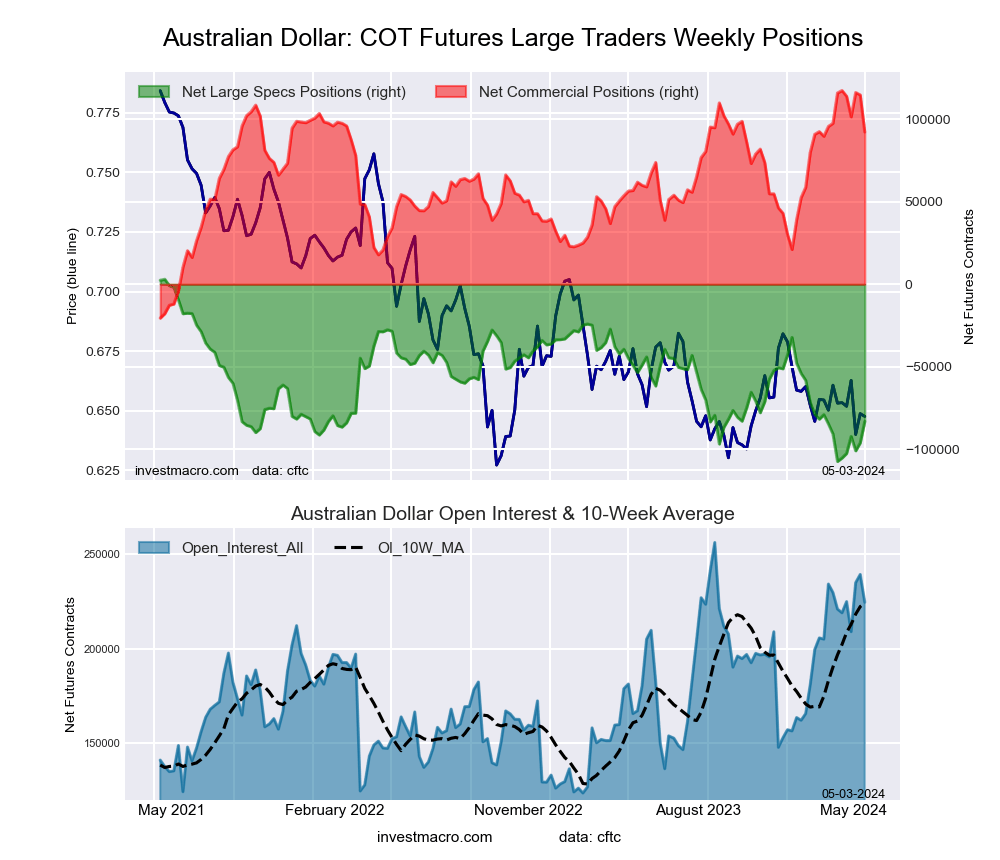 The Australian Dollar large speculator standing this week totaled a net position of -83,235 contracts in the data reported through Tuesday. This was a weekly lift of 13,004 contracts from the previous week which had a total of -96,239 net contracts.
This week’s current strength score (the trader positioning range over the past three years, measured from 0 to 100) shows the speculators are currently Bearish with a score of 22.0 percent. The commercials are Bullish-Extreme with a score of 81.8 percent and the small traders (not shown in chart) are Bearish with a score of 31.1 percent.
Price Trend-Following Model: Weak Downtrend
Our weekly trend-following model classifies the current market price position as: Weak Downtrend. The current action for the model is considered to be: Hold – Maintain Short Position.
| AUSTRALIAN DOLLAR Statistics | SPECULATORS | COMMERCIALS | SMALL TRADERS |
| – Percent of Open Interest Longs: | 18.4 | 70.2 | 9.2 |
| – Percent of Open Interest Shorts: | 55.5 | 29.0 | 13.3 |
| – Net Position: | -83,235 | 92,394 | -9,159 |
| – Gross Longs: | 41,293 | 157,629 | 20,613 |
| – Gross Shorts: | 124,528 | 65,235 | 29,772 |
| – Long to Short Ratio: | 0.3 to 1 | 2.4 to 1 | 0.7 to 1 |
| NET POSITION TREND: | | | |
| – Strength Index Score (3 Year Range Pct): | 22.0 | 81.8 | 31.1 |
| – Strength Index Reading (3 Year Range): | Bearish | Bullish-Extreme | Bearish |
| NET POSITION MOVEMENT INDEX: | | | |
| – 6-Week Change in Strength Index: | 22.0 | -17.1 | -1.6 |
New Zealand Dollar Futures:
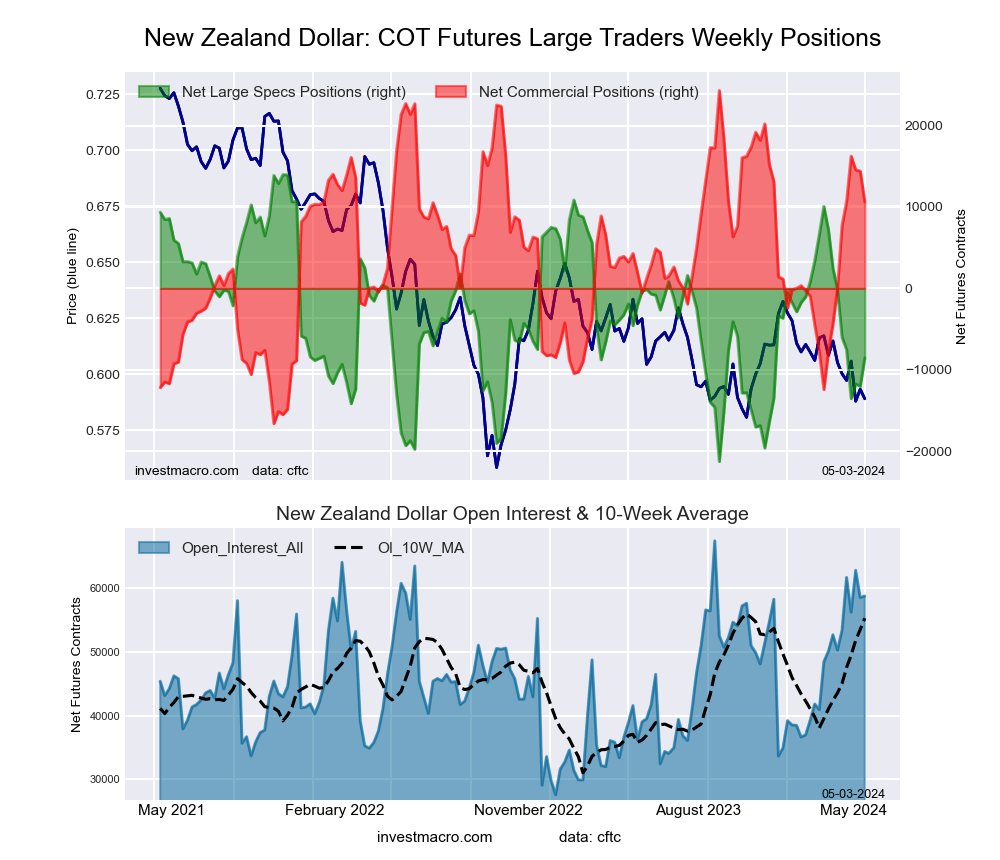 The New Zealand Dollar large speculator standing this week totaled a net position of -8,551 contracts in the data reported through Tuesday. This was a weekly boost of 3,496 contracts from the previous week which had a total of -12,047 net contracts.
This week’s current strength score (the trader positioning range over the past three years, measured from 0 to 100) shows the speculators are currently Bearish with a score of 36.1 percent. The commercials are Bullish with a score of 66.5 percent and the small traders (not shown in chart) are Bearish with a score of 27.7 percent.
Price Trend-Following Model: Downtrend
Our weekly trend-following model classifies the current market price position as: Downtrend. The current action for the model is considered to be: Hold – Maintain Short Position.
| NEW ZEALAND DOLLAR Statistics | SPECULATORS | COMMERCIALS | SMALL TRADERS |
| – Percent of Open Interest Longs: | 36.6 | 57.7 | 5.5 |
| – Percent of Open Interest Shorts: | 51.1 | 39.7 | 9.0 |
| – Net Position: | -8,551 | 10,607 | -2,056 |
| – Gross Longs: | 21,514 | 33,942 | 3,253 |
| – Gross Shorts: | 30,065 | 23,335 | 5,309 |
| – Long to Short Ratio: | 0.7 to 1 | 1.5 to 1 | 0.6 to 1 |
| NET POSITION TREND: | | | |
| – Strength Index Score (3 Year Range Pct): | 36.1 | 66.5 | 27.7 |
| – Strength Index Reading (3 Year Range): | Bearish | Bullish | Bearish |
| NET POSITION MOVEMENT INDEX: | | | |
| – 6-Week Change in Strength Index: | -23.7 | 25.9 | -29.0 |
Mexican Peso Futures:
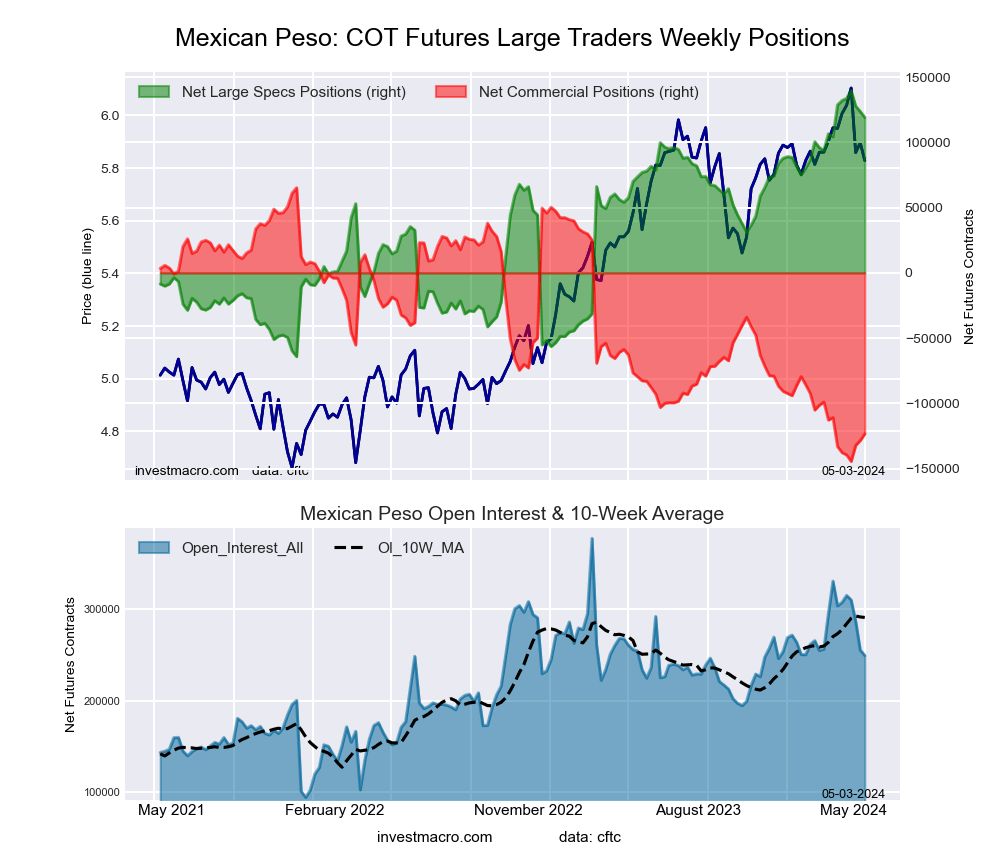 The Mexican Peso large speculator standing this week totaled a net position of 119,045 contracts in the data reported through Tuesday. This was a weekly decline of -4,610 contracts from the previous week which had a total of 123,655 net contracts.
This week’s current strength score (the trader positioning range over the past three years, measured from 0 to 100) shows the speculators are currently Bullish-Extreme with a score of 89.9 percent. The commercials are Bearish-Extreme with a score of 10.1 percent and the small traders (not shown in chart) are Bearish with a score of 38.5 percent.
Price Trend-Following Model: Weak Uptrend
Our weekly trend-following model classifies the current market price position as: Weak Uptrend. The current action for the model is considered to be: Hold – Maintain Long Position.
| MEXICAN PESO Statistics | SPECULATORS | COMMERCIALS | SMALL TRADERS |
| – Percent of Open Interest Longs: | 58.1 | 38.4 | 2.9 |
| – Percent of Open Interest Shorts: | 10.3 | 87.9 | 1.2 |
| – Net Position: | 119,045 | -123,325 | 4,280 |
| – Gross Longs: | 144,679 | 95,715 | 7,175 |
| – Gross Shorts: | 25,634 | 219,040 | 2,895 |
| – Long to Short Ratio: | 5.6 to 1 | 0.4 to 1 | 2.5 to 1 |
| NET POSITION TREND: | | | |
| – Strength Index Score (3 Year Range Pct): | 89.9 | 10.1 | 38.5 |
| – Strength Index Reading (3 Year Range): | Bullish-Extreme | Bearish-Extreme | Bearish |
| NET POSITION MOVEMENT INDEX: | | | |
| – 6-Week Change in Strength Index: | -4.7 | 4.6 | -0.2 |
Brazilian Real Futures:
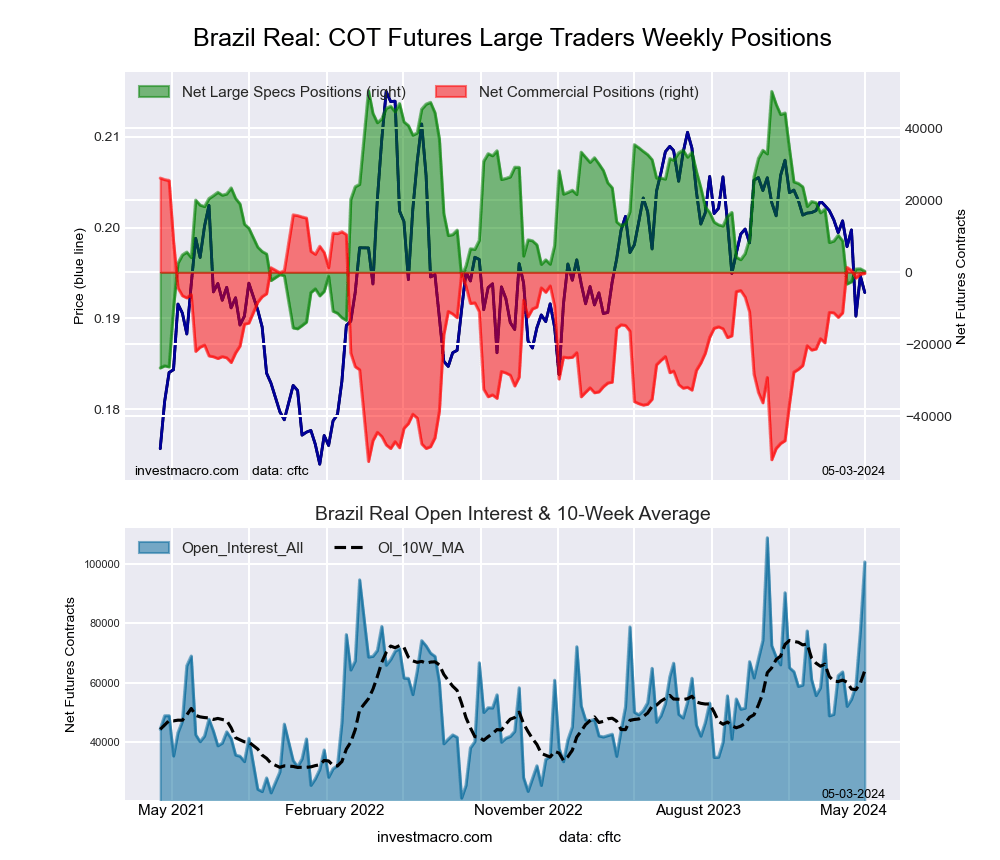 The Brazilian Real large speculator standing this week totaled a net position of 286 contracts in the data reported through Tuesday. This was a weekly fall of -678 contracts from the previous week which had a total of 964 net contracts.
This week’s current strength score (the trader positioning range over the past three years, measured from 0 to 100) shows the speculators are currently Bearish with a score of 24.1 percent. The commercials are Bullish with a score of 76.3 percent and the small traders (not shown in chart) are Bearish with a score of 34.8 percent.
Price Trend-Following Model: Downtrend
Our weekly trend-following model classifies the current market price position as: Downtrend. The current action for the model is considered to be: Hold – Maintain Short Position.
| BRAZIL REAL Statistics | SPECULATORS | COMMERCIALS | SMALL TRADERS |
| – Percent of Open Interest Longs: | 47.0 | 49.0 | 2.1 |
| – Percent of Open Interest Shorts: | 46.7 | 49.3 | 2.0 |
| – Net Position: | 286 | -321 | 35 |
| – Gross Longs: | 47,281 | 49,305 | 2,074 |
| – Gross Shorts: | 46,995 | 49,626 | 2,039 |
| – Long to Short Ratio: | 1.0 to 1 | 1.0 to 1 | 1.0 to 1 |
| NET POSITION TREND: | | | |
| – Strength Index Score (3 Year Range Pct): | 24.1 | 76.3 | 34.8 |
| – Strength Index Reading (3 Year Range): | Bearish | Bullish | Bearish |
| NET POSITION MOVEMENT INDEX: | | | |
| – 6-Week Change in Strength Index: | -15.1 | 17.8 | -20.3 |
Bitcoin Futures:
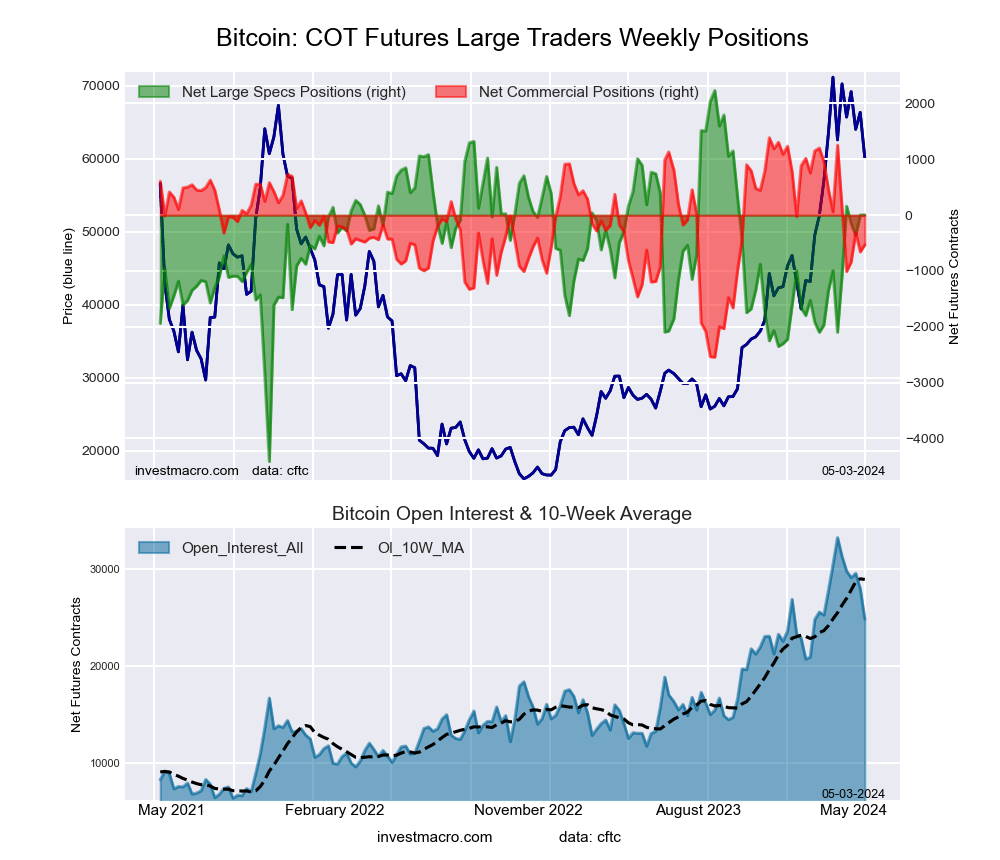 The Bitcoin large speculator standing this week totaled a net position of 6 contracts in the data reported through Tuesday. This was a weekly rise of 6 contracts from the previous week which had a total of 0 net contracts.
This week’s current strength score (the trader positioning range over the past three years, measured from 0 to 100) shows the speculators are currently Bullish with a score of 66.5 percent. The commercials are Bullish with a score of 51.2 percent and the small traders (not shown in chart) are Bearish with a score of 24.9 percent.
Price Trend-Following Model: Uptrend
Our weekly trend-following model classifies the current market price position as: Uptrend. The current action for the model is considered to be: Hold – Maintain Long Position.
| BITCOIN Statistics | SPECULATORS | COMMERCIALS | SMALL TRADERS |
| – Percent of Open Interest Longs: | 78.9 | 5.2 | 5.9 |
| – Percent of Open Interest Shorts: | 78.9 | 7.3 | 3.8 |
| – Net Position: | 6 | -530 | 524 |
| – Gross Longs: | 19,569 | 1,291 | 1,461 |
| – Gross Shorts: | 19,563 | 1,821 | 937 |
| – Long to Short Ratio: | 1.0 to 1 | 0.7 to 1 | 1.6 to 1 |
| NET POSITION TREND: | | | |
| – Strength Index Score (3 Year Range Pct): | 66.5 | 51.2 | 24.9 |
| – Strength Index Reading (3 Year Range): | Bullish | Bullish | Bearish |
| NET POSITION MOVEMENT INDEX: | | | |
| – 6-Week Change in Strength Index: | 31.6 | -45.4 | -7.3 |
Article By InvestMacro – Receive our weekly COT Newsletter
*COT Report: The COT data, released weekly to the public each Friday, is updated through the most recent Tuesday (data is 3 days old) and shows a quick view of how large speculators or non-commercials (for-profit traders) were positioned in the futures markets.
The CFTC categorizes trader positions according to commercial hedgers (traders who use futures contracts for hedging as part of the business), non-commercials (large traders who speculate to realize trading profits) and nonreportable traders (usually small traders/speculators) as well as their open interest (contracts open in the market at time of reporting). See CFTC criteria here.