
By RoboForex Analytical Department
The AUD/USD pair remains under pressure, hovering around 0.6528 on Friday. Earlier this week, the Australian dollar faced significant challenges, with a sharp decline against the USD. Efforts to stabilise the exchange rate have seen limited success thus far.
The stronger-than-expected economic data from the US has dampened hopes for extensive interest rate cuts by the Federal Reserve this year. The capital market currently anticipates only a 40-basis point reduction, a downgrade from the 60-75 basis points expected at the start of the week.
The Reserve Bank of Australia (RBA) is considering initiating its monetary easing policies towards the end of 2024. However, Australia’s robust employment market and persistent consumer inflation complicate these plans. Recent data indicates that the unemployment rate dropped to 3.7% in February, the lowest since September 2023, while inflation remained steady at 3.4% for the third consecutive month.
A recent Westpac report highlights the RBA’s need for greater confidence in the inflation outlook before seriously contemplating a rate cut.
Technical analysis of AUD/USD
Free Reports:
 Download Our Metatrader 4 Indicators – Put Our Free MetaTrader 4 Custom Indicators on your charts when you join our Weekly Newsletter
 Get our Weekly Commitment of Traders Reports - See where the biggest traders (Hedge Funds and Commercial Hedgers) are positioned in the futures markets on a weekly basis.
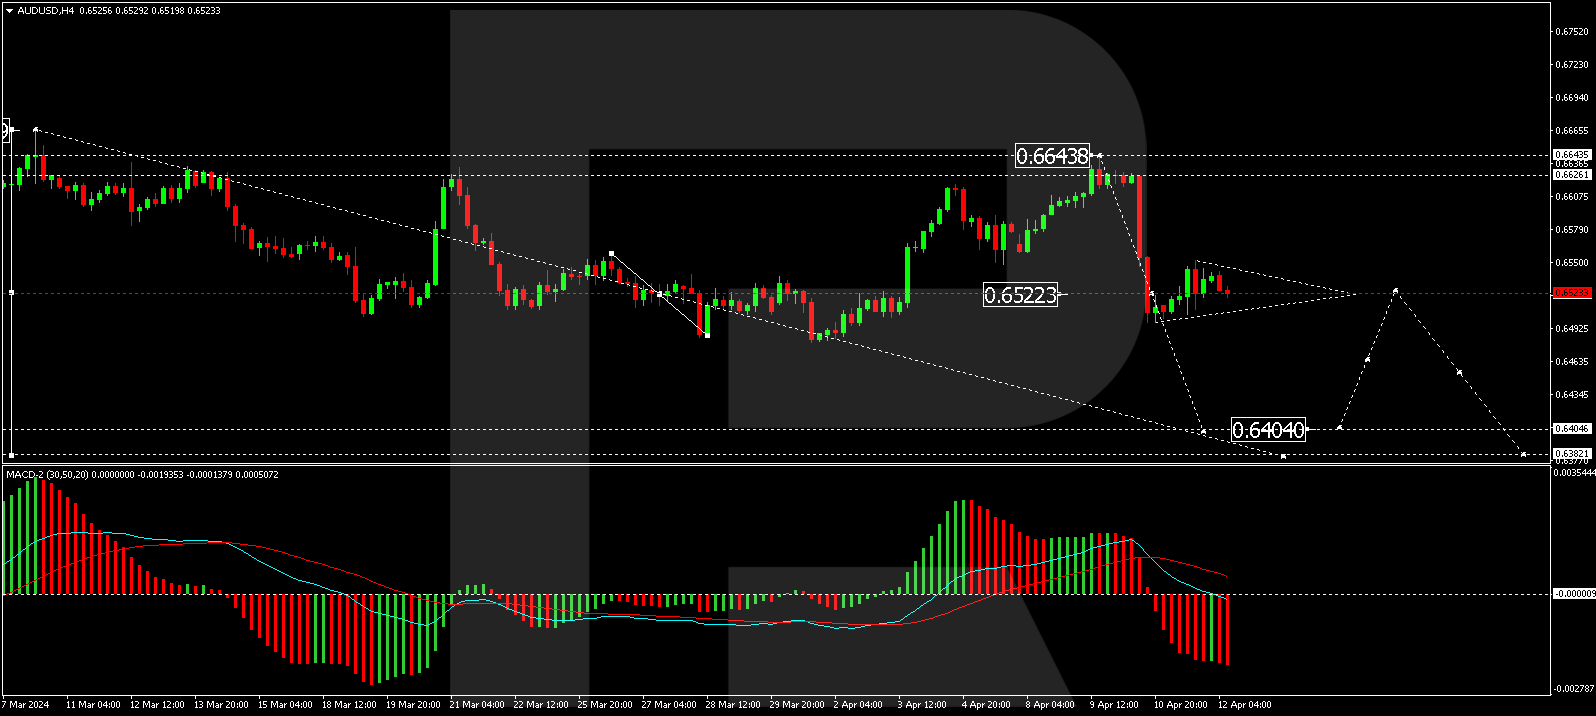
On the H4 chart, the AUD/USD is developing the fifth wave of decline towards 0.6832. The market has recently experienced a decline to 0.6498. A consolidation range is forming above this level today. If the pair exits this range upward, a corrective move to 0.6570 may occur. Conversely, a downward exit could lead to the continuation of the downward wave towards 0.6404. The MACD indicator supports this bearish outlook, with its signal line above zero but trending downwards sharply.
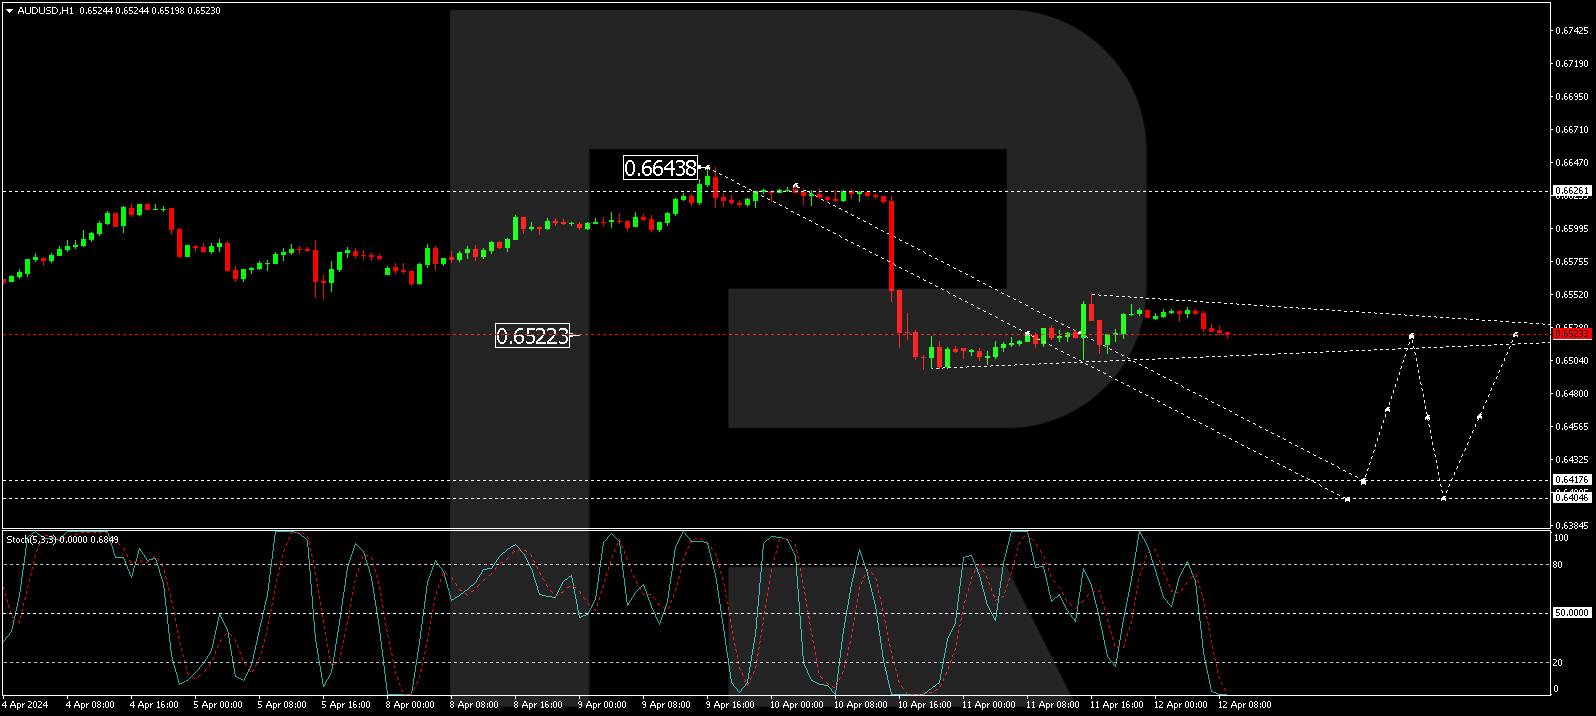
The H1 chart shows a consolidation around 0.6523. An upward breakout could lead to a correction towards 0.6570. A downward move from the range could initiate a further decline to 0.6420, potentially extending to 0.6404. The Stochastic oscillator, currently below 20, suggests a possible rise to 50, indicating potential short-term corrections within a broader downward trend.
Disclaimer
Any forecasts contained herein are based on the author’s particular opinion. This analysis may not be treated as trading advice. RoboForex bears no responsibility for trading results based on trading recommendations and reviews contained herein.

- COT Metals Charts: Speculator Bets led by Gold, Copper & Platinum Aug 9, 2026
- COT Bonds Charts: Speculator Bets led by 2-Year Bonds & US Treasury Bonds Aug 9, 2026
- COT Energy Charts: Speculator Bets led by Heating Oil & Bloomberg Index Aug 9, 2026
- COT Soft Commodities Charts: Speculator Bets led by Sugar & Cotton Aug 9, 2026
- The Central Bank of Mexico kept its interest rate unchanged. Iran plans to introduce strict bans for US and Israeli vessels in the Strait of Hormuz Aug 7, 2026
- USD/JPY Holds Firm: Yen Loses Some Support Aug 7, 2026
- Australian trade balance returned to positive territory Aug 6, 2026
- Results in Line for Most Reporting Companies Aug 5, 2026
- Stock indices continue to break records. Oil is falling amid intensified diplomatic dialogue between the US and Iran Aug 5, 2026
- USD/JPY Holds Steady After Intervention: Outlook Remains Uncertain Aug 5, 2026
