By InvestMacro
Here are the latest charts and statistics for the Commitment of Traders (COT) reports data published by the Commodities Futures Trading Commission (CFTC).
The latest COT data is updated through Tuesday April 30th and shows a quick view of how large traders (for-profit speculators and commercial hedgers) were positioned in the futures markets.
Weekly Speculator bets led lower by SOFR 3-Months & 10-Year Bonds
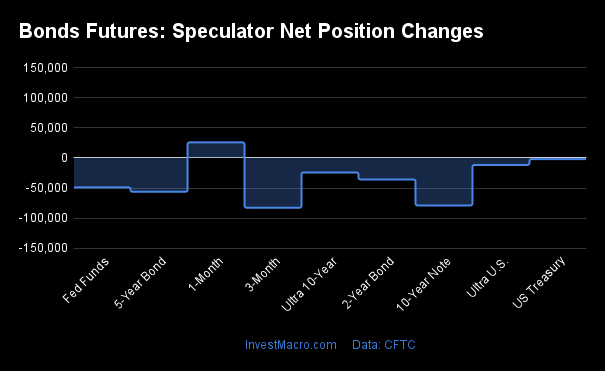
The COT bond market speculator bets were lower this week as eight out of the nine bond markets we cover had lower speculator contracts.
The only market with an increase in speculator bets this week was the 1-Month Secured Overnight Financing Rate (SOFR 1-Month) with a gain of 25,936 contracts.
Leading the declines for the bond markets was the SOFR 3-Months (-82,906 contracts), the 10-Year Bonds (-79,045 contracts), 5-Year Bonds (-56,309 contracts), and the Fed Funds (-48,918 contracts),the 2-Year Bonds (-35,717 contracts), the Ultra 10-Year Bonds (-24,156 contracts), the Ultra Treasury Bonds (-11,645 contracts) and with the US Treasury Bonds (-1,943 contracts) also registering lower bets on the week.
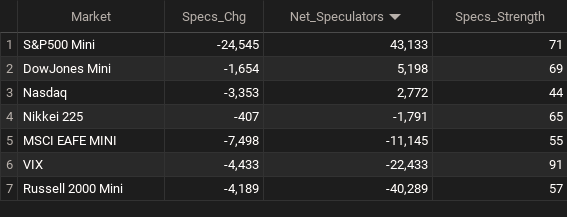
Bonds Net Speculators Leaderboard
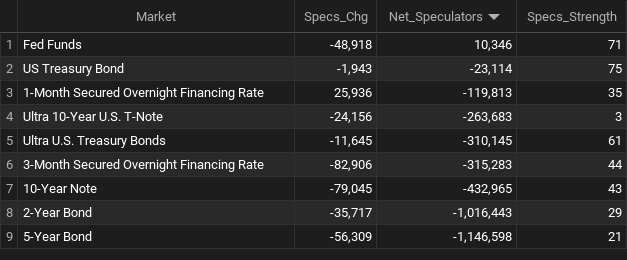
Legend: Weekly Speculators Change | Speculators Current Net Position | Speculators Strength Score compared to last 3-Years (0-100 range)
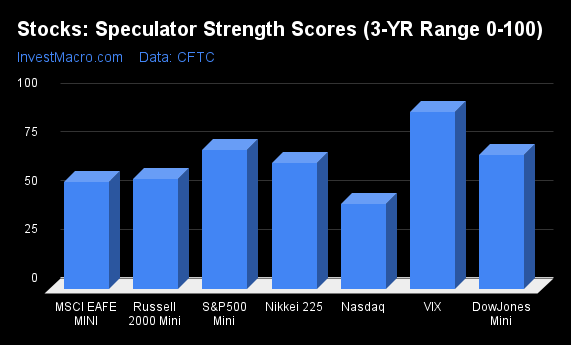
Strength Scores led by US Treasury Bonds & Fed Funds
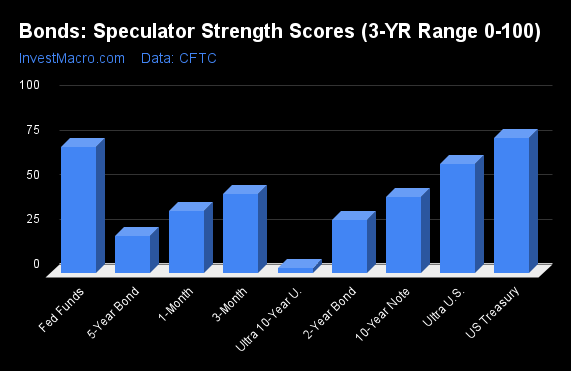
COT Strength Scores (a normalized measure of Speculator positions over a 3-Year range, from 0 to 100 where above 80 is Extreme-Bullish and below 20 is Extreme-Bearish) showed that the US Treasury Bonds (75 percent) and the Fed Funds (71 percent) lead the bond markets this week. The Ultra Treasury Bonds (61 percent) comes in as the next highest in the weekly strength scores.
On the downside, the Ultra 10-Year Bonds (3 percent) come in at the lowest strength level currently and is in Extreme-Bearish territory (below 20 percent). The next lowest strength scores were the 5-Year Bonds (21 percent), the 2-Year Bonds (29 percent) and the 10-Year Bonds (43 percent).
Strength Statistics:
Fed Funds (70.8 percent) vs Fed Funds previous week (81.2 percent)
2-Year Bond (29.4 percent) vs 2-Year Bond previous week (31.7 percent)
5-Year Bond (20.6 percent) vs 5-Year Bond previous week (24.2 percent)
10-Year Bond (42.6 percent) vs 10-Year Bond previous week (50.0 percent)
Ultra 10-Year Bond (2.9 percent) vs Ultra 10-Year Bond previous week (7.8 percent)
US Treasury Bond (75.4 percent) vs US Treasury Bond previous week (76.1 percent)
Ultra US Treasury Bond (60.9 percent) vs Ultra US Treasury Bond previous week (65.8 percent)
SOFR 3-Months (44.0 percent) vs SOFR 3-Months previous week (48.3 percent)
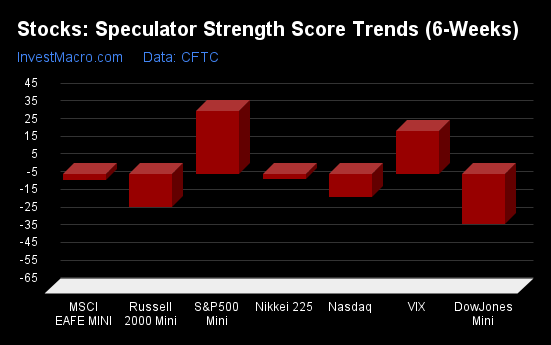
Fed Funds & 10-Year Bonds top the 6-Week Strength Trends
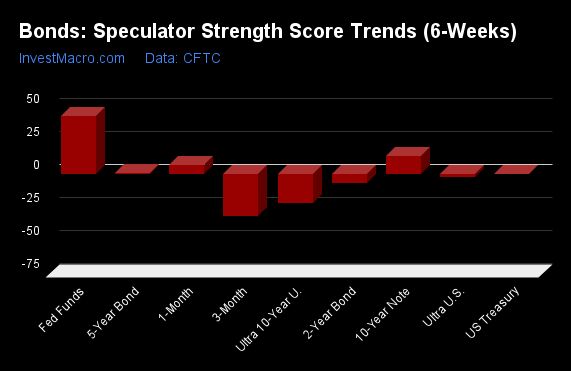
COT Strength Score Trends (or move index, calculates the 6-week changes in strength scores) showed that the Fed Funds (44 percent) and the 10-Year Bonds (13 percent) lead the past six weeks trends for bonds. The 5-Year Bonds (1 percent) is the next highest positive mover in the latest trends data.
The SOFR 3-Months (-32 percent) and the Ultra 10-Year Bonds (-22 percent) lead the downside trend scores currently with the 2-Year Bonds (-7 percent) and the Ultra Treasury Bonds (-2 percent) following next with lower trend scores.
Strength Trend Statistics:
Fed Funds (43.8 percent) vs Fed Funds previous week (54.5 percent)
2-Year Bond (-7.3 percent) vs 2-Year Bond previous week (-2.7 percent)
5-Year Bond (0.7 percent) vs 5-Year Bond previous week (11.0 percent)
10-Year Bond (13.2 percent) vs 10-Year Bond previous week (23.3 percent)
Ultra 10-Year Bond (-22.4 percent) vs Ultra 10-Year Bond previous week (-21.5 percent)
US Treasury Bond (-0.2 percent) vs US Treasury Bond previous week (11.6 percent)
Ultra US Treasury Bond (-2.3 percent) vs Ultra US Treasury Bond previous week (7.7 percent)
SOFR 3-Months (-31.9 percent) vs SOFR 3-Months previous week (-34.1 percent)
Secured Overnight Financing Rate (3-Month) Futures:
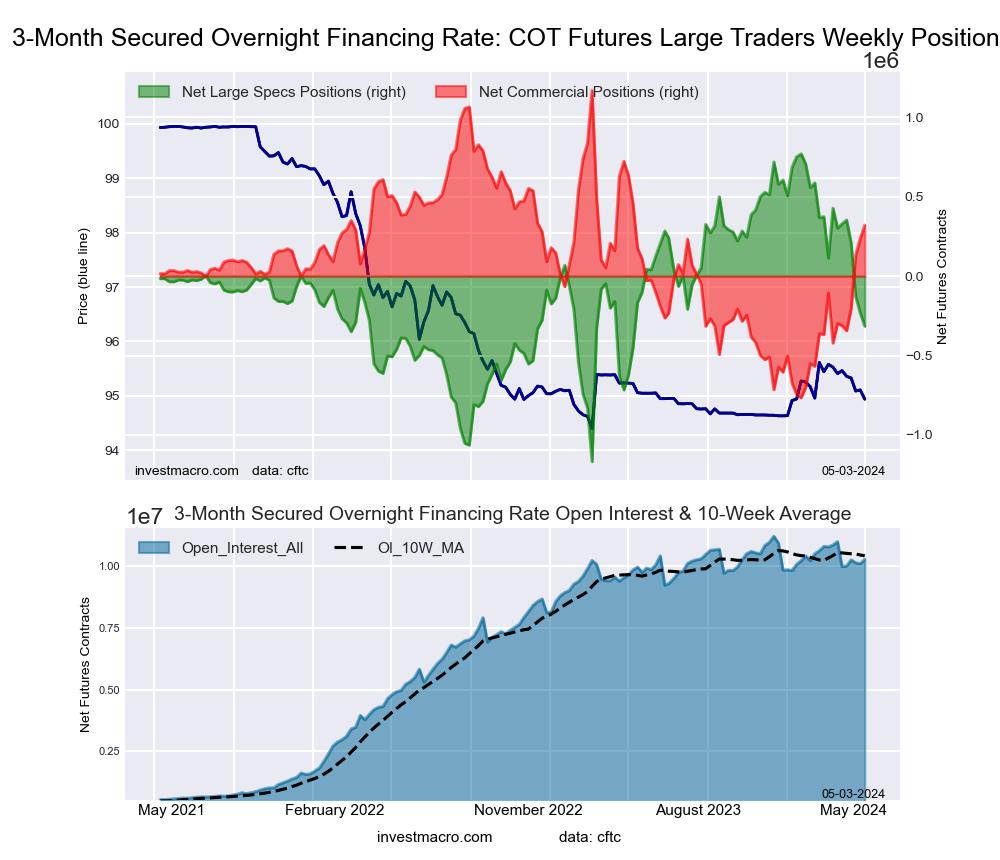 The Secured Overnight Financing Rate (3-Month) large speculator standing this week equaled a net position of -315,283 contracts in the data reported through Tuesday. This was a weekly reduction of -82,906 contracts from the previous week which had a total of -232,377 net contracts.
This week’s current strength score (the trader positioning range over the past three years, measured from 0 to 100) shows the speculators are currently Bearish with a score of 44.0 percent. The commercials are Bullish with a score of 56.2 percent and the small traders (not shown in chart) are Bullish-Extreme with a score of 85.0 percent.
Price Trend-Following Model: Weak Uptrend
Our weekly trend-following model classifies the current market price position as: Weak Uptrend. The current action for the model is considered to be: Hold – Maintain Long Position.
| SOFR 3-Months Statistics | SPECULATORS | COMMERCIALS | SMALL TRADERS |
| – Percent of Open Interest Longs: | 15.1 | 58.1 | 0.4 |
| – Percent of Open Interest Shorts: | 18.2 | 55.0 | 0.4 |
| – Net Position: | -315,283 | 320,426 | -5,143 |
| – Gross Longs: | 1,553,395 | 5,975,693 | 37,317 |
| – Gross Shorts: | 1,868,678 | 5,655,267 | 42,460 |
| – Long to Short Ratio: | 0.8 to 1 | 1.1 to 1 | 0.9 to 1 |
| NET POSITION TREND: | |||
| – Strength Index Score (3 Year Range Pct): | 44.0 | 56.2 | 85.0 |
| – Strength Index Reading (3 Year Range): | Bearish | Bullish | Bullish-Extreme |
| NET POSITION MOVEMENT INDEX: | |||
| – 6-Week Change in Strength Index: | -31.9 | 32.0 | -0.9 |
30-Day Federal Funds Futures:
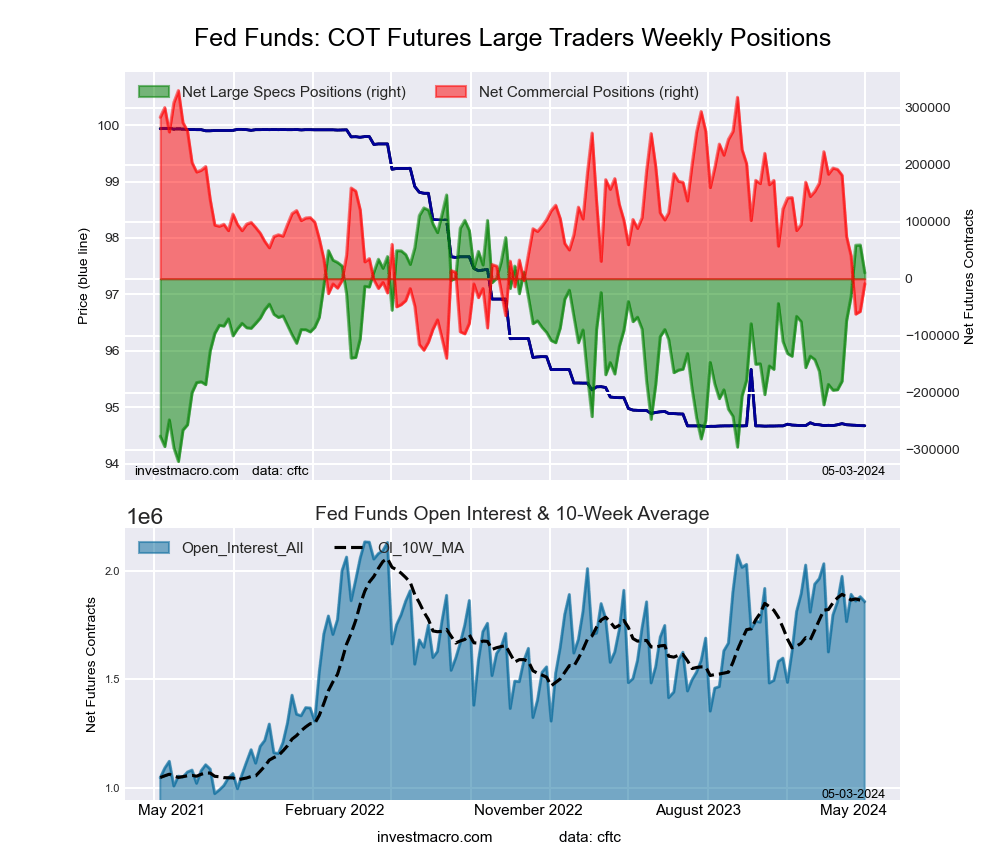 The 30-Day Federal Funds large speculator standing this week equaled a net position of 10,346 contracts in the data reported through Tuesday. This was a weekly decline of -48,918 contracts from the previous week which had a total of 59,264 net contracts.
This week’s current strength score (the trader positioning range over the past three years, measured from 0 to 100) shows the speculators are currently Bullish with a score of 70.8 percent. The commercials are Bearish with a score of 27.8 percent and the small traders (not shown in chart) are Bullish-Extreme with a score of 88.0 percent.
Price Trend-Following Model: Downtrend
Our weekly trend-following model classifies the current market price position as: Downtrend. The current action for the model is considered to be: Hold – Maintain Short Position.
| 30-Day Federal Funds Statistics | SPECULATORS | COMMERCIALS | SMALL TRADERS |
| – Percent of Open Interest Longs: | 18.4 | 63.0 | 2.1 |
| – Percent of Open Interest Shorts: | 17.9 | 63.5 | 2.2 |
| – Net Position: | 10,346 | -8,820 | -1,526 |
| – Gross Longs: | 342,285 | 1,170,635 | 38,611 |
| – Gross Shorts: | 331,939 | 1,179,455 | 40,137 |
| – Long to Short Ratio: | 1.0 to 1 | 1.0 to 1 | 1.0 to 1 |
| NET POSITION TREND: | |||
| – Strength Index Score (3 Year Range Pct): | 70.8 | 27.8 | 88.0 |
| – Strength Index Reading (3 Year Range): | Bullish | Bearish | Bullish-Extreme |
| NET POSITION MOVEMENT INDEX: | |||
| – 6-Week Change in Strength Index: | 43.8 | -42.7 | -8.5 |
2-Year Treasury Note Futures:
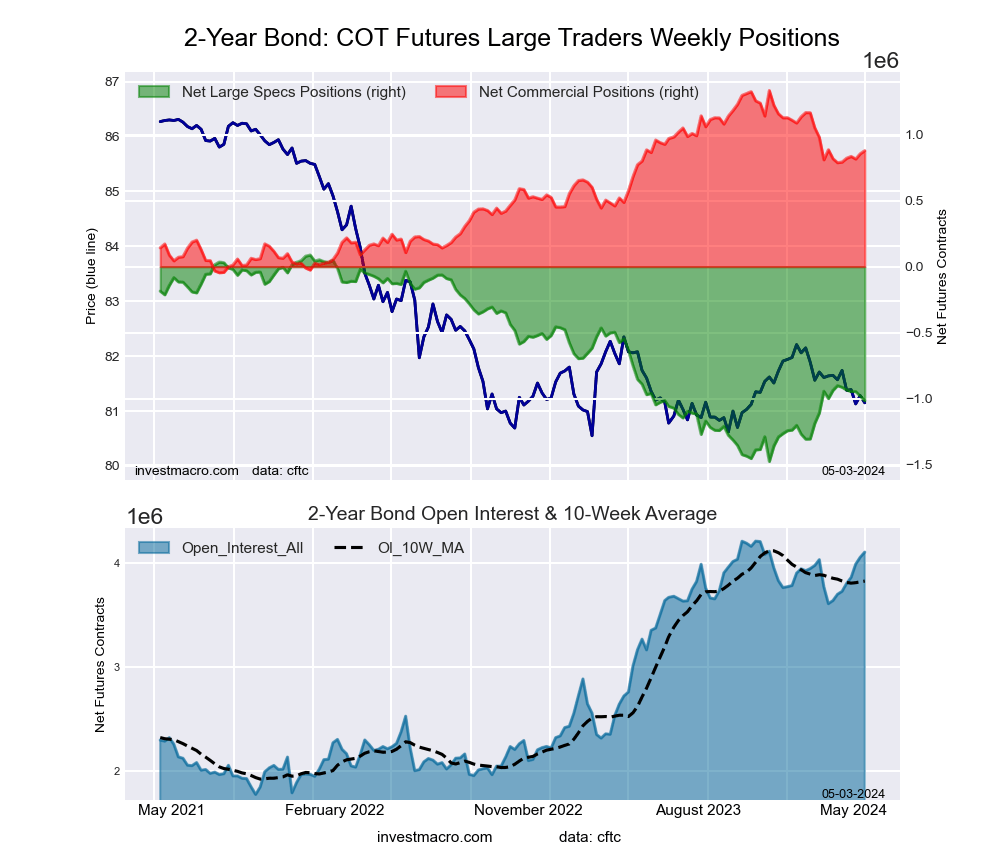 The 2-Year Treasury Note large speculator standing this week equaled a net position of -1,016,443 contracts in the data reported through Tuesday. This was a weekly decline of -35,717 contracts from the previous week which had a total of -980,726 net contracts.
This week’s current strength score (the trader positioning range over the past three years, measured from 0 to 100) shows the speculators are currently Bearish with a score of 29.4 percent. The commercials are Bullish with a score of 67.0 percent and the small traders (not shown in chart) are Bullish-Extreme with a score of 96.3 percent.
Price Trend-Following Model: Strong Downtrend
Our weekly trend-following model classifies the current market price position as: Strong Downtrend. The current action for the model is considered to be: Hold – Maintain Short Position.
| 2-Year Treasury Note Statistics | SPECULATORS | COMMERCIALS | SMALL TRADERS |
| – Percent of Open Interest Longs: | 11.9 | 80.2 | 6.5 |
| – Percent of Open Interest Shorts: | 36.6 | 58.7 | 3.1 |
| – Net Position: | -1,016,443 | 878,770 | 137,673 |
| – Gross Longs: | 487,267 | 3,289,154 | 265,541 |
| – Gross Shorts: | 1,503,710 | 2,410,384 | 127,868 |
| – Long to Short Ratio: | 0.3 to 1 | 1.4 to 1 | 2.1 to 1 |
| NET POSITION TREND: | |||
| – Strength Index Score (3 Year Range Pct): | 29.4 | 67.0 | 96.3 |
| – Strength Index Reading (3 Year Range): | Bearish | Bullish | Bullish-Extreme |
| NET POSITION MOVEMENT INDEX: | |||
| – 6-Week Change in Strength Index: | -7.3 | 6.6 | 9.1 |
5-Year Treasury Note Futures:
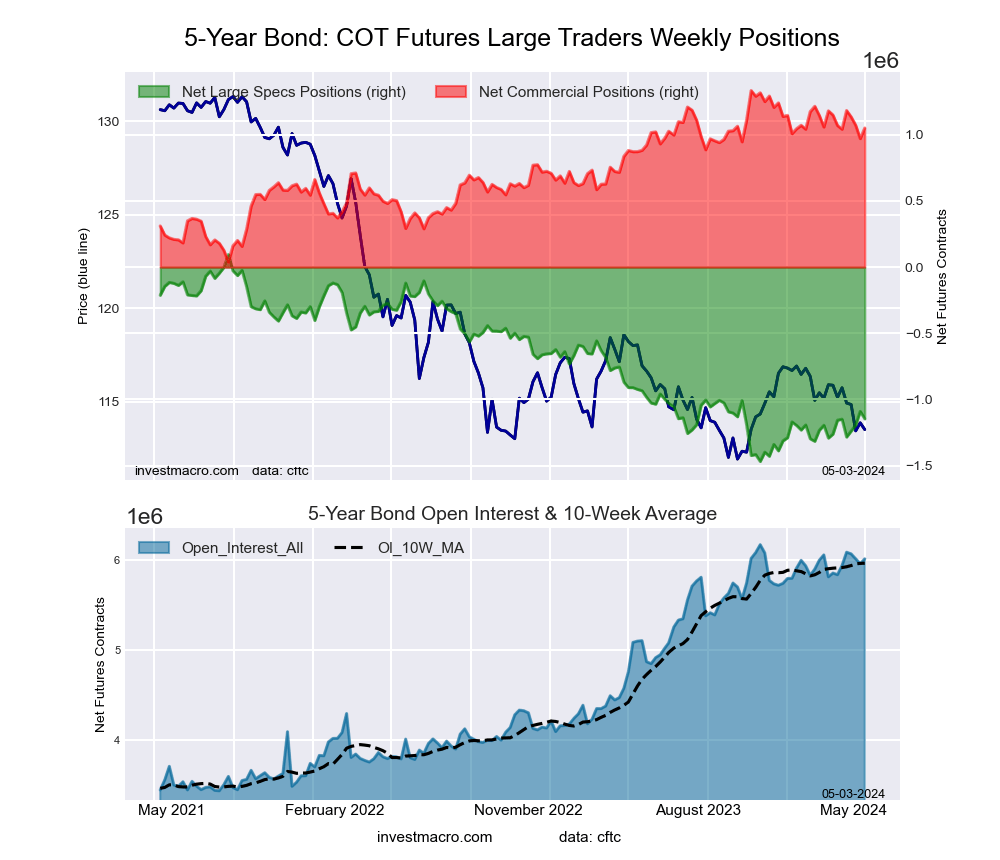 The 5-Year Treasury Note large speculator standing this week equaled a net position of -1,146,598 contracts in the data reported through Tuesday. This was a weekly lowering of -56,309 contracts from the previous week which had a total of -1,090,289 net contracts.
This week’s current strength score (the trader positioning range over the past three years, measured from 0 to 100) shows the speculators are currently Bearish with a score of 20.6 percent. The commercials are Bullish with a score of 78.2 percent and the small traders (not shown in chart) are Bullish-Extreme with a score of 83.0 percent.
Price Trend-Following Model: Downtrend
Our weekly trend-following model classifies the current market price position as: Downtrend. The current action for the model is considered to be: Hold – Maintain Short Position.
| 5-Year Treasury Note Statistics | SPECULATORS | COMMERCIALS | SMALL TRADERS |
| – Percent of Open Interest Longs: | 7.2 | 83.7 | 7.0 |
| – Percent of Open Interest Shorts: | 26.3 | 66.2 | 5.4 |
| – Net Position: | -1,146,598 | 1,051,309 | 95,289 |
| – Gross Longs: | 434,860 | 5,032,454 | 422,885 |
| – Gross Shorts: | 1,581,458 | 3,981,145 | 327,596 |
| – Long to Short Ratio: | 0.3 to 1 | 1.3 to 1 | 1.3 to 1 |
| NET POSITION TREND: | |||
| – Strength Index Score (3 Year Range Pct): | 20.6 | 78.2 | 83.0 |
| – Strength Index Reading (3 Year Range): | Bearish | Bullish | Bullish-Extreme |
| NET POSITION MOVEMENT INDEX: | |||
| – 6-Week Change in Strength Index: | 0.7 | -1.4 | 1.7 |
10-Year Treasury Note Futures:
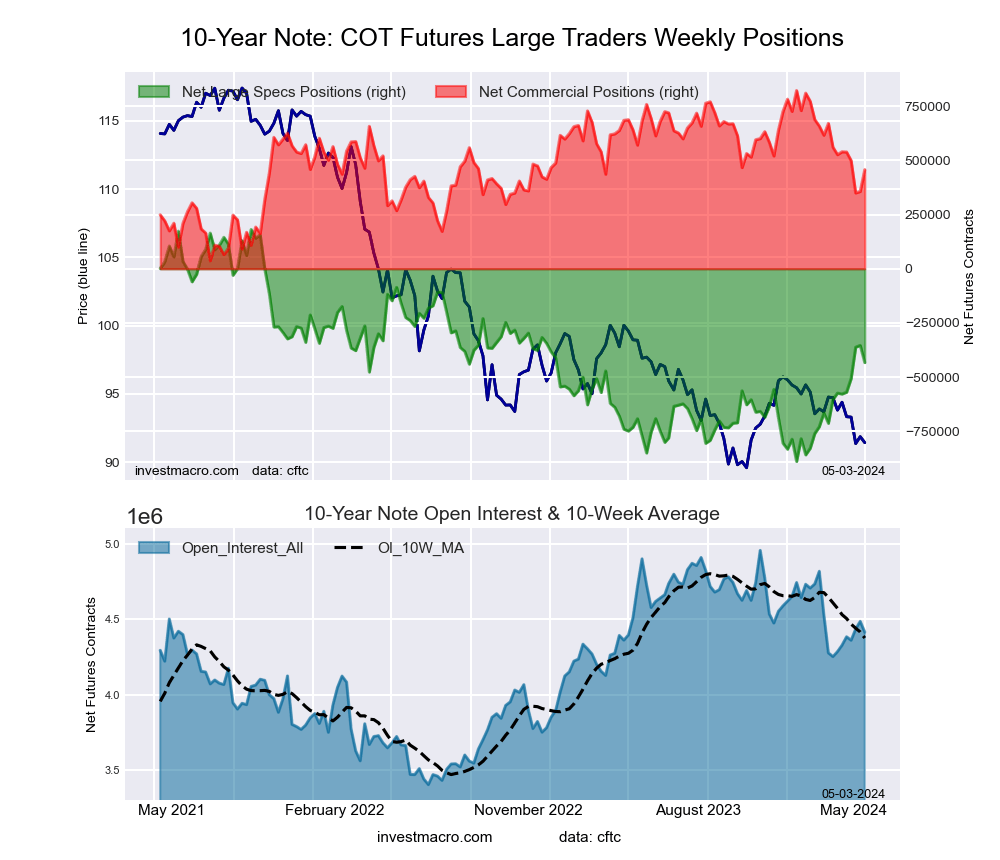 The 10-Year Treasury Note large speculator standing this week equaled a net position of -432,965 contracts in the data reported through Tuesday. This was a weekly fall of -79,045 contracts from the previous week which had a total of -353,920 net contracts.
This week’s current strength score (the trader positioning range over the past three years, measured from 0 to 100) shows the speculators are currently Bearish with a score of 42.6 percent. The commercials are Bullish with a score of 53.5 percent and the small traders (not shown in chart) are Bullish with a score of 68.2 percent.
Price Trend-Following Model: Downtrend
Our weekly trend-following model classifies the current market price position as: Downtrend. The current action for the model is considered to be: Hold – Maintain Short Position.
| 10-Year Treasury Note Statistics | SPECULATORS | COMMERCIALS | SMALL TRADERS |
| – Percent of Open Interest Longs: | 10.2 | 77.6 | 9.2 |
| – Percent of Open Interest Shorts: | 20.0 | 67.3 | 9.7 |
| – Net Position: | -432,965 | 457,279 | -24,314 |
| – Gross Longs: | 451,643 | 3,428,368 | 405,462 |
| – Gross Shorts: | 884,608 | 2,971,089 | 429,776 |
| – Long to Short Ratio: | 0.5 to 1 | 1.2 to 1 | 0.9 to 1 |
| NET POSITION TREND: | |||
| – Strength Index Score (3 Year Range Pct): | 42.6 | 53.5 | 68.2 |
| – Strength Index Reading (3 Year Range): | Bearish | Bullish | Bullish |
| NET POSITION MOVEMENT INDEX: | |||
| – 6-Week Change in Strength Index: | 13.2 | -8.8 | -15.6 |
Ultra 10-Year Notes Futures:
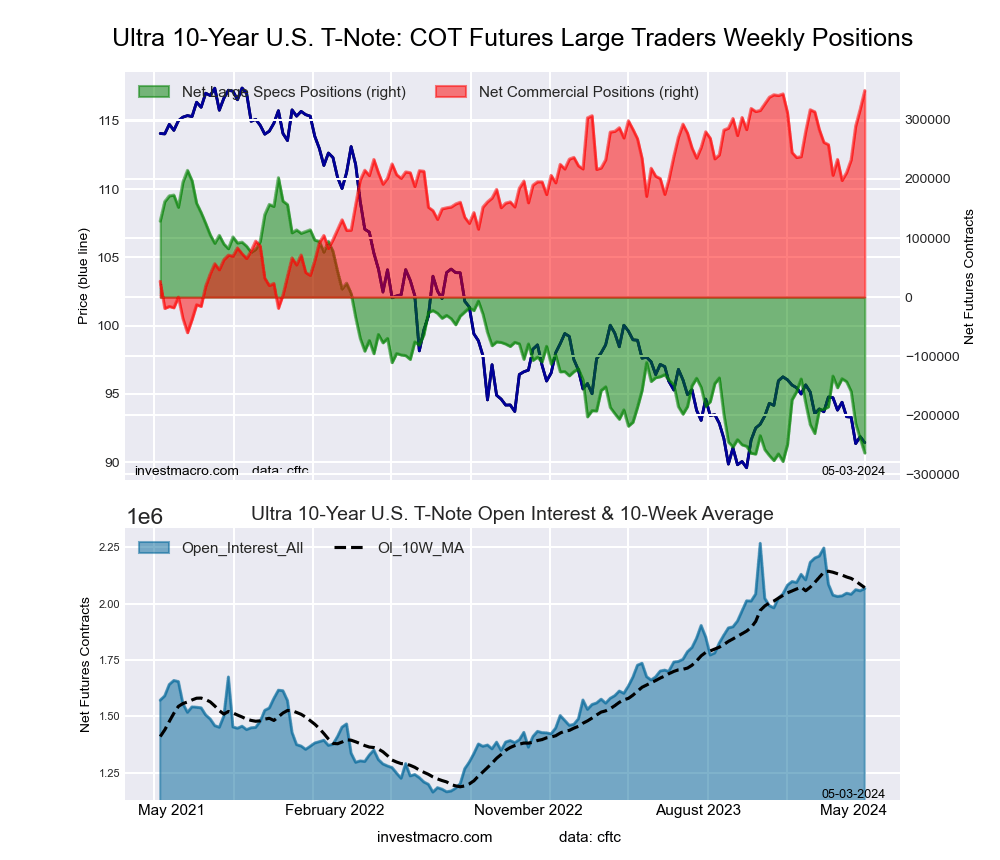 The Ultra 10-Year Notes large speculator standing this week equaled a net position of -263,683 contracts in the data reported through Tuesday. This was a weekly decline of -24,156 contracts from the previous week which had a total of -239,527 net contracts.
This week’s current strength score (the trader positioning range over the past three years, measured from 0 to 100) shows the speculators are currently Bearish-Extreme with a score of 2.9 percent. The commercials are Bullish-Extreme with a score of 100.0 percent and the small traders (not shown in chart) are Bullish with a score of 63.0 percent.
Price Trend-Following Model: Weak Uptrend
Our weekly trend-following model classifies the current market price position as: Weak Uptrend. The current action for the model is considered to be: Hold – Maintain Long Position.
| Ultra 10-Year Notes Statistics | SPECULATORS | COMMERCIALS | SMALL TRADERS |
| – Percent of Open Interest Longs: | 10.8 | 77.7 | 9.8 |
| – Percent of Open Interest Shorts: | 23.6 | 60.8 | 14.0 |
| – Net Position: | -263,683 | 349,548 | -85,865 |
| – Gross Longs: | 224,117 | 1,605,733 | 202,627 |
| – Gross Shorts: | 487,800 | 1,256,185 | 288,492 |
| – Long to Short Ratio: | 0.5 to 1 | 1.3 to 1 | 0.7 to 1 |
| NET POSITION TREND: | |||
| – Strength Index Score (3 Year Range Pct): | 2.9 | 100.0 | 63.0 |
| – Strength Index Reading (3 Year Range): | Bearish-Extreme | Bullish-Extreme | Bullish |
| NET POSITION MOVEMENT INDEX: | |||
| – 6-Week Change in Strength Index: | -22.4 | 28.4 | -3.6 |
US Treasury Bonds Futures:
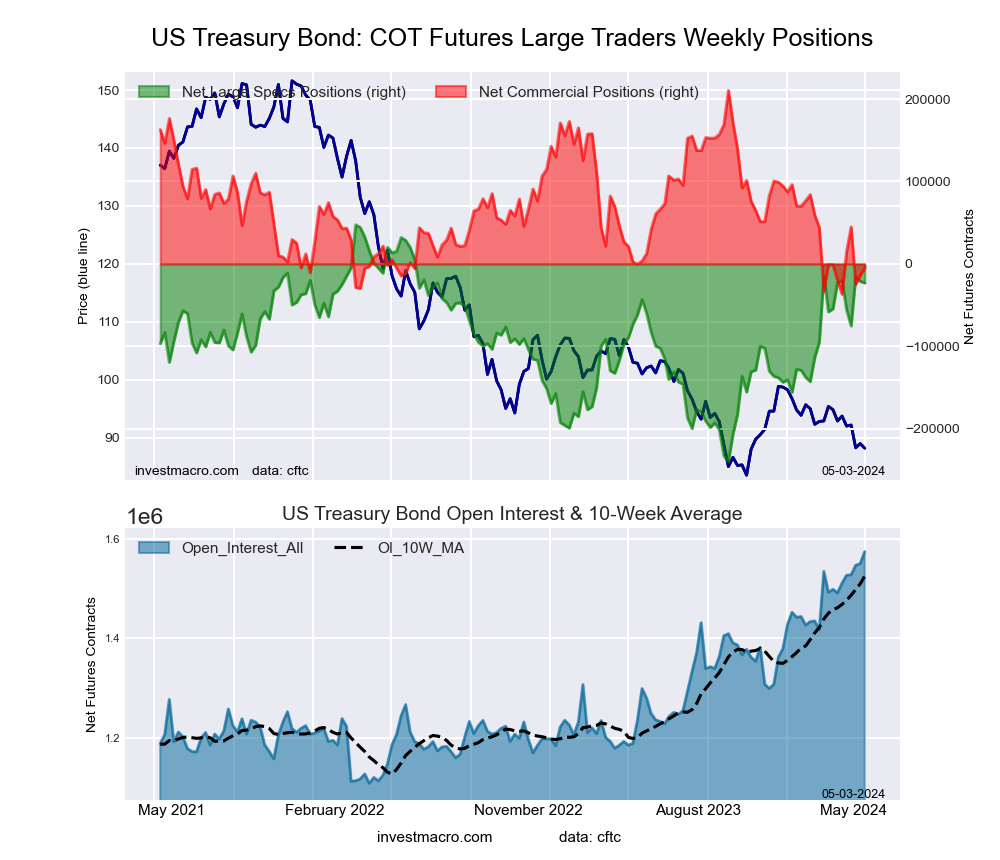 The US Treasury Bonds large speculator standing this week equaled a net position of -23,114 contracts in the data reported through Tuesday. This was a weekly decline of -1,943 contracts from the previous week which had a total of -21,171 net contracts.
This week’s current strength score (the trader positioning range over the past three years, measured from 0 to 100) shows the speculators are currently Bullish with a score of 75.4 percent. The commercials are Bearish-Extreme with a score of 13.0 percent and the small traders (not shown in chart) are Bullish with a score of 68.6 percent.
Price Trend-Following Model: Downtrend
Our weekly trend-following model classifies the current market price position as: Downtrend. The current action for the model is considered to be: Hold – Maintain Short Position.
| US Treasury Bonds Statistics | SPECULATORS | COMMERCIALS | SMALL TRADERS |
| – Percent of Open Interest Longs: | 16.4 | 70.2 | 12.3 |
| – Percent of Open Interest Shorts: | 17.9 | 70.5 | 10.5 |
| – Net Position: | -23,114 | -4,607 | 27,721 |
| – Gross Longs: | 258,380 | 1,105,551 | 192,864 |
| – Gross Shorts: | 281,494 | 1,110,158 | 165,143 |
| – Long to Short Ratio: | 0.9 to 1 | 1.0 to 1 | 1.2 to 1 |
| NET POSITION TREND: | |||
| – Strength Index Score (3 Year Range Pct): | 75.4 | 13.0 | 68.6 |
| – Strength Index Reading (3 Year Range): | Bullish | Bearish-Extreme | Bullish |
| NET POSITION MOVEMENT INDEX: | |||
| – 6-Week Change in Strength Index: | -0.2 | 6.2 | -10.7 |
Ultra US Treasury Bonds Futures:
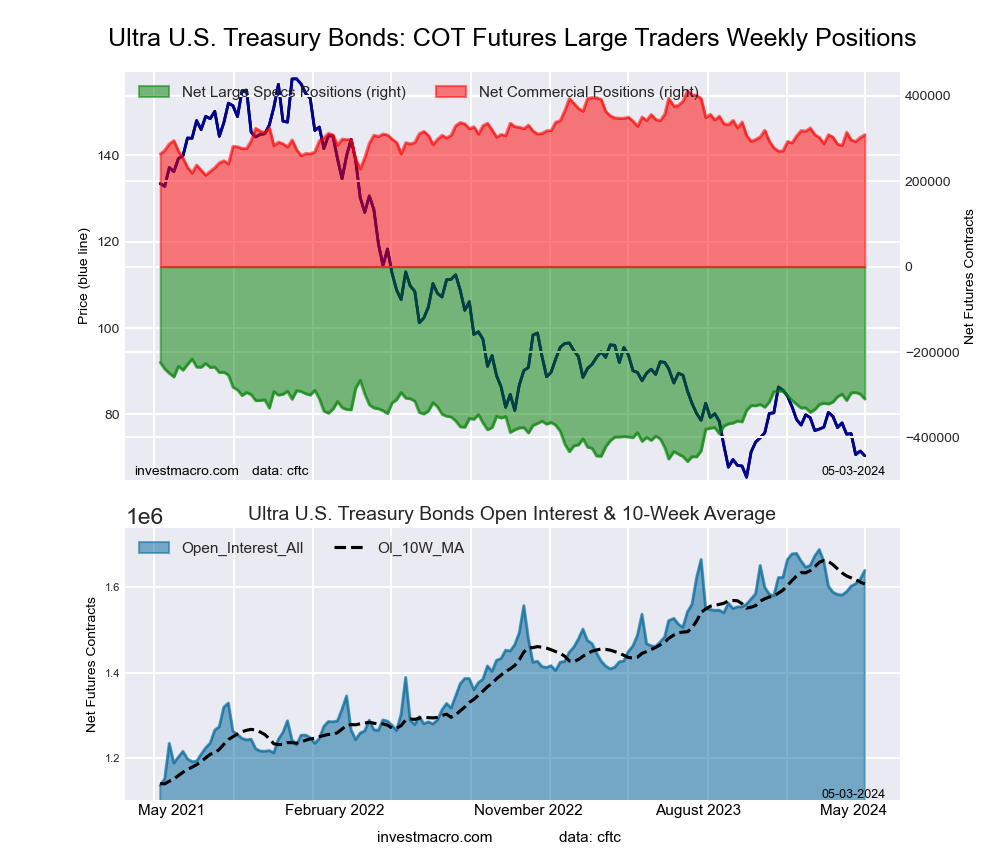 The Ultra US Treasury Bonds large speculator standing this week equaled a net position of -310,145 contracts in the data reported through Tuesday. This was a weekly decline of -11,645 contracts from the previous week which had a total of -298,500 net contracts.
This week’s current strength score (the trader positioning range over the past three years, measured from 0 to 100) shows the speculators are currently Bullish with a score of 60.9 percent. The commercials are Bearish with a score of 47.8 percent and the small traders (not shown in chart) are Bearish with a score of 38.1 percent.
Price Trend-Following Model: Strong Downtrend
Our weekly trend-following model classifies the current market price position as: Strong Downtrend. The current action for the model is considered to be: Hold – Maintain Short Position.
| Ultra US Treasury Bonds Statistics | SPECULATORS | COMMERCIALS | SMALL TRADERS |
| – Percent of Open Interest Longs: | 8.5 | 80.4 | 10.7 |
| – Percent of Open Interest Shorts: | 27.4 | 61.6 | 10.7 |
| – Net Position: | -310,145 | 309,147 | 998 |
| – Gross Longs: | 139,075 | 1,318,512 | 176,104 |
| – Gross Shorts: | 449,220 | 1,009,365 | 175,106 |
| – Long to Short Ratio: | 0.3 to 1 | 1.3 to 1 | 1.0 to 1 |
| NET POSITION TREND: | |||
| – Strength Index Score (3 Year Range Pct): | 60.9 | 47.8 | 38.1 |
| – Strength Index Reading (3 Year Range): | Bullish | Bearish | Bearish |
| NET POSITION MOVEMENT INDEX: | |||
| – 6-Week Change in Strength Index: | -2.3 | 11.1 | -15.7 |
Article By InvestMacro – Receive our weekly COT Newsletter
*COT Report: The COT data, released weekly to the public each Friday, is updated through the most recent Tuesday (data is 3 days old) and shows a quick view of how large speculators or non-commercials (for-profit traders) were positioned in the futures markets.
The CFTC categorizes trader positions according to commercial hedgers (traders who use futures contracts for hedging as part of the business), non-commercials (large traders who speculate to realize trading profits) and nonreportable traders (usually small traders/speculators) as well as their open interest (contracts open in the market at time of reporting). See CFTC criteria here.