By InvestMacro
Here are the latest charts and statistics for the Commitment of Traders (COT) data published by the Commodities Futures Trading Commission (CFTC).
The latest COT data is updated through Tuesday August 6th and shows a quick view of how large market participants (for-profit speculators and commercial traders) were positioned in the futures markets. All currency positions are in direct relation to the US dollar where, for example, a bet for the euro is a bet that the euro will rise versus the dollar while a bet against the euro will be a bet that the euro will decline versus the dollar.
Weekly Speculator Changes led by Japanese Yen & EuroFX
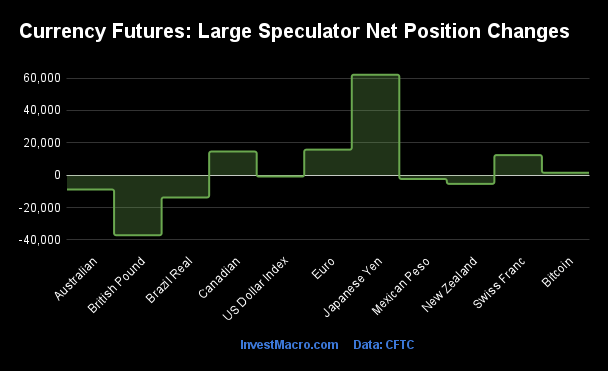
The COT currency market speculator bets were slightly lower overall this week as five out of the eleven currency markets we cover had higher positioning while the other six markets had lower speculator contracts.
Leading the gains for the currency markets was the Japanese Yen (62,106 contracts) with the EuroFX (15,781 contracts), the Canadian Dollar (14,631 contracts), the Swiss Franc (12,447 contracts) and Bitcoin (1,540 contracts) also recording positive weeks.
The currencies seeing declines in speculator bets on the week were the British Pound (-37,072 contracts), the Brazilian Real (-13,724 contracts), the Australian Dollar (-8,829 contracts), the New Zealand Dollar (-5,343 contracts), the Mexican Peso (-2,324 contracts) and with the US Dollar Index (-822 contracts) also seeing lower bets on the week.
Currency Speculators sharply pared back Japanese Yen bearish bets
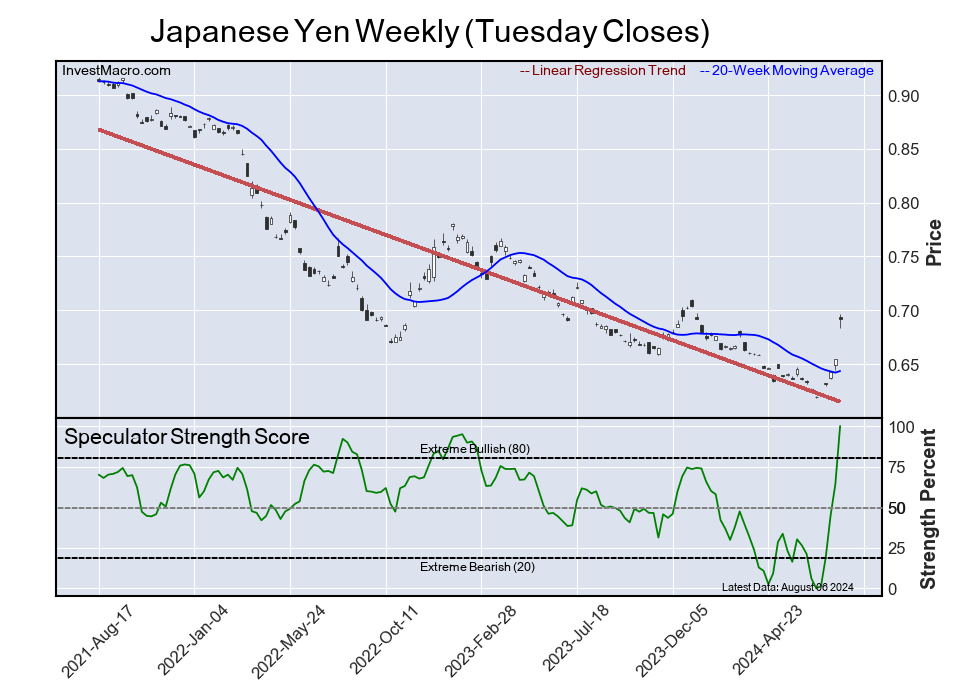
Highlighting the COT currency’s data this week was the large move in the Japanese yen speculator position that took place after last week’s (and the previous Friday) early risk-off trades and volatility spikes.
The Japanese yen speculator contracts saw a huge surge of buying with the yen speculator positioning jumping by over +62,000 contracts on the week. This was the highest one-week gain since March 1st of 2011 when the yen rose by +69,020 contracts. The turnaround in yen positions coincided with an enormous volatility event that shook the financial markets with many focusing the risk-off behavior on an unwind of yen carry trades – where traders sell a low-yielding asset like the yen to invest in a higher yielding like the USD to pocket the interest rate difference.
The yen buying and paring of shorts brought the overall speculator standing to just -11,354 contracts through Tuesday. This puts the speculator positioning back to an almost neutral position after the standing had been at least -100,000 contracts for twenty-four straight weeks from February 13th through two weeks ago on July 23rd. Overall, the yen positioning has now continued to remain in a bearish position for 178 consecutive weeks, dating back to March 16th of 2021.
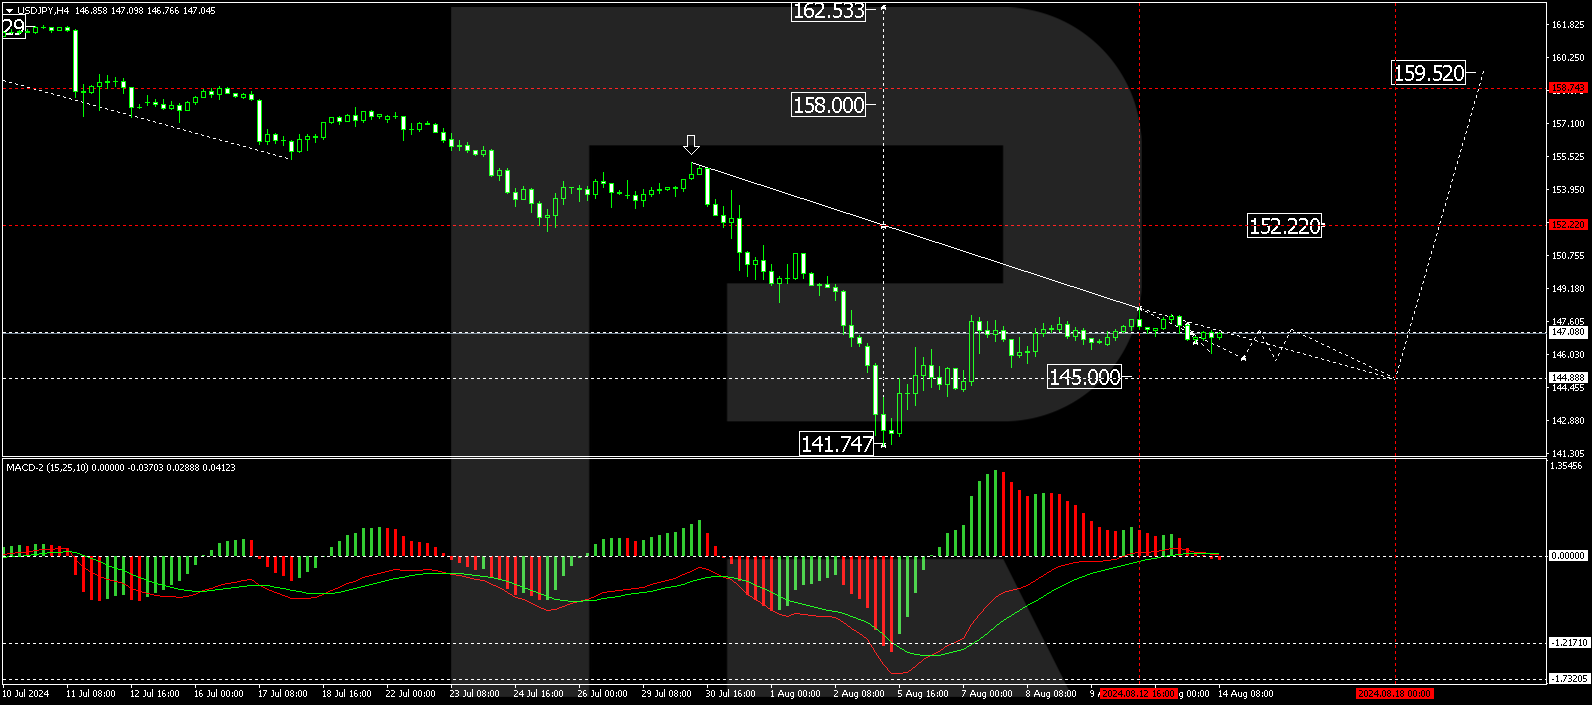
This possibly could be coming to an end as a change in policy by the Bank of Japan and an unwinding of the carry trade may bring some yen strength back into the market or at least dampen the one-way market action. The yen had lost approximately 50 percent of its value against the US Dollar in the past three years with the USDJPY currency pair reaching multi-decade highs above 162.00 before the latest selloff and unwind of the yen short positioning.
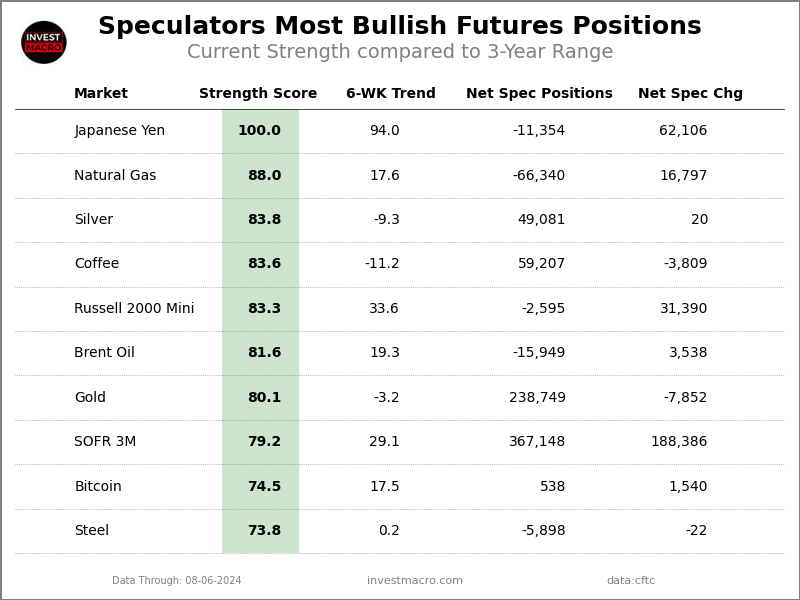
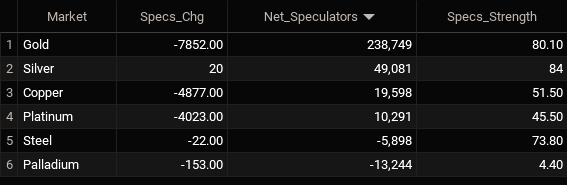
Currencies Net Speculators Leaderboard
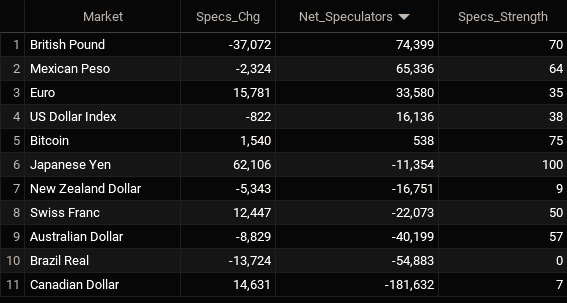
Legend: Weekly Speculators Change | Speculators Current Net Position | Speculators Strength Score compared to last 3-Years (0-100 range)
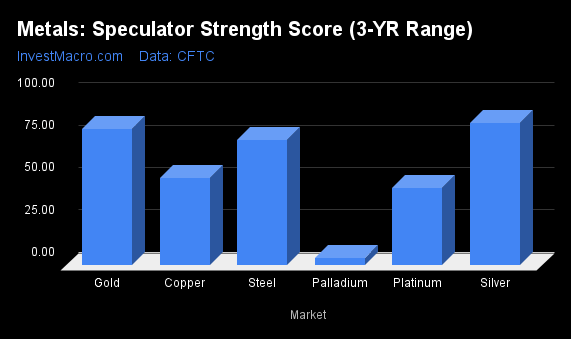
Strength Scores led by Japanese Yen & Bitcoin
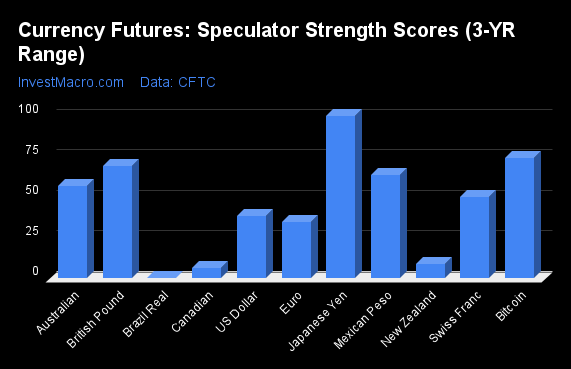
COT Strength Scores (a normalized measure of Speculator positions over a 3-Year range, from 0 to 100 where above 80 is Extreme-Bullish and below 20 is Extreme-Bearish) showed that the Japanese Yen (100 percent) and Bitcoin (75 percent) lead the currency markets this week. The British Pound (70 percent), Mexican Peso (64 percent) and the Australian Dollar (57 percent) come in as the next highest in the weekly strength scores.
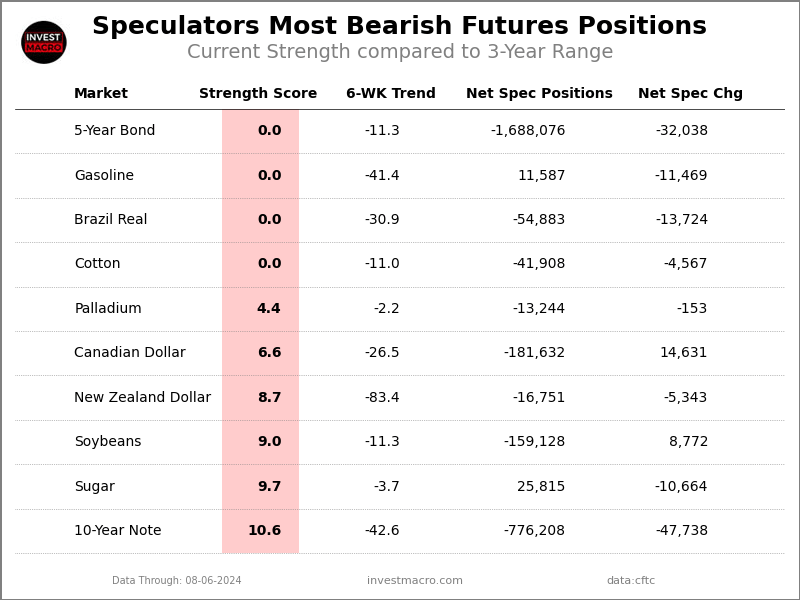
On the downside, the Brazilian Real (0 percent), the Canadian Dollar (7 percent) and the New Zealand Dollar (9 percent) come in at the lowest strength levels currently and are in Extreme-Bearish territory (below 20 percent).
Strength Statistics:
US Dollar Index (38.4 percent) vs US Dollar Index previous week (40.2 percent)
EuroFX (34.6 percent) vs EuroFX previous week (27.9 percent)
British Pound Sterling (69.5 percent) vs British Pound Sterling previous week (86.2 percent)
Japanese Yen (100.0 percent) vs Japanese Yen previous week (64.1 percent)
Swiss Franc (50.1 percent) vs Swiss Franc previous week (27.6 percent)
Canadian Dollar (6.6 percent) vs Canadian Dollar previous week (0.0 percent)
Australian Dollar (56.8 percent) vs Australian Dollar previous week (64.2 percent)
New Zealand Dollar (8.7 percent) vs New Zealand Dollar previous week (19.0 percent)
Mexican Peso (63.5 percent) vs Mexican Peso previous week (64.7 percent)
Brazilian Real (0.0 percent) vs Brazilian Real previous week (13.0 percent)
Bitcoin (74.5 percent) vs Bitcoin previous week (51.3 percent)
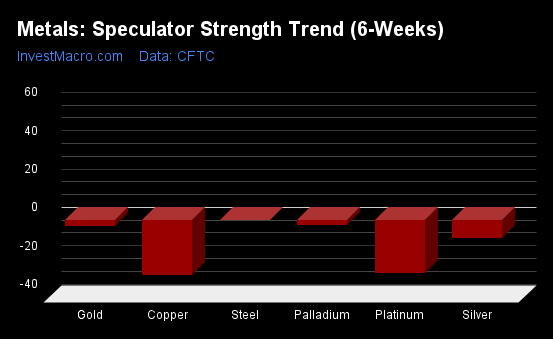
Japanese Yen & Swiss Franc top the 6-Week Strength Trends
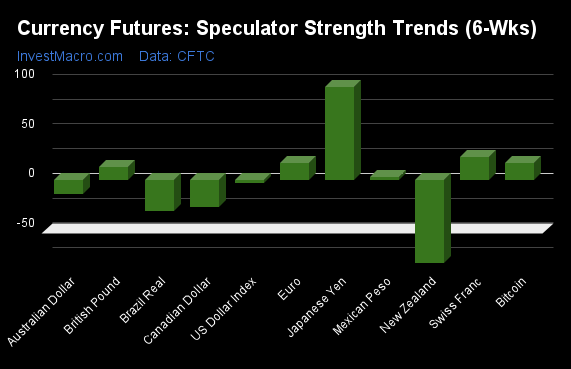
COT Strength Score Trends (or move index, calculates the 6-week changes in strength scores) showed that the Japanese Yen (94 percent) and the Swiss Franc (23 percent) lead the past six weeks trends for the currencies. The EuroFX (18 percent), the Bitcoin (17 percent) and the British Pound (14 percent) are the next highest positive movers in the latest trends data.
The New Zealand Dollar (-83 percent) leads the downside trend scores currently with the Brazilian Real (-31 percent), Canadian Dollar (-27 percent) and the Australian Dollar (-14 percent) following next with lower trend scores.
Strength Trend Statistics:
US Dollar Index (-3.0 percent) vs US Dollar Index previous week (-1.4 percent)
EuroFX (17.9 percent) vs EuroFX previous week (4.2 percent)
British Pound Sterling (13.6 percent) vs British Pound Sterling previous week (28.7 percent)
Japanese Yen (94.0 percent) vs Japanese Yen previous week (43.0 percent)
Swiss Franc (23.5 percent) vs Swiss Franc previous week (5.2 percent)
Canadian Dollar (-26.5 percent) vs Canadian Dollar previous week (-21.7 percent)
Australian Dollar (-13.9 percent) vs Australian Dollar previous week (8.7 percent)
New Zealand Dollar (-83.4 percent) vs New Zealand Dollar previous week (-61.0 percent)
Mexican Peso (3.7 percent) vs Mexican Peso previous week (8.5 percent)
Brazilian Real (-30.9 percent) vs Brazilian Real previous week (-20.3 percent)
Bitcoin (17.5 percent) vs Bitcoin previous week (-4.2 percent)
Individual COT Forex Markets:
US Dollar Index Futures:
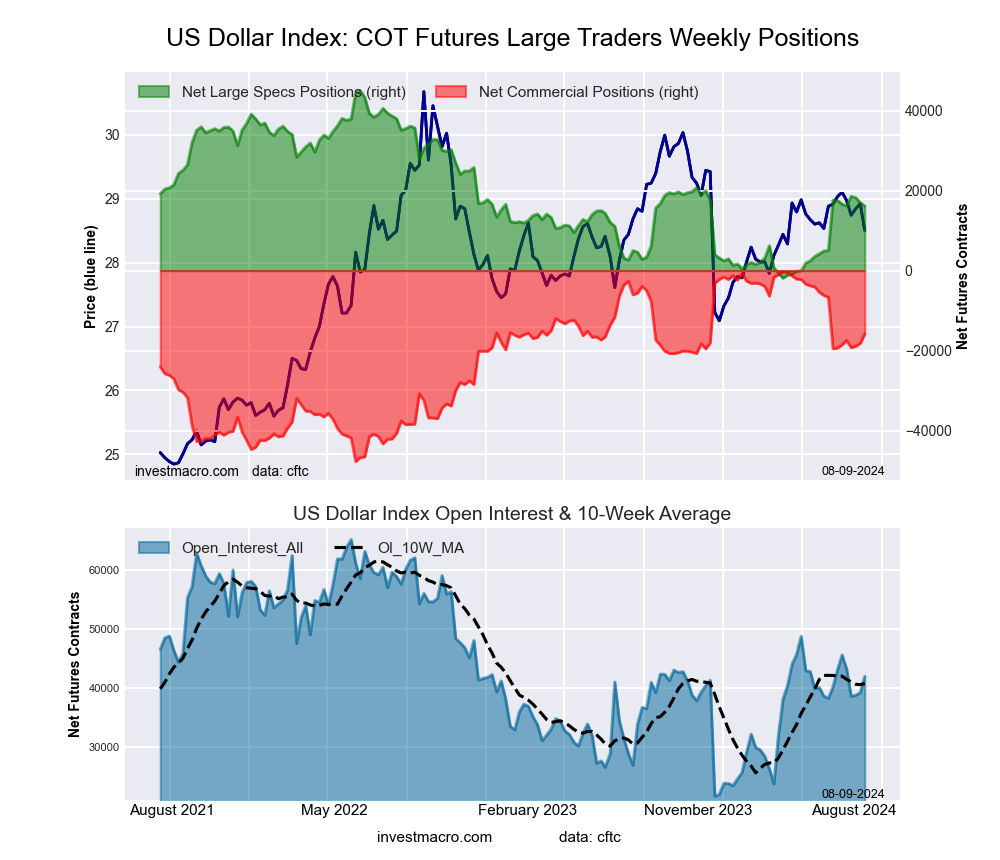 The US Dollar Index large speculator standing this week resulted in a net position of 16,136 contracts in the data reported through Tuesday. This was a weekly decline of -822 contracts from the previous week which had a total of 16,958 net contracts.
This week’s current strength score (the trader positioning range over the past three years, measured from 0 to 100) shows the speculators are currently Bearish with a score of 38.4 percent. The commercials are Bullish with a score of 67.3 percent and the small traders (not shown in chart) are Bearish-Extreme with a score of 7.6 percent.
Price Trend-Following Model: Weak Uptrend
Our weekly trend-following model classifies the current market price position as: Weak Uptrend. The current action for the model is considered to be: Hold – Maintain Long Position.
| US DOLLAR INDEX Statistics | SPECULATORS | COMMERCIALS | SMALL TRADERS |
| – Percent of Open Interest Longs: | 73.8 | 17.9 | 6.3 |
| – Percent of Open Interest Shorts: | 35.4 | 55.5 | 7.1 |
| – Net Position: | 16,136 | -15,827 | -309 |
| – Gross Longs: | 30,996 | 7,502 | 2,667 |
| – Gross Shorts: | 14,860 | 23,329 | 2,976 |
| – Long to Short Ratio: | 2.1 to 1 | 0.3 to 1 | 0.9 to 1 |
| NET POSITION TREND: | | | |
| – Strength Index Score (3 Year Range Pct): | 38.4 | 67.3 | 7.6 |
| – Strength Index Reading (3 Year Range): | Bearish | Bullish | Bearish-Extreme |
| NET POSITION MOVEMENT INDEX: | | | |
| – 6-Week Change in Strength Index: | -3.0 | 7.5 | -25.1 |
Euro Currency Futures:
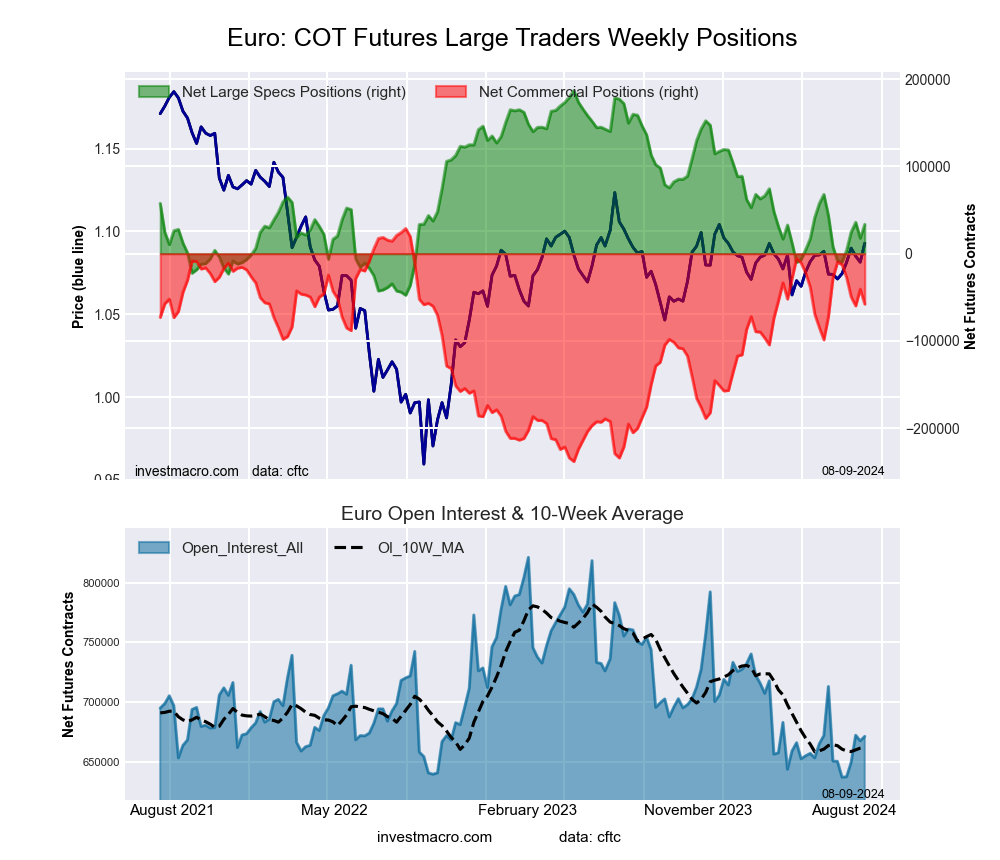 The Euro Currency large speculator standing this week resulted in a net position of 33,580 contracts in the data reported through Tuesday. This was a weekly rise of 15,781 contracts from the previous week which had a total of 17,799 net contracts.
This week’s current strength score (the trader positioning range over the past three years, measured from 0 to 100) shows the speculators are currently Bearish with a score of 34.6 percent. The commercials are Bullish with a score of 67.5 percent and the small traders (not shown in chart) are Bearish with a score of 25.3 percent.
Price Trend-Following Model: Strong Uptrend
Our weekly trend-following model classifies the current market price position as: Strong Uptrend. The current action for the model is considered to be: Hold – Maintain Long Position.
| EURO Currency Statistics | SPECULATORS | COMMERCIALS | SMALL TRADERS |
| – Percent of Open Interest Longs: | 27.7 | 57.6 | 11.1 |
| – Percent of Open Interest Shorts: | 22.7 | 66.2 | 7.5 |
| – Net Position: | 33,580 | -57,860 | 24,280 |
| – Gross Longs: | 185,799 | 386,568 | 74,618 |
| – Gross Shorts: | 152,219 | 444,428 | 50,338 |
| – Long to Short Ratio: | 1.2 to 1 | 0.9 to 1 | 1.5 to 1 |
| NET POSITION TREND: | | | |
| – Strength Index Score (3 Year Range Pct): | 34.6 | 67.5 | 25.3 |
| – Strength Index Reading (3 Year Range): | Bearish | Bullish | Bearish |
| NET POSITION MOVEMENT INDEX: | | | |
| – 6-Week Change in Strength Index: | 17.9 | -18.0 | 13.9 |
British Pound Sterling Futures:
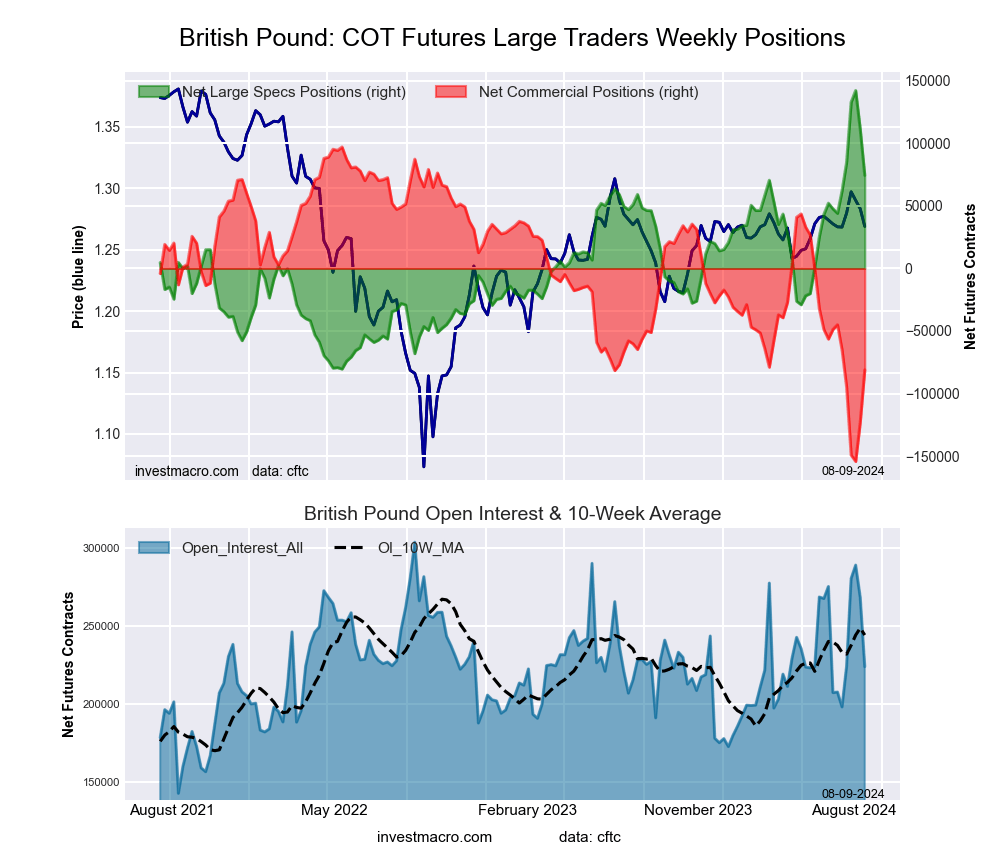 The British Pound Sterling large speculator standing this week resulted in a net position of 74,399 contracts in the data reported through Tuesday. This was a weekly decline of -37,072 contracts from the previous week which had a total of 111,471 net contracts.
This week’s current strength score (the trader positioning range over the past three years, measured from 0 to 100) shows the speculators are currently Bullish with a score of 69.5 percent. The commercials are Bearish with a score of 29.1 percent and the small traders (not shown in chart) are Bullish with a score of 76.2 percent.
Price Trend-Following Model: Uptrend
Our weekly trend-following model classifies the current market price position as: Uptrend. The current action for the model is considered to be: Hold – Maintain Long Position.
| BRITISH POUND Statistics | SPECULATORS | COMMERCIALS | SMALL TRADERS |
| – Percent of Open Interest Longs: | 56.3 | 26.2 | 14.7 |
| – Percent of Open Interest Shorts: | 23.1 | 62.4 | 11.8 |
| – Net Position: | 74,399 | -81,080 | 6,681 |
| – Gross Longs: | 126,080 | 58,800 | 33,006 |
| – Gross Shorts: | 51,681 | 139,880 | 26,325 |
| – Long to Short Ratio: | 2.4 to 1 | 0.4 to 1 | 1.3 to 1 |
| NET POSITION TREND: | | | |
| – Strength Index Score (3 Year Range Pct): | 69.5 | 29.1 | 76.2 |
| – Strength Index Reading (3 Year Range): | Bullish | Bearish | Bullish |
| NET POSITION MOVEMENT INDEX: | | | |
| – 6-Week Change in Strength Index: | 13.6 | -14.3 | 12.0 |
Japanese Yen Futures:
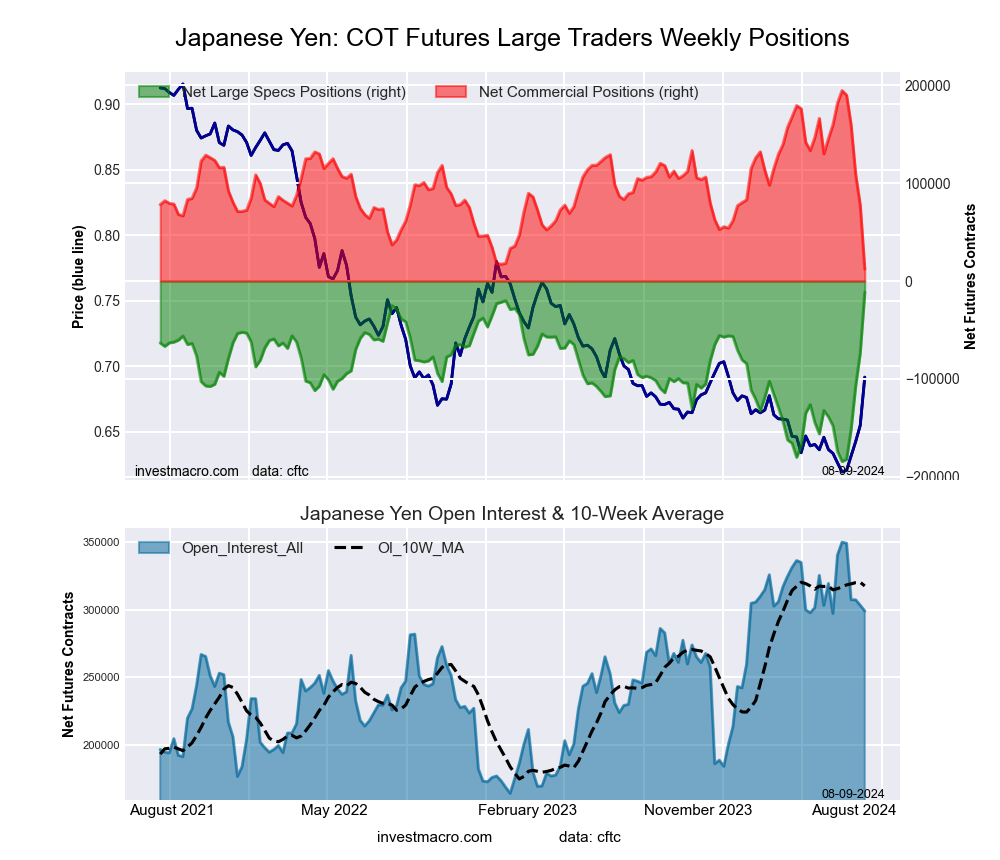 The Japanese Yen large speculator standing this week resulted in a net position of -11,354 contracts in the data reported through Tuesday. This was a weekly gain of 62,106 contracts from the previous week which had a total of -73,460 net contracts.
This week’s current strength score (the trader positioning range over the past three years, measured from 0 to 100) shows the speculators are currently Bullish-Extreme with a score of 100.0 percent. The commercials are Bearish-Extreme with a score of 0.0 percent and the small traders (not shown in chart) are Bullish with a score of 79.9 percent.
Price Trend-Following Model: Weak Downtrend
Our weekly trend-following model classifies the current market price position as: Weak Downtrend. The current action for the model is considered to be: Hold – Maintain Short Position.
| JAPANESE YEN Statistics | SPECULATORS | COMMERCIALS | SMALL TRADERS |
| – Percent of Open Interest Longs: | 22.1 | 64.2 | 11.1 |
| – Percent of Open Interest Shorts: | 25.9 | 60.1 | 11.4 |
| – Net Position: | -11,354 | 12,196 | -842 |
| – Gross Longs: | 66,169 | 191,829 | 33,312 |
| – Gross Shorts: | 77,523 | 179,633 | 34,154 |
| – Long to Short Ratio: | 0.9 to 1 | 1.1 to 1 | 1.0 to 1 |
| NET POSITION TREND: | | | |
| – Strength Index Score (3 Year Range Pct): | 100.0 | 0.0 | 79.9 |
| – Strength Index Reading (3 Year Range): | Bullish-Extreme | Bearish-Extreme | Bullish |
| NET POSITION MOVEMENT INDEX: | | | |
| – 6-Week Change in Strength Index: | 94.0 | -93.0 | 22.3 |
Swiss Franc Futures:
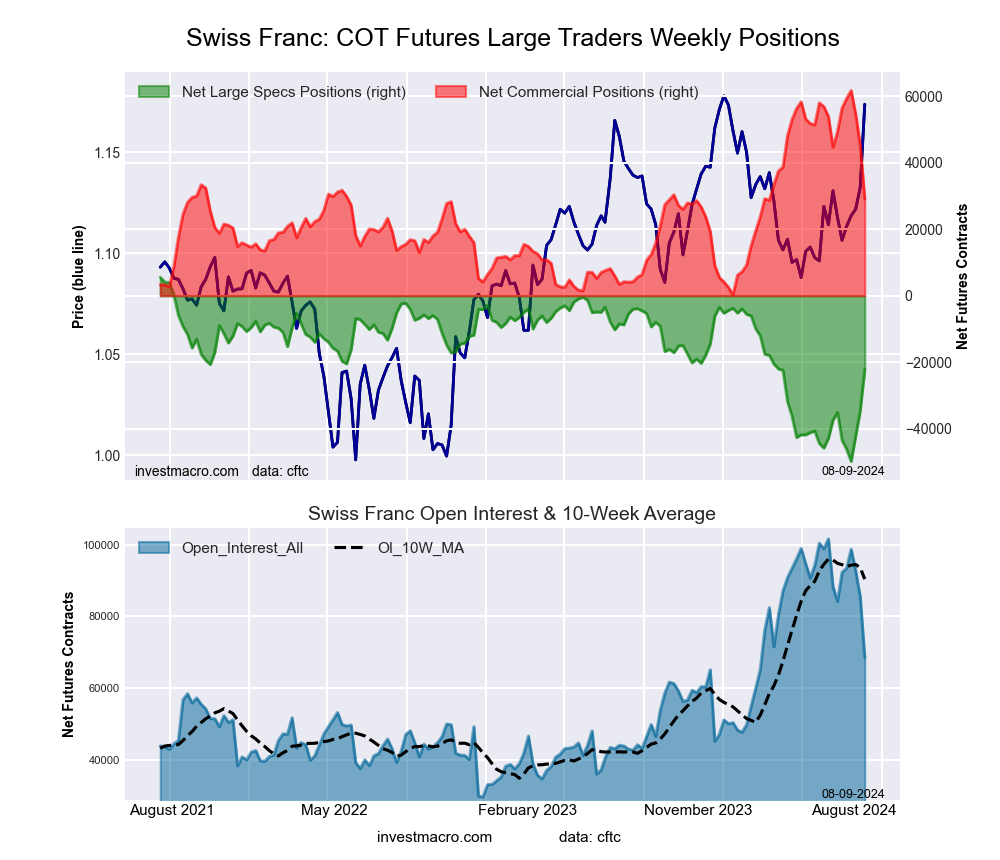 The Swiss Franc large speculator standing this week resulted in a net position of -22,073 contracts in the data reported through Tuesday. This was a weekly rise of 12,447 contracts from the previous week which had a total of -34,520 net contracts.
This week’s current strength score (the trader positioning range over the past three years, measured from 0 to 100) shows the speculators are currently Bullish with a score of 50.1 percent. The commercials are Bearish with a score of 47.0 percent and the small traders (not shown in chart) are Bearish with a score of 45.1 percent.
Price Trend-Following Model: Strong Uptrend
Our weekly trend-following model classifies the current market price position as: Strong Uptrend. The current action for the model is considered to be: Hold – Maintain Long Position.
| SWISS FRANC Statistics | SPECULATORS | COMMERCIALS | SMALL TRADERS |
| – Percent of Open Interest Longs: | 14.0 | 68.6 | 16.5 |
| – Percent of Open Interest Shorts: | 46.2 | 26.0 | 26.8 |
| – Net Position: | -22,073 | 29,131 | -7,058 |
| – Gross Longs: | 9,570 | 46,960 | 11,309 |
| – Gross Shorts: | 31,643 | 17,829 | 18,367 |
| – Long to Short Ratio: | 0.3 to 1 | 2.6 to 1 | 0.6 to 1 |
| NET POSITION TREND: | | | |
| – Strength Index Score (3 Year Range Pct): | 50.1 | 47.0 | 45.1 |
| – Strength Index Reading (3 Year Range): | Bullish | Bearish | Bearish |
| NET POSITION MOVEMENT INDEX: | | | |
| – 6-Week Change in Strength Index: | 23.5 | -32.9 | 32.8 |
Canadian Dollar Futures:
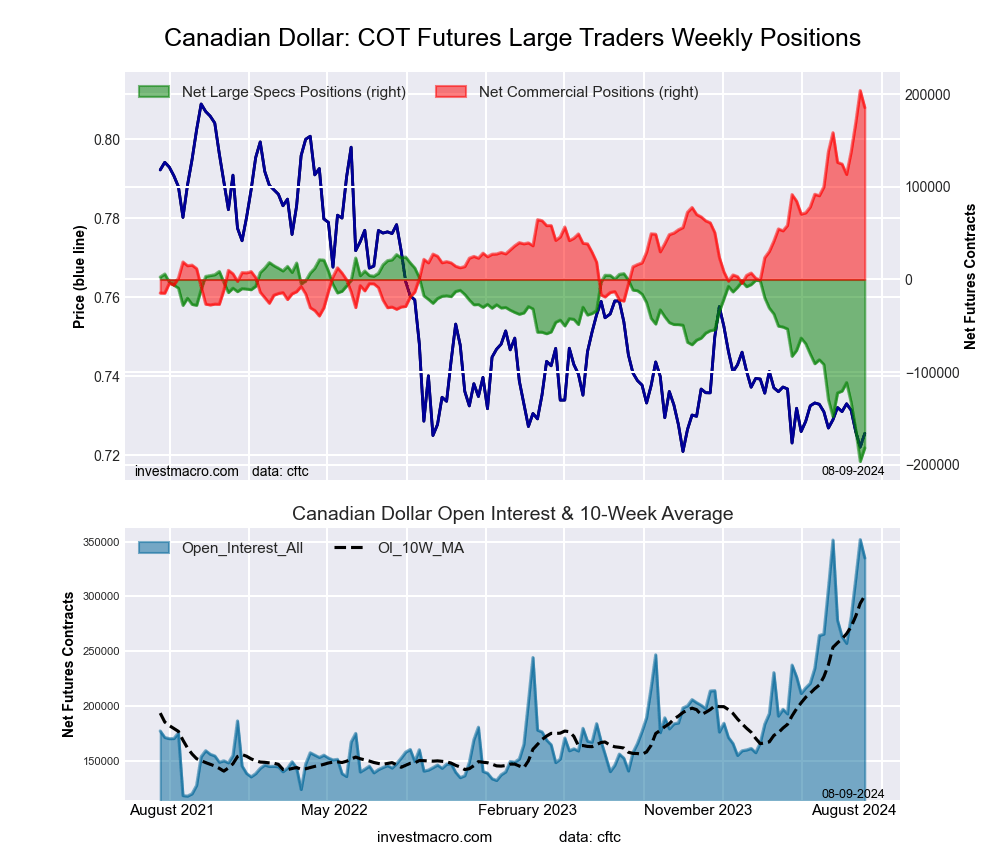 The Canadian Dollar large speculator standing this week resulted in a net position of -181,632 contracts in the data reported through Tuesday. This was a weekly boost of 14,631 contracts from the previous week which had a total of -196,263 net contracts.
This week’s current strength score (the trader positioning range over the past three years, measured from 0 to 100) shows the speculators are currently Bearish-Extreme with a score of 6.6 percent. The commercials are Bullish-Extreme with a score of 92.5 percent and the small traders (not shown in chart) are Bearish-Extreme with a score of 19.6 percent.
Price Trend-Following Model: Downtrend
Our weekly trend-following model classifies the current market price position as: Downtrend. The current action for the model is considered to be: Hold – Maintain Short Position.
| CANADIAN DOLLAR Statistics | SPECULATORS | COMMERCIALS | SMALL TRADERS |
| – Percent of Open Interest Longs: | 6.6 | 81.8 | 9.4 |
| – Percent of Open Interest Shorts: | 60.8 | 26.5 | 10.5 |
| – Net Position: | -181,632 | 185,438 | -3,806 |
| – Gross Longs: | 21,993 | 274,249 | 31,460 |
| – Gross Shorts: | 203,625 | 88,811 | 35,266 |
| – Long to Short Ratio: | 0.1 to 1 | 3.1 to 1 | 0.9 to 1 |
| NET POSITION TREND: | | | |
| – Strength Index Score (3 Year Range Pct): | 6.6 | 92.5 | 19.6 |
| – Strength Index Reading (3 Year Range): | Bearish-Extreme | Bullish-Extreme | Bearish-Extreme |
| NET POSITION MOVEMENT INDEX: | | | |
| – 6-Week Change in Strength Index: | -26.5 | 24.3 | 0.3 |
Australian Dollar Futures:
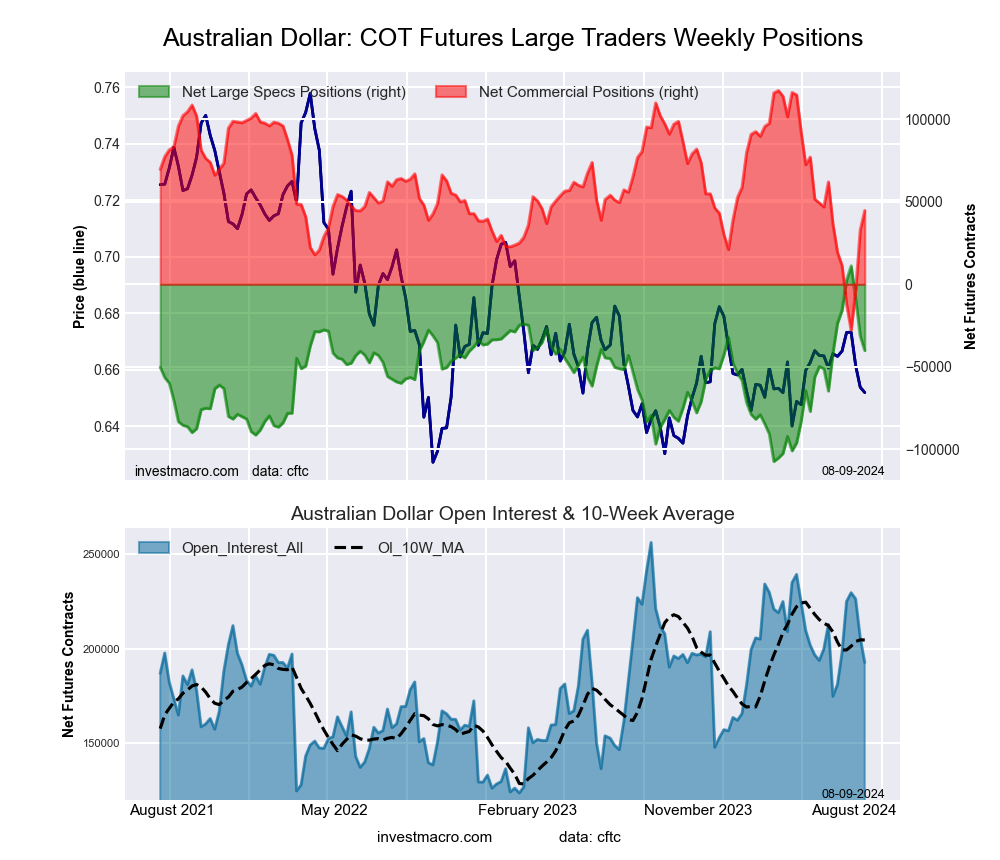 The Australian Dollar large speculator standing this week resulted in a net position of -40,199 contracts in the data reported through Tuesday. This was a weekly fall of -8,829 contracts from the previous week which had a total of -31,370 net contracts.
This week’s current strength score (the trader positioning range over the past three years, measured from 0 to 100) shows the speculators are currently Bullish with a score of 56.8 percent. The commercials are Bearish with a score of 49.9 percent and the small traders (not shown in chart) are Bearish with a score of 44.3 percent.
Price Trend-Following Model: Weak Uptrend
Our weekly trend-following model classifies the current market price position as: Weak Uptrend. The current action for the model is considered to be: Hold – Maintain Long Position.
| AUSTRALIAN DOLLAR Statistics | SPECULATORS | COMMERCIALS | SMALL TRADERS |
| – Percent of Open Interest Longs: | 35.4 | 50.4 | 11.7 |
| – Percent of Open Interest Shorts: | 56.3 | 27.1 | 14.1 |
| – Net Position: | -40,199 | 44,743 | -4,544 |
| – Gross Longs: | 68,193 | 97,019 | 22,601 |
| – Gross Shorts: | 108,392 | 52,276 | 27,145 |
| – Long to Short Ratio: | 0.6 to 1 | 1.9 to 1 | 0.8 to 1 |
| NET POSITION TREND: | | | |
| – Strength Index Score (3 Year Range Pct): | 56.8 | 49.9 | 44.3 |
| – Strength Index Reading (3 Year Range): | Bullish | Bearish | Bearish |
| NET POSITION MOVEMENT INDEX: | | | |
| – 6-Week Change in Strength Index: | -13.9 | 17.5 | -23.2 |
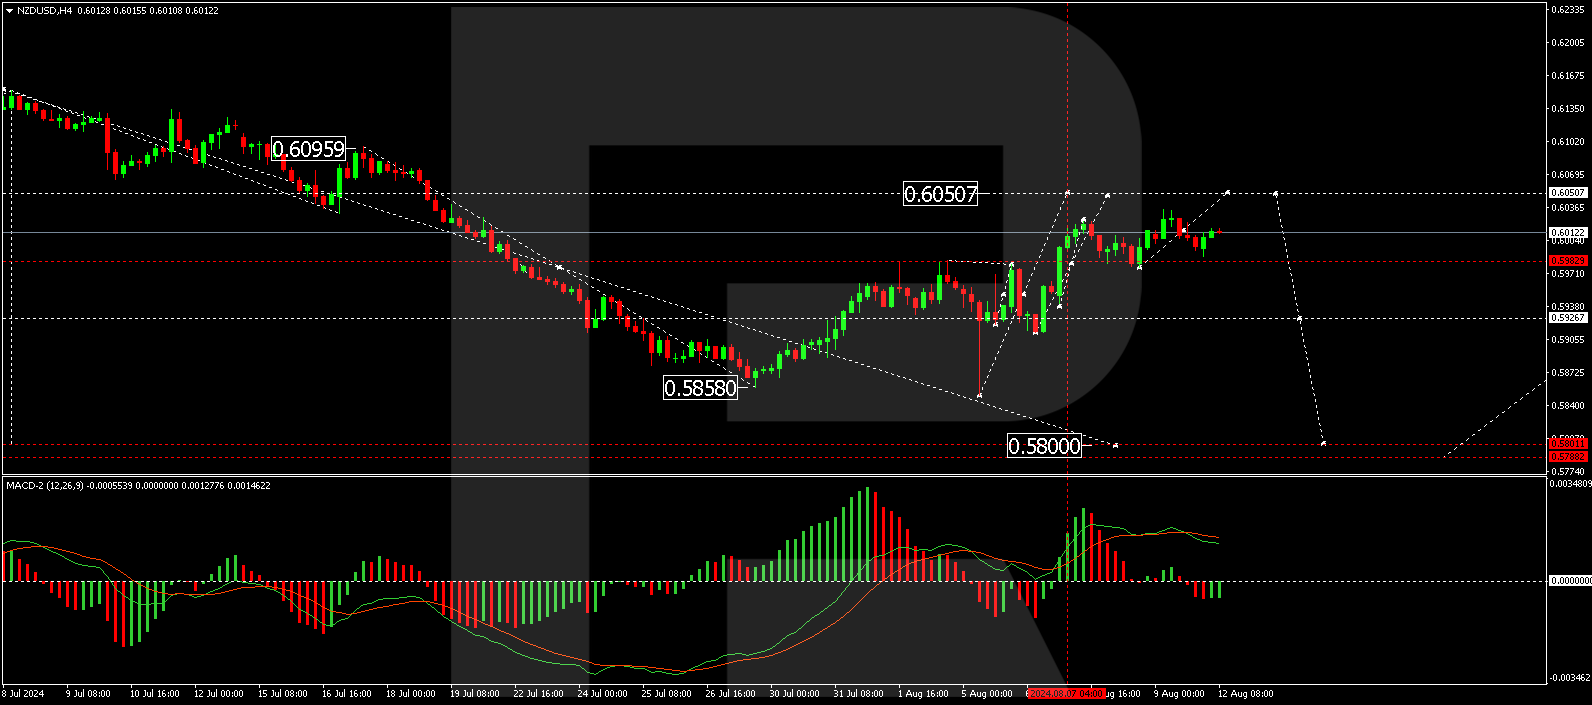
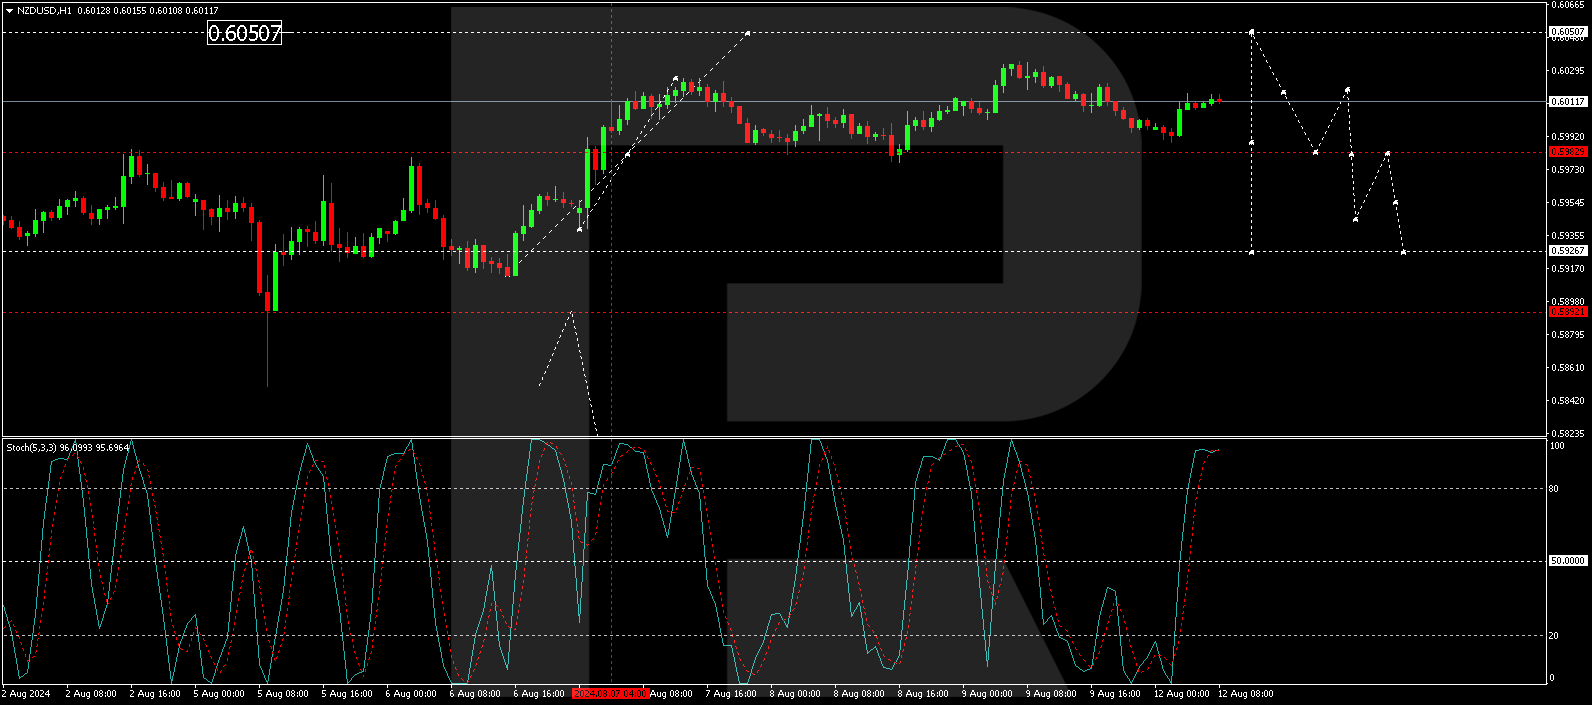
New Zealand Dollar Futures:
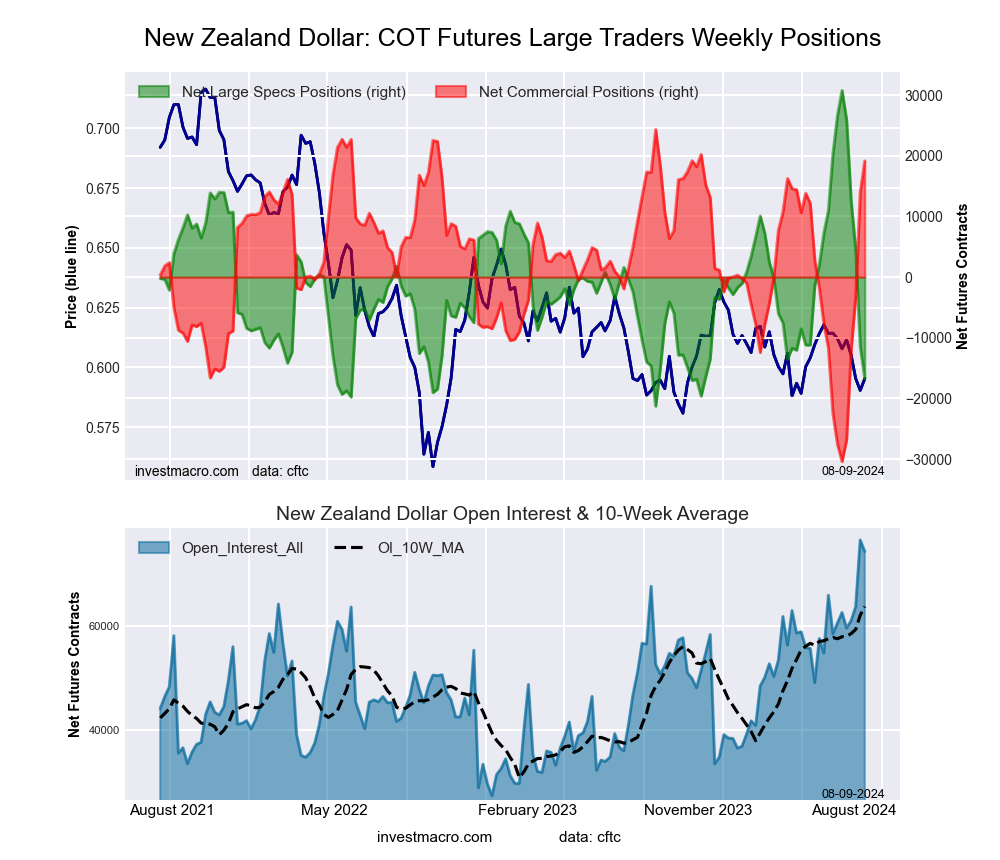 The New Zealand Dollar large speculator standing this week resulted in a net position of -16,751 contracts in the data reported through Tuesday. This was a weekly decrease of -5,343 contracts from the previous week which had a total of -11,408 net contracts.
This week’s current strength score (the trader positioning range over the past three years, measured from 0 to 100) shows the speculators are currently Bearish-Extreme with a score of 8.7 percent. The commercials are Bullish-Extreme with a score of 90.6 percent and the small traders (not shown in chart) are Bearish with a score of 25.2 percent.
Price Trend-Following Model: Weak Uptrend
Our weekly trend-following model classifies the current market price position as: Weak Uptrend. The current action for the model is considered to be: Hold – Maintain Long Position.
| NEW ZEALAND DOLLAR Statistics | SPECULATORS | COMMERCIALS | SMALL TRADERS |
| – Percent of Open Interest Longs: | 26.8 | 68.0 | 4.9 |
| – Percent of Open Interest Shorts: | 49.4 | 42.2 | 8.1 |
| – Net Position: | -16,751 | 19,140 | -2,389 |
| – Gross Longs: | 19,843 | 50,442 | 3,611 |
| – Gross Shorts: | 36,594 | 31,302 | 6,000 |
| – Long to Short Ratio: | 0.5 to 1 | 1.6 to 1 | 0.6 to 1 |
| NET POSITION TREND: | | | |
| – Strength Index Score (3 Year Range Pct): | 8.7 | 90.6 | 25.2 |
| – Strength Index Reading (3 Year Range): | Bearish-Extreme | Bullish-Extreme | Bearish |
| NET POSITION MOVEMENT INDEX: | | | |
| – 6-Week Change in Strength Index: | -83.4 | 85.4 | -46.1 |
Mexican Peso Futures:
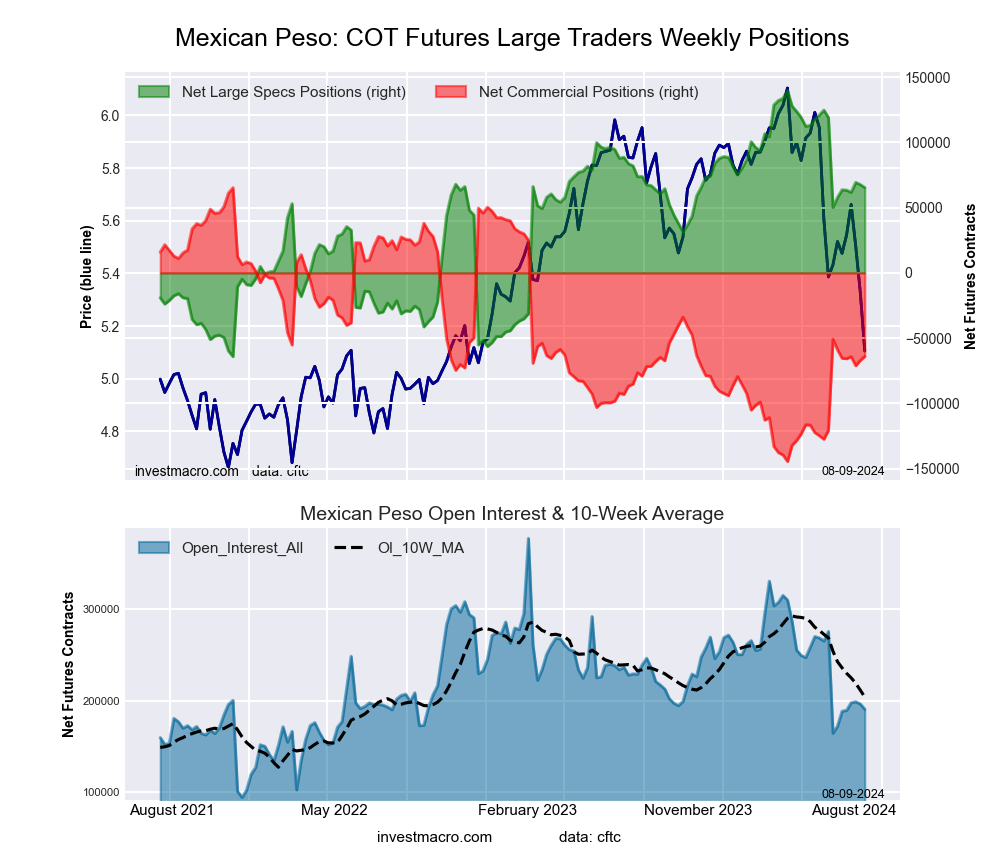 The Mexican Peso large speculator standing this week resulted in a net position of 65,336 contracts in the data reported through Tuesday. This was a weekly decline of -2,324 contracts from the previous week which had a total of 67,660 net contracts.
This week’s current strength score (the trader positioning range over the past three years, measured from 0 to 100) shows the speculators are currently Bullish with a score of 63.5 percent. The commercials are Bearish with a score of 38.4 percent and the small traders (not shown in chart) are Bearish-Extreme with a score of 2.7 percent.
Price Trend-Following Model: Strong Downtrend
Our weekly trend-following model classifies the current market price position as: Strong Downtrend. The current action for the model is considered to be: Hold – Maintain Short Position.
| MEXICAN PESO Statistics | SPECULATORS | COMMERCIALS | SMALL TRADERS |
| – Percent of Open Interest Longs: | 50.9 | 45.6 | 2.0 |
| – Percent of Open Interest Shorts: | 16.6 | 79.2 | 2.7 |
| – Net Position: | 65,336 | -64,007 | -1,329 |
| – Gross Longs: | 96,916 | 86,813 | 3,812 |
| – Gross Shorts: | 31,580 | 150,820 | 5,141 |
| – Long to Short Ratio: | 3.1 to 1 | 0.6 to 1 | 0.7 to 1 |
| NET POSITION TREND: | | | |
| – Strength Index Score (3 Year Range Pct): | 63.5 | 38.4 | 2.7 |
| – Strength Index Reading (3 Year Range): | Bullish | Bearish | Bearish-Extreme |
| NET POSITION MOVEMENT INDEX: | | | |
| – 6-Week Change in Strength Index: | 3.7 | -2.4 | -15.9 |
Brazilian Real Futures:
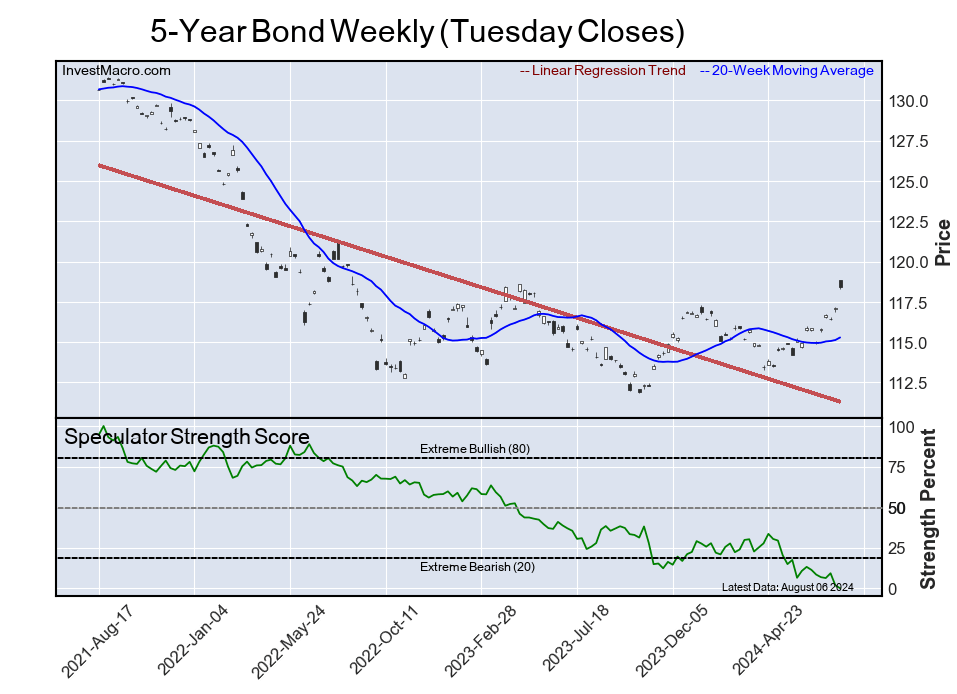
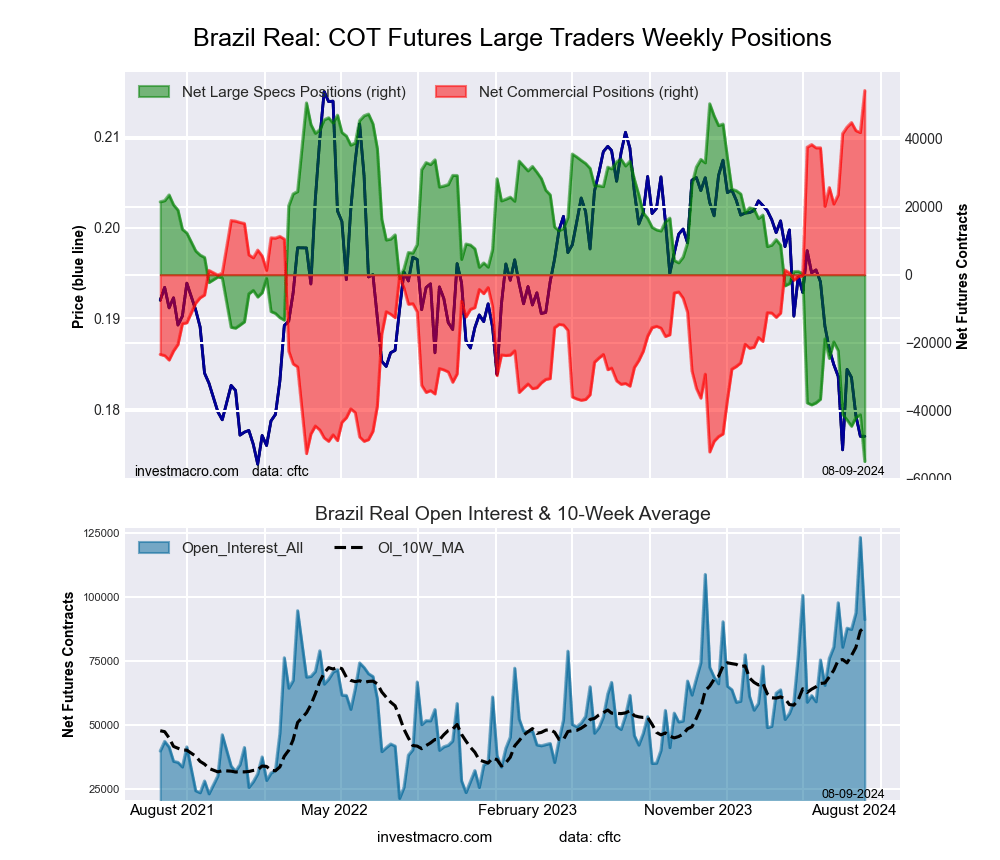 The Brazilian Real large speculator standing this week resulted in a net position of -54,883 contracts in the data reported through Tuesday. This was a weekly decrease of -13,724 contracts from the previous week which had a total of -41,159 net contracts.
This week’s current strength score (the trader positioning range over the past three years, measured from 0 to 100) shows the speculators are currently Bearish-Extreme with a score of 0.0 percent. The commercials are Bullish-Extreme with a score of 100.0 percent and the small traders (not shown in chart) are Bearish with a score of 41.5 percent.
Price Trend-Following Model: Downtrend
Our weekly trend-following model classifies the current market price position as: Downtrend. The current action for the model is considered to be: Hold – Maintain Short Position.
| BRAZIL REAL Statistics | SPECULATORS | COMMERCIALS | SMALL TRADERS |
| – Percent of Open Interest Longs: | 24.1 | 71.8 | 3.9 |
| – Percent of Open Interest Shorts: | 84.4 | 12.4 | 3.0 |
| – Net Position: | -54,883 | 54,127 | 756 |
| – Gross Longs: | 21,986 | 65,437 | 3,508 |
| – Gross Shorts: | 76,869 | 11,310 | 2,752 |
| – Long to Short Ratio: | 0.3 to 1 | 5.8 to 1 | 1.3 to 1 |
| NET POSITION TREND: | | | |
| – Strength Index Score (3 Year Range Pct): | 0.0 | 100.0 | 41.5 |
| – Strength Index Reading (3 Year Range): | Bearish-Extreme | Bullish-Extreme | Bearish |
| NET POSITION MOVEMENT INDEX: | | | |
| – 6-Week Change in Strength Index: | -30.9 | 28.7 | 17.8 |
Bitcoin Futures:
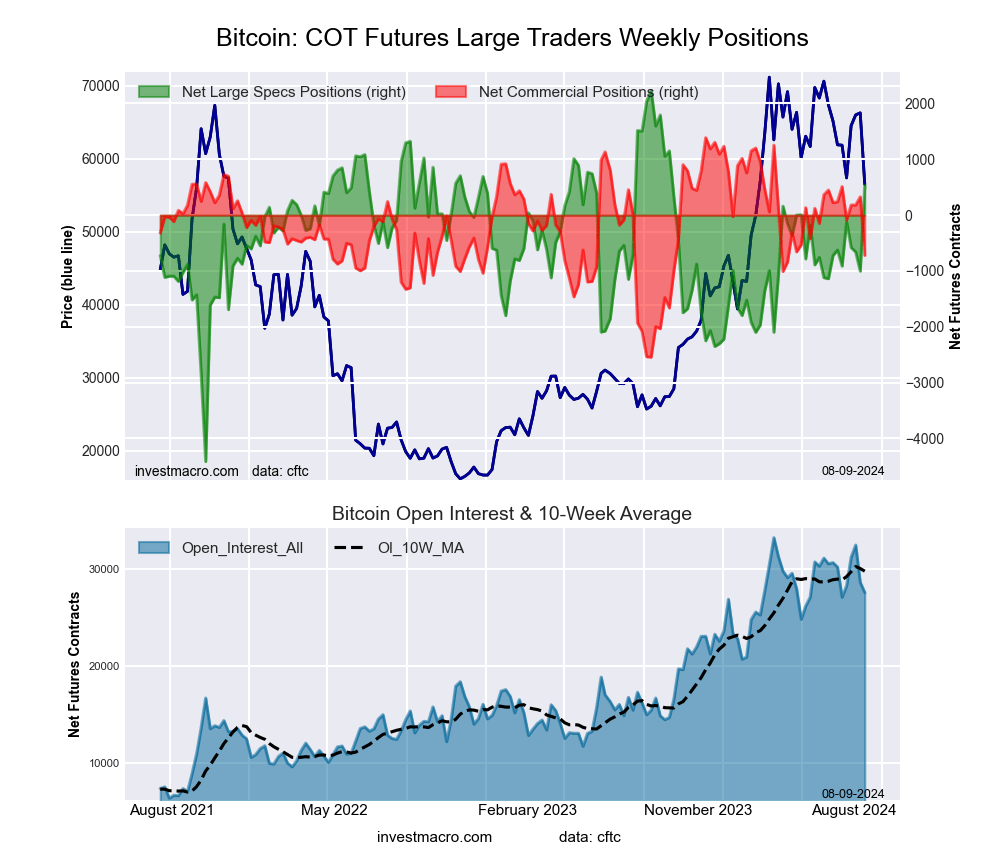 The Bitcoin large speculator standing this week resulted in a net position of 538 contracts in the data reported through Tuesday. This was a weekly gain of 1,540 contracts from the previous week which had a total of -1,002 net contracts.
This week’s current strength score (the trader positioning range over the past three years, measured from 0 to 100) shows the speculators are currently Bullish with a score of 74.5 percent. The commercials are Bearish with a score of 46.4 percent and the small traders (not shown in chart) are Bearish-Extreme with a score of 17.1 percent.
Price Trend-Following Model: Strong Downtrend
Our weekly trend-following model classifies the current market price position as: Strong Downtrend. The current action for the model is considered to be: Hold – Maintain Short Position.
| BITCOIN Statistics | SPECULATORS | COMMERCIALS | SMALL TRADERS |
| – Percent of Open Interest Longs: | 87.0 | 2.1 | 4.2 |
| – Percent of Open Interest Shorts: | 85.0 | 4.7 | 3.6 |
| – Net Position: | 538 | -719 | 181 |
| – Gross Longs: | 23,954 | 579 | 1,164 |
| – Gross Shorts: | 23,416 | 1,298 | 983 |
| – Long to Short Ratio: | 1.0 to 1 | 0.4 to 1 | 1.2 to 1 |
| NET POSITION TREND: | | | |
| – Strength Index Score (3 Year Range Pct): | 74.5 | 46.4 | 17.1 |
| – Strength Index Reading (3 Year Range): | Bullish | Bearish | Bearish-Extreme |
| NET POSITION MOVEMENT INDEX: | | | |
| – 6-Week Change in Strength Index: | 17.5 | -24.4 | -4.6 |
Article By InvestMacro – Receive our weekly COT Newsletter
*COT Report: The COT data, released weekly to the public each Friday, is updated through the most recent Tuesday (data is 3 days old) and shows a quick view of how large speculators or non-commercials (for-profit traders) were positioned in the futures markets.
The CFTC categorizes trader positions according to commercial hedgers (traders who use futures contracts for hedging as part of the business), non-commercials (large traders who speculate to realize trading profits) and nonreportable traders (usually small traders/speculators) as well as their open interest (contracts open in the market at time of reporting). See CFTC criteria here.