By InvestMacro
Here are the latest charts and statistics for the Commitment of Traders (COT) data published by the Commodities Futures Trading Commission (CFTC).
The latest COT data is updated through Tuesday October 29th and shows a quick view of how large traders (for-profit speculators and commercial entities) were positioned in the futures markets.
Weekly Speculator Changes led by Palladium & Steel
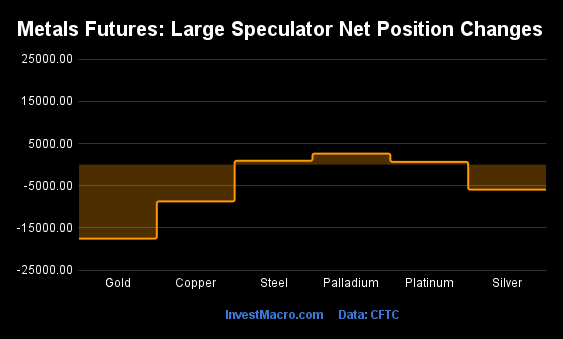
The COT metals markets speculator bets were mixed this week as three out of the six metals markets we cover had higher positioning while the other three markets had lower speculator contracts.
Leading the gains for the metals was Palladium (2,627 contracts) with Steel (925 contracts) and Platinum (667 contracts) also recording positive weeks.
The markets with declines in speculator bets for the week were Gold (-17,551 contracts), Copper (-8,716 contracts) and with Silver (-5,924 contracts) also seeing lower bets on the week.
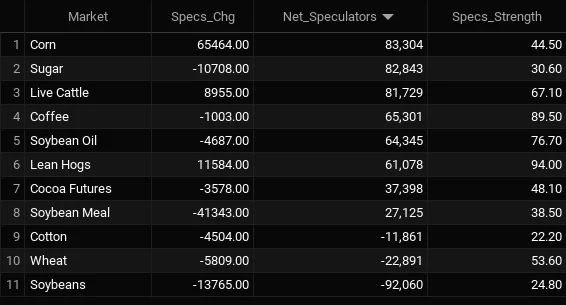
Metals Net Speculators Leaderboard
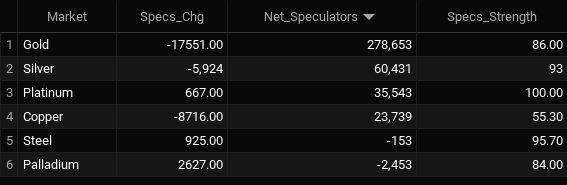
Legend: Weekly Speculators Change | Speculators Current Net Position | Speculators Strength Score compared to last 3-Years (0-100 range)
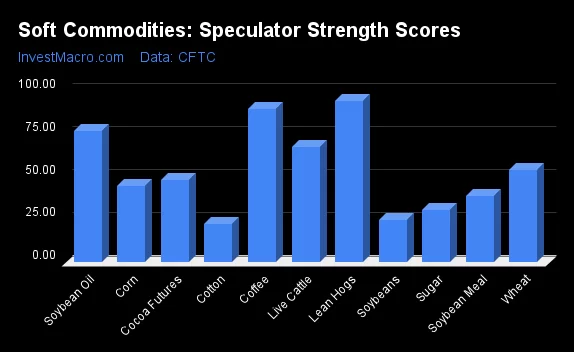
Strength Scores led by Platinum & Steel
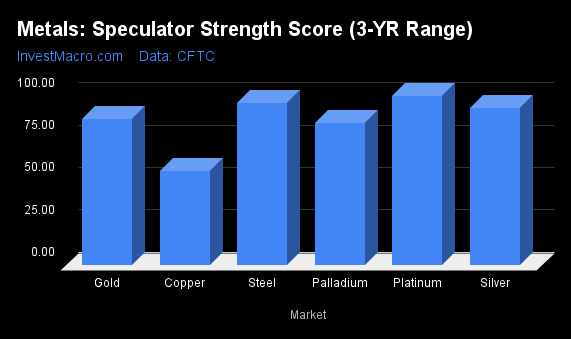
COT Strength Scores (a normalized measure of Speculator positions over a 3-Year range, from 0 to 100 where above 80 is Extreme-Bullish and below 20 is Extreme-Bearish) showed that Platinum (100 percent) and Steel (96 percent) lead the metals markets this week. Gold (86 percent) and Palladium (84 percent) come in as the next highest in the weekly strength scores.
Strength Statistics:
Gold (86.0 percent) vs Gold previous week (92.7 percent)
Silver (92.5 percent) vs Silver previous week (100.0 percent)
Copper (55.3 percent) vs Copper previous week (63.5 percent)
Platinum (100.0 percent) vs Platinum previous week (98.4 percent)
Palladium (84.0 percent) vs Palladium previous week (64.8 percent)
Steel (95.7 percent) vs Palladium previous week (92.2 percent)
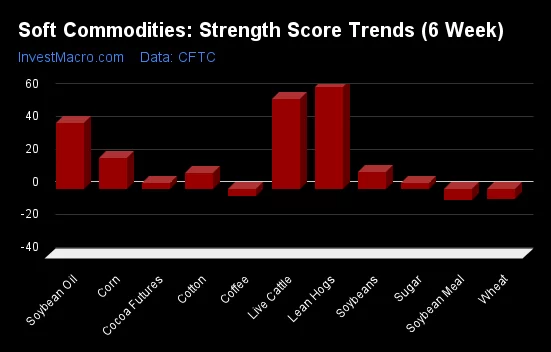
Palladium & Platinum top the 6-Week Strength Trends
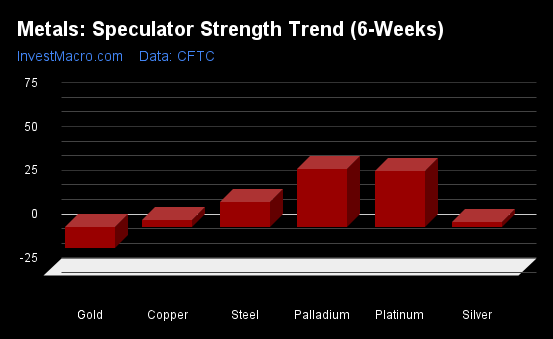
COT Strength Score Trends (or move index, calculates the 6-week changes in strength scores) showed that Palladium (33 percent) and Platinum (32 percent) lead the past six weeks trends for metals. Silver (3 percent) is the next highest positive mover in the latest trends data.
Gold (-12 percent) leads the downside trend scores and is currently the only market with a lower trend score.
Move Statistics:
Gold (-11.9 percent) vs Gold previous week (5.2 percent)
Silver (2.7 percent) vs Silver previous week (27.3 percent)
Copper (3.8 percent) vs Copper previous week (18.3 percent)
Platinum (32.1 percent) vs Platinum previous week (58.8 percent)
Palladium (33.3 percent) vs Palladium previous week (43.3 percent)
Steel (14.4 percent) vs Steel previous week (9.5 percent)
Individual Markets:
Gold Comex Futures:
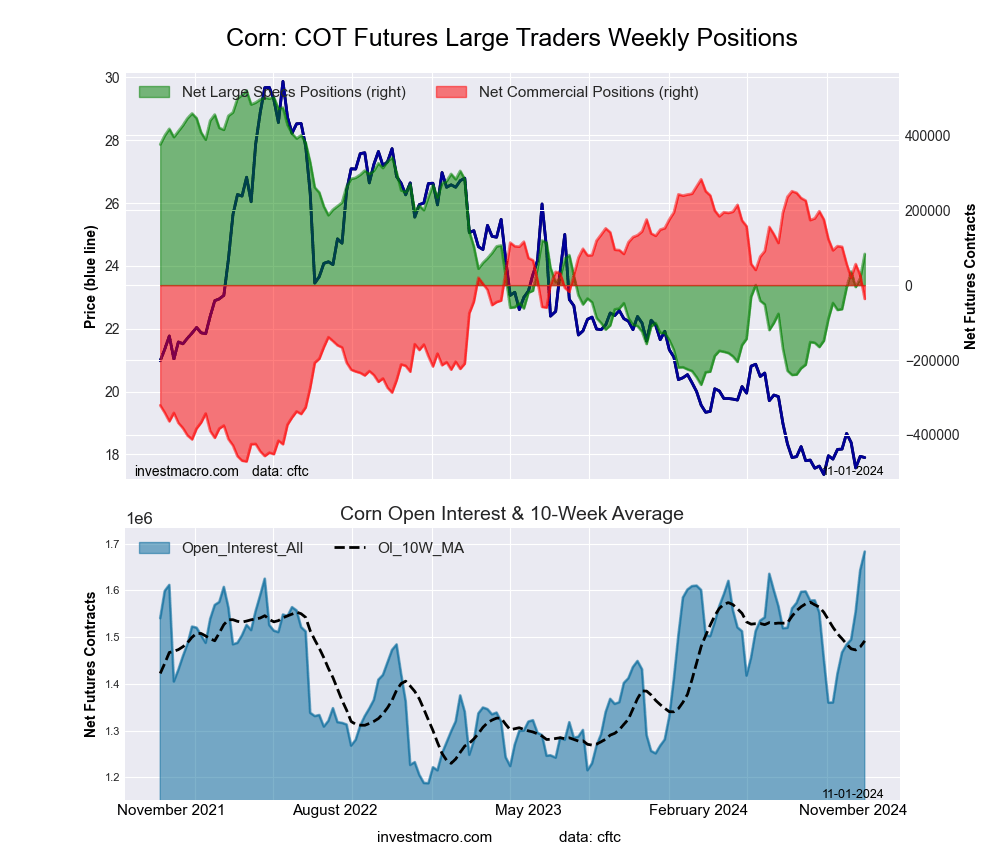
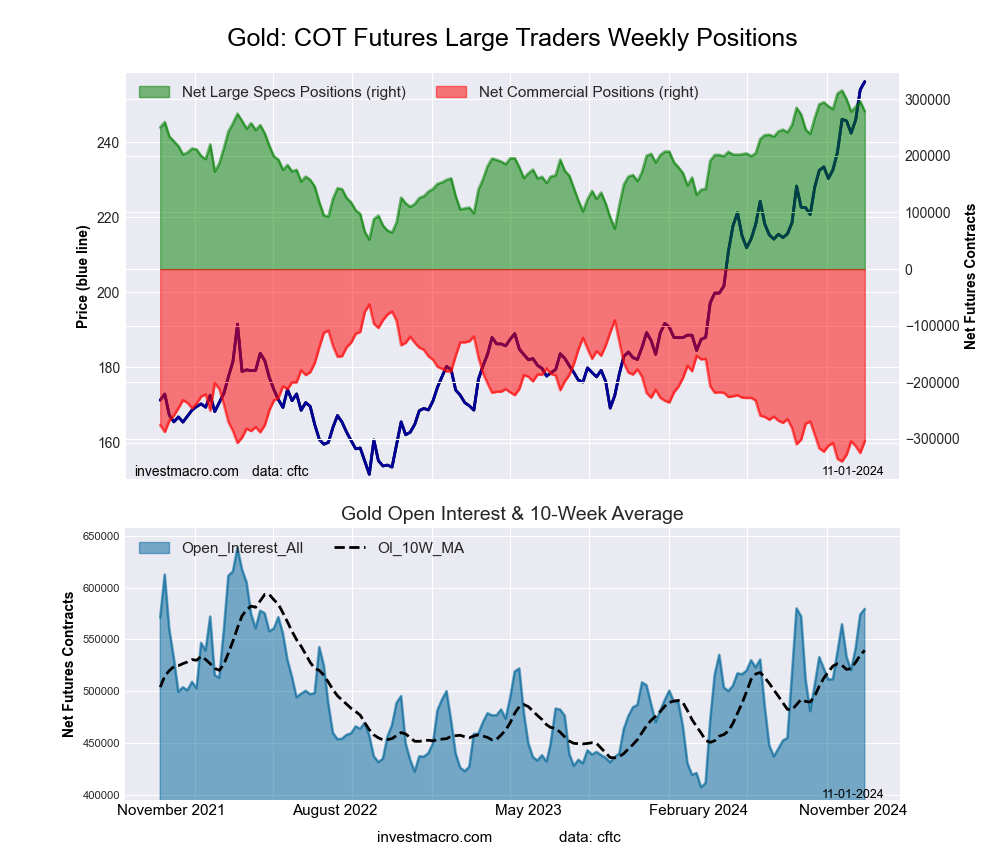 The Gold Comex Futures large speculator standing this week was a net position of 278,653 contracts in the data reported through Tuesday. This was a weekly decrease of -17,551 contracts from the previous week which had a total of 296,204 net contracts.
This week’s current strength score (the trader positioning range over the past three years, measured from 0 to 100) shows the speculators are currently Bullish-Extreme with a score of 86.0 percent. The commercials are Bearish-Extreme with a score of 13.0 percent and the small traders (not shown in chart) are Bullish with a score of 61.2 percent.
Price Trend-Following Model: Uptrend
Our weekly trend-following model classifies the current market price position as: Uptrend.
| Gold Futures Statistics | SPECULATORS | COMMERCIALS | SMALL TRADERS |
| – Percent of Open Interest Longs: | 63.3 | 11.9 | 9.2 |
| – Percent of Open Interest Shorts: | 15.2 | 64.3 | 4.9 |
| – Net Position: | 278,653 | -303,671 | 25,018 |
| – Gross Longs: | 366,636 | 68,935 | 53,432 |
| – Gross Shorts: | 87,983 | 372,606 | 28,414 |
| – Long to Short Ratio: | 4.2 to 1 | 0.2 to 1 | 1.9 to 1 |
| NET POSITION TREND: | |||
| – Strength Index Score (3 Year Range Pct): | 86.0 | 13.0 | 61.2 |
| – Strength Index Reading (3 Year Range): | Bullish-Extreme | Bearish-Extreme | Bullish |
| NET POSITION MOVEMENT INDEX: | |||
| – 6-Week Change in Strength Index: | -11.9 | 11.3 | -0.2 |
Silver Comex Futures:
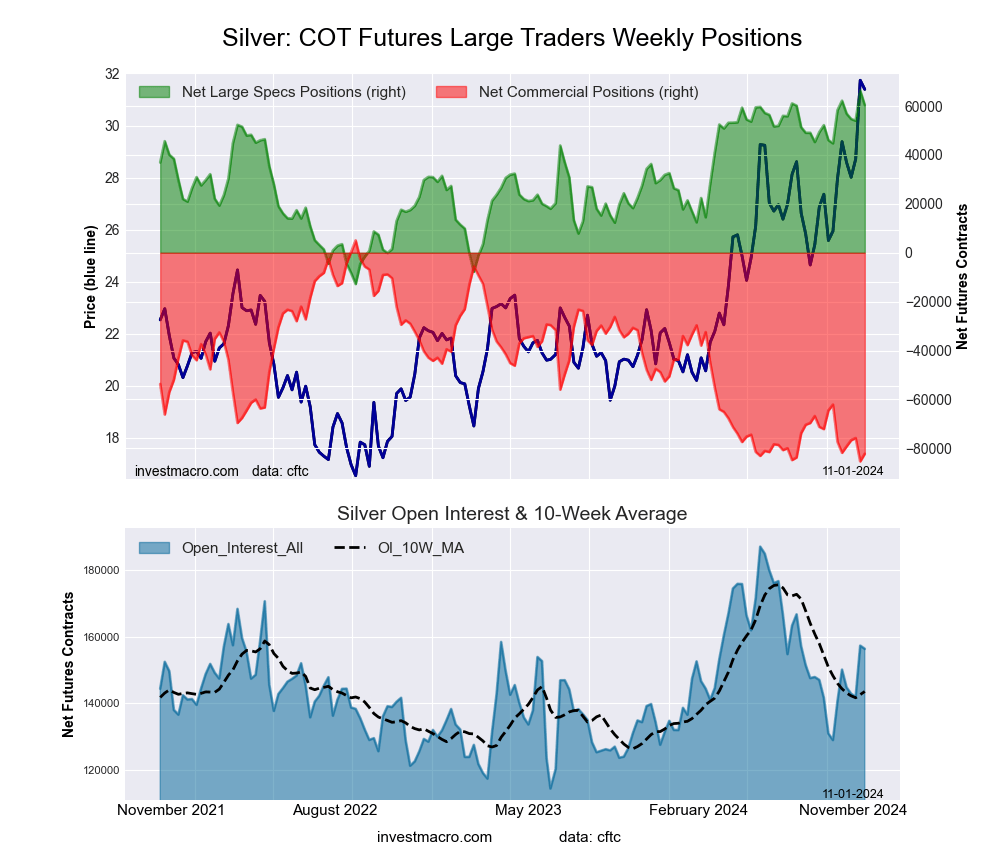 The Silver Comex Futures large speculator standing this week was a net position of 60,431 contracts in the data reported through Tuesday. This was a weekly reduction of -5,924 contracts from the previous week which had a total of 66,355 net contracts.
This week’s current strength score (the trader positioning range over the past three years, measured from 0 to 100) shows the speculators are currently Bullish-Extreme with a score of 92.5 percent. The commercials are Bearish-Extreme with a score of 3.5 percent and the small traders (not shown in chart) are Bullish with a score of 76.1 percent.
Price Trend-Following Model: Strong Uptrend
Our weekly trend-following model classifies the current market price position as: Strong Uptrend.
| Silver Futures Statistics | SPECULATORS | COMMERCIALS | SMALL TRADERS |
| – Percent of Open Interest Longs: | 51.0 | 19.3 | 20.6 |
| – Percent of Open Interest Shorts: | 12.3 | 71.9 | 6.6 |
| – Net Position: | 60,431 | -82,212 | 21,781 |
| – Gross Longs: | 79,649 | 30,224 | 32,166 |
| – Gross Shorts: | 19,218 | 112,436 | 10,385 |
| – Long to Short Ratio: | 4.1 to 1 | 0.3 to 1 | 3.1 to 1 |
| NET POSITION TREND: | |||
| – Strength Index Score (3 Year Range Pct): | 92.5 | 3.5 | 76.1 |
| – Strength Index Reading (3 Year Range): | Bullish-Extreme | Bearish-Extreme | Bullish |
| NET POSITION MOVEMENT INDEX: | |||
| – 6-Week Change in Strength Index: | 2.7 | -5.4 | 13.5 |
Copper Grade #1 Futures:
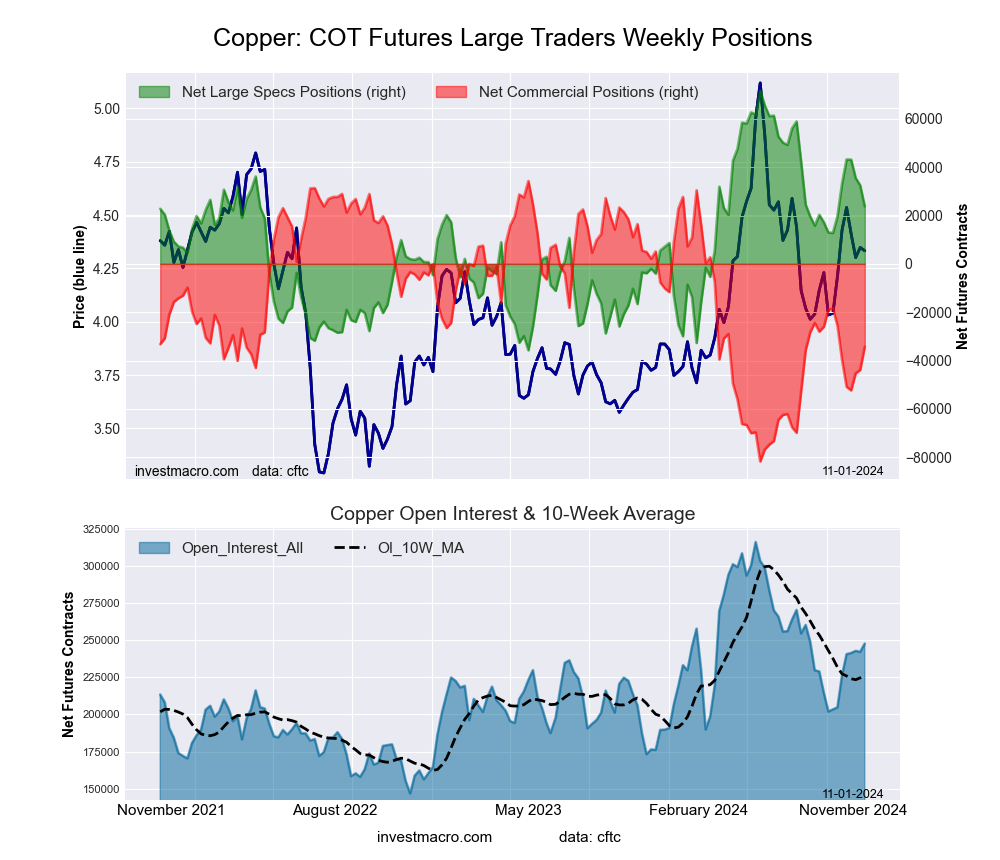 The Copper Grade #1 Futures large speculator standing this week was a net position of 23,739 contracts in the data reported through Tuesday. This was a weekly decrease of -8,716 contracts from the previous week which had a total of 32,455 net contracts.
This week’s current strength score (the trader positioning range over the past three years, measured from 0 to 100) shows the speculators are currently Bullish with a score of 55.3 percent. The commercials are Bearish with a score of 40.9 percent and the small traders (not shown in chart) are Bullish-Extreme with a score of 81.3 percent.
Price Trend-Following Model: Weak Downtrend
Our weekly trend-following model classifies the current market price position as: Weak Downtrend.
| Copper Futures Statistics | SPECULATORS | COMMERCIALS | SMALL TRADERS |
| – Percent of Open Interest Longs: | 39.1 | 34.4 | 8.2 |
| – Percent of Open Interest Shorts: | 29.5 | 48.3 | 4.0 |
| – Net Position: | 23,739 | -34,239 | 10,500 |
| – Gross Longs: | 96,844 | 85,290 | 20,362 |
| – Gross Shorts: | 73,105 | 119,529 | 9,862 |
| – Long to Short Ratio: | 1.3 to 1 | 0.7 to 1 | 2.1 to 1 |
| NET POSITION TREND: | |||
| – Strength Index Score (3 Year Range Pct): | 55.3 | 40.9 | 81.3 |
| – Strength Index Reading (3 Year Range): | Bullish | Bearish | Bullish-Extreme |
| NET POSITION MOVEMENT INDEX: | |||
| – 6-Week Change in Strength Index: | 3.8 | -7.4 | 27.7 |
Platinum Futures:
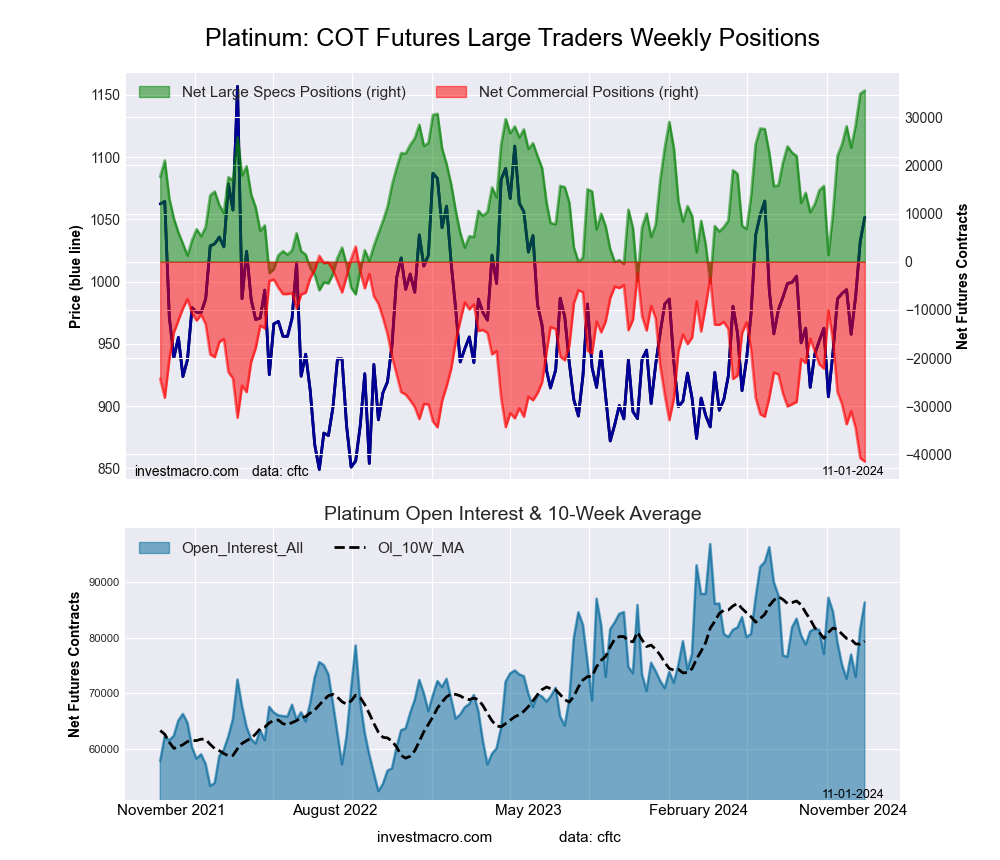 The Platinum Futures large speculator standing this week was a net position of 35,543 contracts in the data reported through Tuesday. This was a weekly rise of 667 contracts from the previous week which had a total of 34,876 net contracts.
This week’s current strength score (the trader positioning range over the past three years, measured from 0 to 100) shows the speculators are currently Bullish-Extreme with a score of 100.0 percent. The commercials are Bearish-Extreme with a score of 0.0 percent and the small traders (not shown in chart) are Bullish with a score of 55.5 percent.
Price Trend-Following Model: Strong Uptrend
Our weekly trend-following model classifies the current market price position as: Strong Uptrend.
| Platinum Futures Statistics | SPECULATORS | COMMERCIALS | SMALL TRADERS |
| – Percent of Open Interest Longs: | 66.6 | 15.4 | 10.9 |
| – Percent of Open Interest Shorts: | 25.4 | 63.4 | 4.1 |
| – Net Position: | 35,543 | -41,451 | 5,908 |
| – Gross Longs: | 57,500 | 13,326 | 9,413 |
| – Gross Shorts: | 21,957 | 54,777 | 3,505 |
| – Long to Short Ratio: | 2.6 to 1 | 0.2 to 1 | 2.7 to 1 |
| NET POSITION TREND: | |||
| – Strength Index Score (3 Year Range Pct): | 100.0 | 0.0 | 55.5 |
| – Strength Index Reading (3 Year Range): | Bullish-Extreme | Bearish-Extreme | Bullish |
| NET POSITION MOVEMENT INDEX: | |||
| – 6-Week Change in Strength Index: | 32.1 | -32.3 | 13.4 |
Palladium Futures:
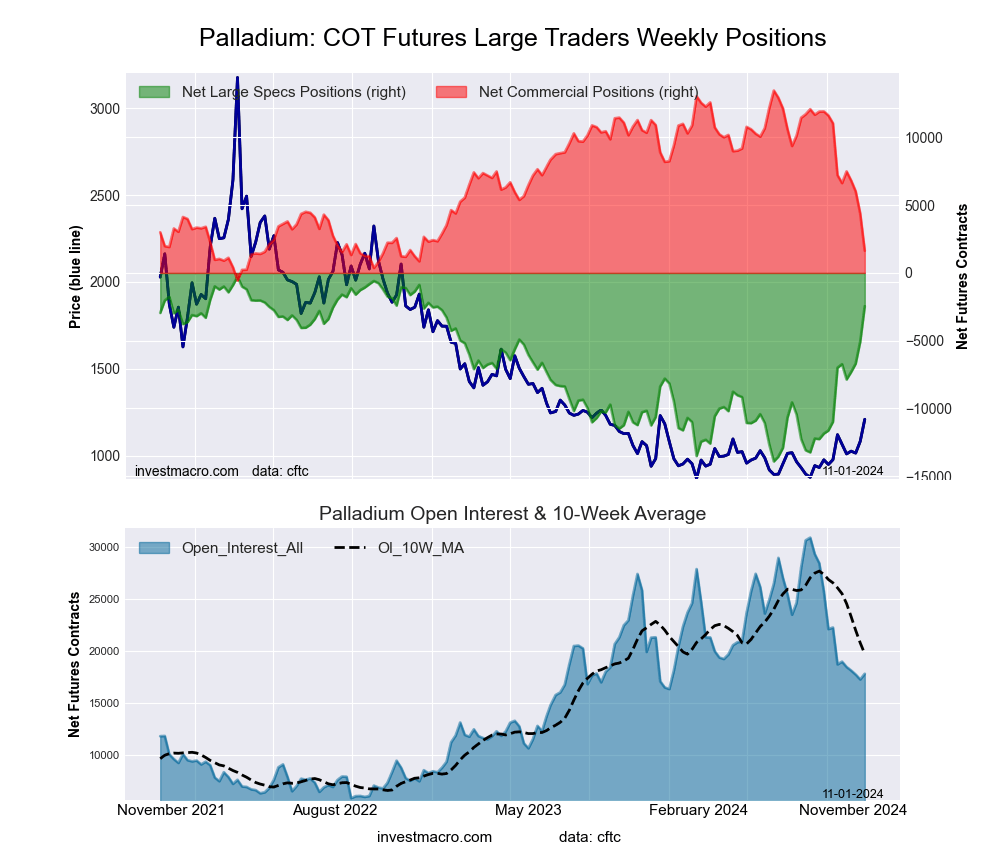 The Palladium Futures large speculator standing this week was a net position of -2,453 contracts in the data reported through Tuesday. This was a weekly advance of 2,627 contracts from the previous week which had a total of -5,080 net contracts.
This week’s current strength score (the trader positioning range over the past three years, measured from 0 to 100) shows the speculators are currently Bullish-Extreme with a score of 84.0 percent. The commercials are Bearish-Extreme with a score of 15.7 percent and the small traders (not shown in chart) are Bullish with a score of 72.9 percent.
Price Trend-Following Model: Strong Uptrend
Our weekly trend-following model classifies the current market price position as: Strong Uptrend.
| Palladium Futures Statistics | SPECULATORS | COMMERCIALS | SMALL TRADERS |
| – Percent of Open Interest Longs: | 36.9 | 44.3 | 13.5 |
| – Percent of Open Interest Shorts: | 50.7 | 35.1 | 8.9 |
| – Net Position: | -2,453 | 1,636 | 817 |
| – Gross Longs: | 6,578 | 7,893 | 2,397 |
| – Gross Shorts: | 9,031 | 6,257 | 1,580 |
| – Long to Short Ratio: | 0.7 to 1 | 1.3 to 1 | 1.5 to 1 |
| NET POSITION TREND: | |||
| – Strength Index Score (3 Year Range Pct): | 84.0 | 15.7 | 72.9 |
| – Strength Index Reading (3 Year Range): | Bullish-Extreme | Bearish-Extreme | Bullish |
| NET POSITION MOVEMENT INDEX: | |||
| – 6-Week Change in Strength Index: | 33.3 | -39.9 | 50.3 |
Steel Futures Futures:
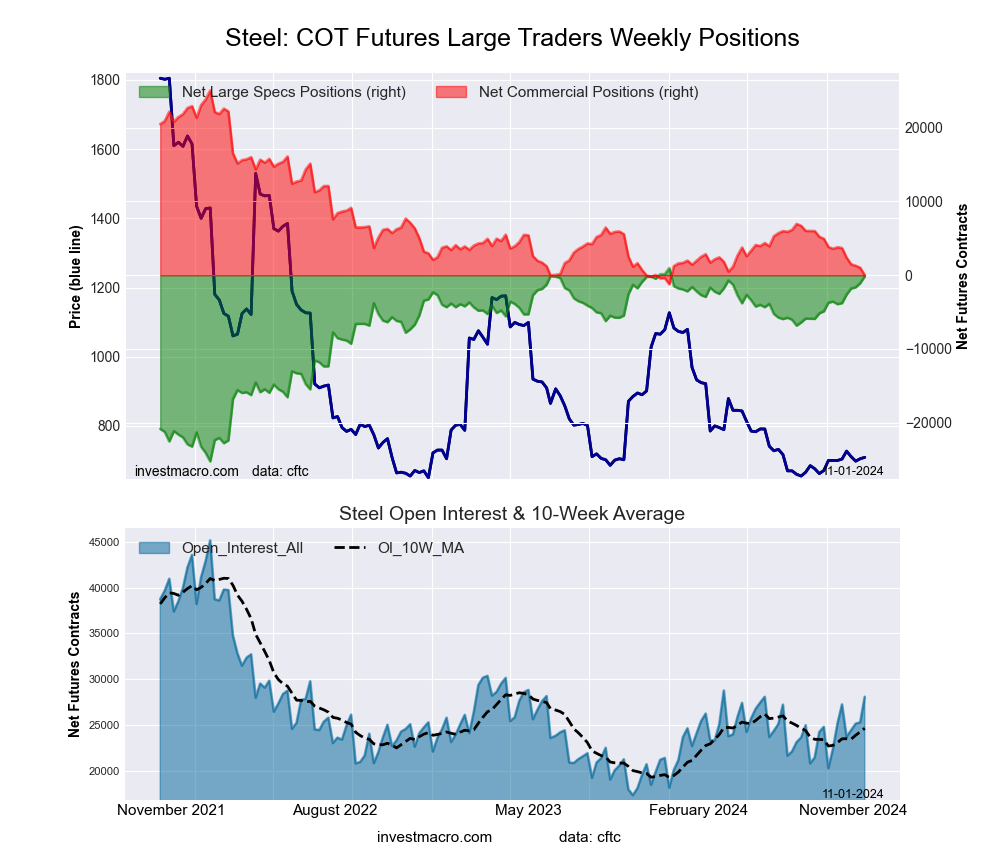 The Steel Futures large speculator standing this week was a net position of -153 contracts in the data reported through Tuesday. This was a weekly increase of 925 contracts from the previous week which had a total of -1,078 net contracts.
This week’s current strength score (the trader positioning range over the past three years, measured from 0 to 100) shows the speculators are currently Bullish-Extreme with a score of 95.7 percent. The commercials are Bearish-Extreme with a score of 4.6 percent and the small traders (not shown in chart) are Bearish with a score of 48.6 percent.
Price Trend-Following Model: Strong Uptrend
Our weekly trend-following model classifies the current market price position as: Strong Uptrend.
| Steel Futures Statistics | SPECULATORS | COMMERCIALS | SMALL TRADERS |
| – Percent of Open Interest Longs: | 26.8 | 67.6 | 1.1 |
| – Percent of Open Interest Shorts: | 27.3 | 67.6 | 0.6 |
| – Net Position: | -153 | 5 | 148 |
| – Gross Longs: | 7,521 | 18,979 | 310 |
| – Gross Shorts: | 7,674 | 18,974 | 162 |
| – Long to Short Ratio: | 1.0 to 1 | 1.0 to 1 | 1.9 to 1 |
| NET POSITION TREND: | |||
| – Strength Index Score (3 Year Range Pct): | 95.7 | 4.6 | 48.6 |
| – Strength Index Reading (3 Year Range): | Bullish-Extreme | Bearish-Extreme | Bearish |
| NET POSITION MOVEMENT INDEX: | |||
| – 6-Week Change in Strength Index: | 14.4 | -14.4 | 2.2 |
Article By InvestMacro – Receive our weekly COT Newsletter
*COT Report: The COT data, released weekly to the public each Friday, is updated through the most recent Tuesday (data is 3 days old) and shows a quick view of how large speculators or non-commercials (for-profit traders) were positioned in the futures markets.
The CFTC categorizes trader positions according to commercial hedgers (traders who use futures contracts for hedging as part of the business), non-commercials (large traders who speculate to realize trading profits) and nonreportable traders (usually small traders/speculators) as well as their open interest (contracts open in the market at time of reporting). See CFTC criteria here.