By InvestMacro
Here are the latest charts and statistics for the Commitment of Traders (COT) data published by the Commodities Futures Trading Commission (CFTC).
The latest COT data is updated through Tuesday January 28th and shows a quick view of how large market participants (for-profit speculators and commercial traders) were positioned in the futures markets. All currency positions are in direct relation to the US dollar where, for example, a bet for the euro is a bet that the euro will rise versus the dollar while a bet against the euro will be a bet that the euro will decline versus the dollar.
Weekly Speculator Bets led by Japanese Yen & Mexican Peso
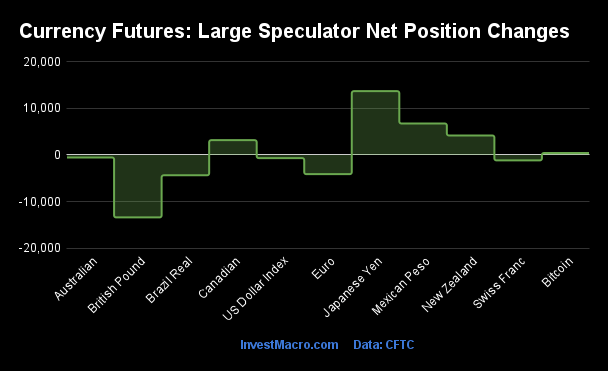
The COT currency market speculator bets were overall lower this week as five out of the eleven currency markets we cover had higher positioning while the other six markets had lower speculator contracts.
Leading the gains for the currency markets was the Japanese Yen (13,714 contracts), the Mexican Peso (6,768 contracts), the New Zealand Dollar (4,192 contracts), the Canadian Dollar (3,186 contracts) and with Bitcoin (426 contracts) also showing positive weeks.
The currencies seeing declines in speculator bets on the week were the British Pound (-13,415 contracts), the EuroFX (-4,118 contracts), the Brazilian Real (-4,363 contracts), the Swiss Franc (-1,163 contracts), the US Dollar Index (-672 contracts) and the Australian Dollar (-535 contracts) also registering lower bets on the week.
US Dollar Speculator bets continue to shine vs major currencies
Highlighting the COT currency’s data this week is current positioning for the US Dollar against the major currencies. Despite a small dip in the US Dollar Index positioning this week, the other major currencies are overwhelmingly in negative or bearish net positions versus the US Dollar. All major currency positions in the COT markets are in direct relation to the US Dollar and, currently, eight out of the nine foreign currency levels are in bearish territory.
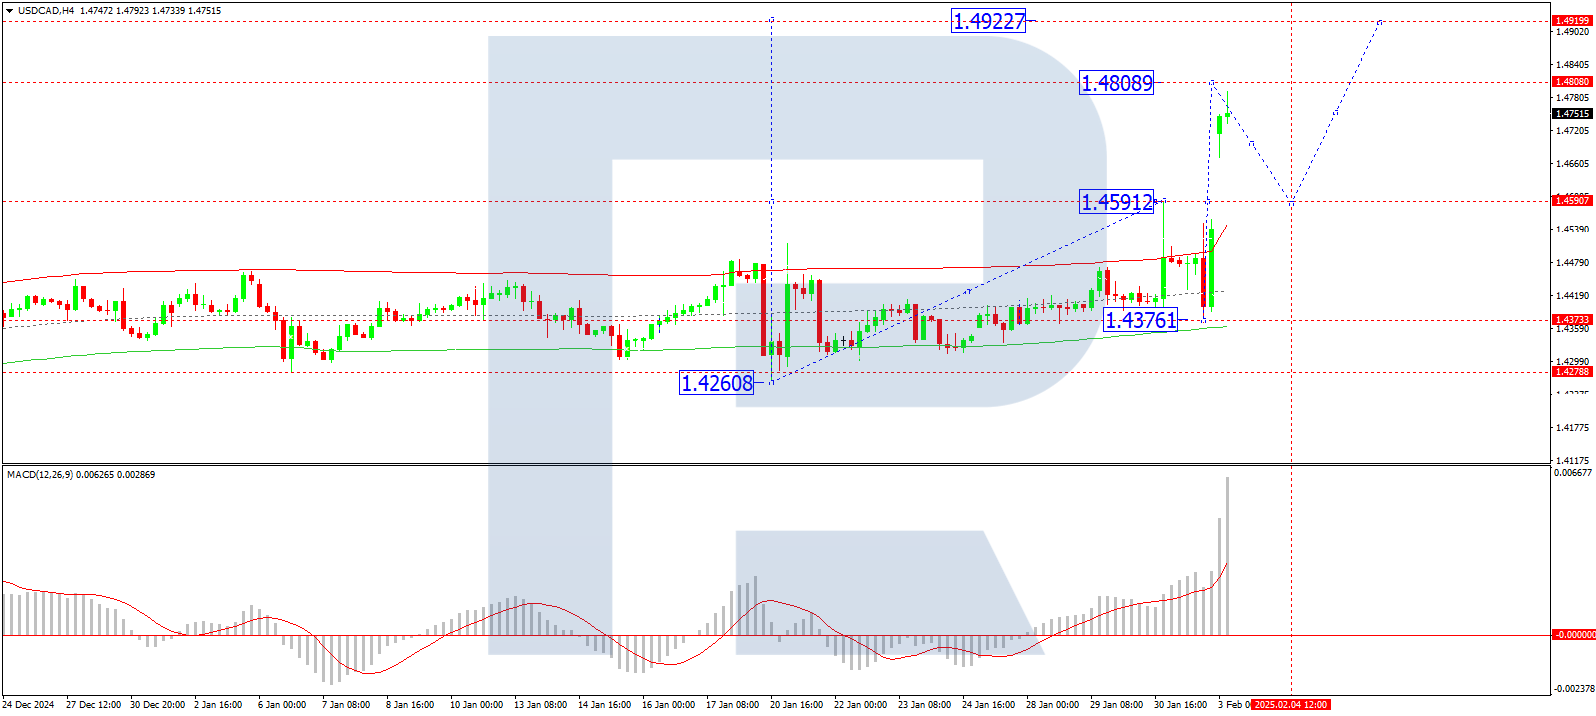
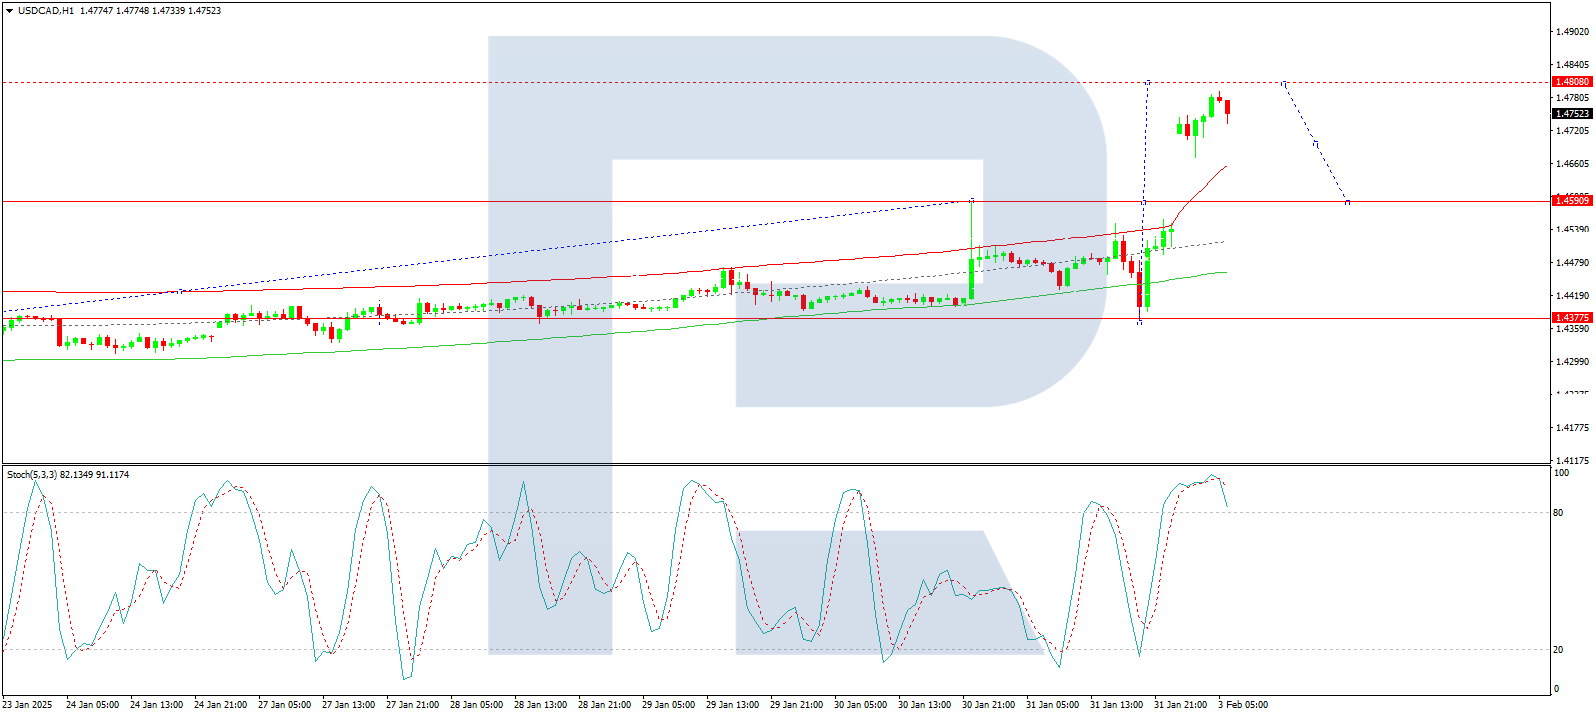
The most bearish position at the moment is the Canadian dollar at a total of -147,601 contracts. The CAD position has been over the -100,000 contract threshold for sixteen straight weeks and in twenty-eight out of the past thirty-four weeks. Overall, the CAD positioning has been in a continuous bearish level for seventy-eight straight weeks. The Canadian dollar exchange rate versus the Dollar has been falling sharply is currently at the lowest level since March of 2020 at the 0.6905 price.
The Australian dollar, New Zealand dollar, Swiss franc, Brazilian real and the Euro positions are all between -38,000 and -71,000 net speculator contracts this week. All of these currencies are in extreme bearish readings in the speculator strength scores which compares their current level to the past three years. The exchange rates for these currencies have all been in multi-year low-points as well over the past month except for the Swiss franc which has been trading around its 200-week moving average and the lowest level since May 2024.
The British pound sterling is not quite in an extreme bearish level but does remain in an overall bearish net standing at -21,672 contracts. The GBP exchange rate versus the Dollar is right under the 1.2400 threshold currently and recently touched the lowest level since 2023 near the 1.2100 exchange.
The Japanese yen which has seen its exchange rate at multi-decade lows for the past couple of years but is faring better than most of the other major currencies in speculator positioning. The JPY speculator bets are just at -959 contracts this week. The exchange rate does remain near the bottom of the range of the multi-decade lows but the speculator sentiment has come off the extremely negative levels from the past couple of years and has been helped out by the Bank of Japan’s latest monetary move of an interest rate increase.
The only major currency with a bullish speculator position this week versus the Dollar is the Mexican peso. The peso has been the one currency with strong speculator positions over the past few years with positive or bullish levels dating back to March of 2023. Last week, on January 21st, the position dipped into a small bearish level but bounced back this week into a small bullish standing. The exchange rate for the peso has been on the decline from last summer and has fallen to the lowest levels since 2022 at the 0.4801 exchange rate price.
Currencies Net Speculators Leaderboard
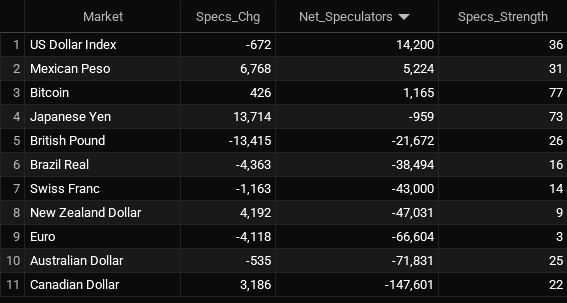
Legend: Weekly Speculators Change | Speculators Current Net Position | Speculators Strength Score compared to last 3-Years (0-100 range)
Strength Scores led by Bitcoin & Japanese Yen
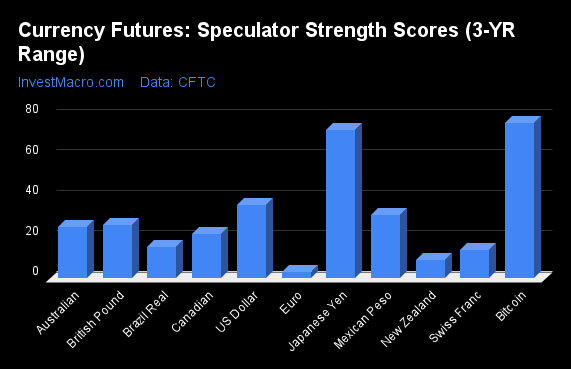
COT Strength Scores (a normalized measure of Speculator positions over a 3-Year range, from 0 to 100 where above 80 is Extreme-Bullish and below 20 is Extreme-Bearish) showed that Bitcoin (77 percent) and the Japanese Yen (73 percent) lead the currency markets this week.
On the downside, the EuroFX (3 percent), the New Zealand Dollar (9 percent), the Swiss Franc (14 percent) and the Brazilian Real (16 percent) come in at the lowest strength levels currently and are in Extreme-Bearish territory (below 20 percent).
3-Year Strength Statistics:
US Dollar Index (36.1 percent) vs US Dollar Index previous week (37.5 percent)
EuroFX (3.4 percent) vs EuroFX previous week (5.0 percent)
British Pound Sterling (26.4 percent) vs British Pound Sterling previous week (32.4 percent)
Japanese Yen (73.2 percent) vs Japanese Yen previous week (67.8 percent)
Swiss Franc (13.8 percent) vs Swiss Franc previous week (16.1 percent)
Canadian Dollar (21.8 percent) vs Canadian Dollar previous week (20.4 percent)
Australian Dollar (25.3 percent) vs Australian Dollar previous week (25.7 percent)
New Zealand Dollar (8.9 percent) vs New Zealand Dollar previous week (4.0 percent)
Mexican Peso (31.4 percent) vs Mexican Peso previous week (28.0 percent)
Brazilian Real (15.6 percent) vs Brazilian Real previous week (19.7 percent)
Bitcoin (76.7 percent) vs Bitcoin previous week (67.4 percent)
Bitcoin & US Dollar Index top the 6-Week Strength Trends
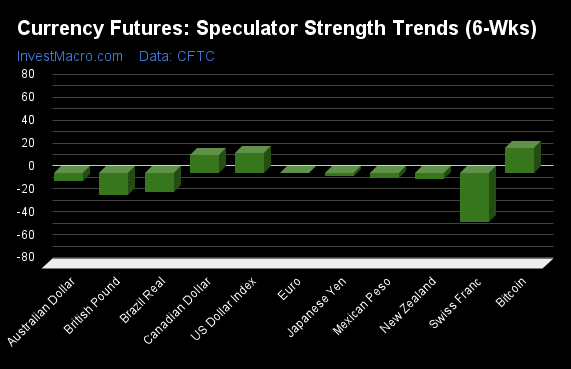
COT Strength Score Trends (or move index, calculates the 6-week changes in strength scores) showed that the Bitcoin (22 percent) and the US Dollar Index (18 percent) lead the past six weeks trends for the currencies. The Canadian Dollar (15 percent) is the next highest positive mover in the 3-Year trends data.
The Swiss Franc (-43 percent) leads the downside trend scores currently with the British Pound (-20 percent), Brazilian Real (-17 percent) and the Australian Dollar (-7 percent) following next with lower trend scores.
3-Year Strength Trends:
US Dollar Index (17.7 percent) vs US Dollar Index previous week (37.5 percent)
EuroFX (-0.3 percent) vs EuroFX previous week (5.0 percent)
British Pound Sterling (-19.5 percent) vs British Pound Sterling previous week (-15.9 percent)
Japanese Yen (-2.8 percent) vs Japanese Yen previous week (-16.2 percent)
Swiss Franc (-43.0 percent) vs Swiss Franc previous week (-13.9 percent)
Canadian Dollar (15.4 percent) vs Canadian Dollar previous week (13.8 percent)
Australian Dollar (-7.3 percent) vs Australian Dollar previous week (-56.6 percent)
New Zealand Dollar (-5.3 percent) vs New Zealand Dollar previous week (-27.0 percent)
Mexican Peso (-4.8 percent) vs Mexican Peso previous week (-4.8 percent)
Brazilian Real (-16.7 percent) vs Brazilian Real previous week (-16.8 percent)
Bitcoin (21.7 percent) vs Bitcoin previous week (31.8 percent)
Individual COT Forex Markets:
US Dollar Index Futures:
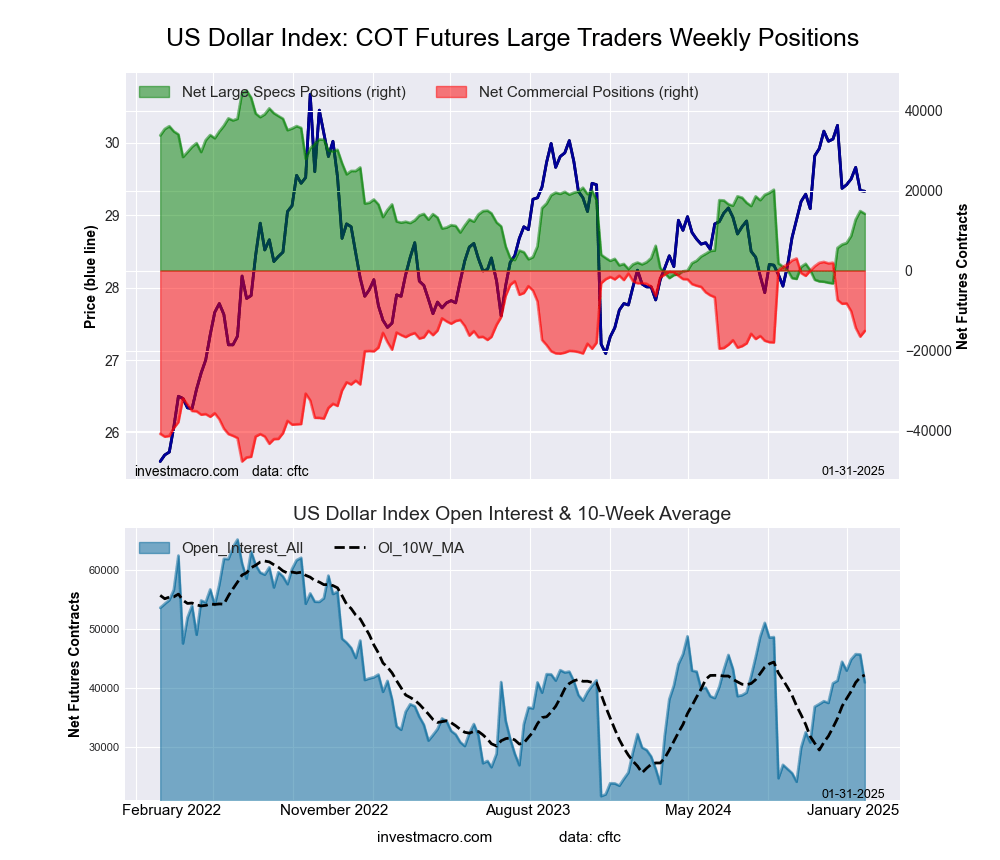 The US Dollar Index large speculator standing this week was a net position of 14,200 contracts in the data reported through Tuesday. This was a weekly fall of -672 contracts from the previous week which had a total of 14,872 net contracts.
This week’s current strength score (the trader positioning range over the past three years, measured from 0 to 100) shows the speculators are currently Bearish with a score of 36.1 percent. The commercials are Bullish with a score of 64.3 percent and the small traders (not shown in chart) are Bearish with a score of 33.8 percent.
Price Trend-Following Model: Uptrend
Our weekly trend-following model classifies the current market price position as: Uptrend.
| US DOLLAR INDEX Statistics | SPECULATORS | COMMERCIALS | SMALL TRADERS |
| – Percent of Open Interest Longs: | 61.9 | 25.6 | 9.5 |
| – Percent of Open Interest Shorts: | 27.3 | 62.4 | 7.3 |
| – Net Position: | 14,200 | -15,106 | 906 |
| – Gross Longs: | 25,372 | 10,484 | 3,888 |
| – Gross Shorts: | 11,172 | 25,590 | 2,982 |
| – Long to Short Ratio: | 2.3 to 1 | 0.4 to 1 | 1.3 to 1 |
| NET POSITION TREND: | | | |
| – Strength Index Score (3 Year Range Pct): | 36.1 | 64.3 | 33.8 |
| – Strength Index Reading (3 Year Range): | Bearish | Bullish | Bearish |
| NET POSITION MOVEMENT INDEX: | | | |
| – 6-Week Change in Strength Index: | 17.7 | -15.3 | -8.6 |
Euro Currency Futures:
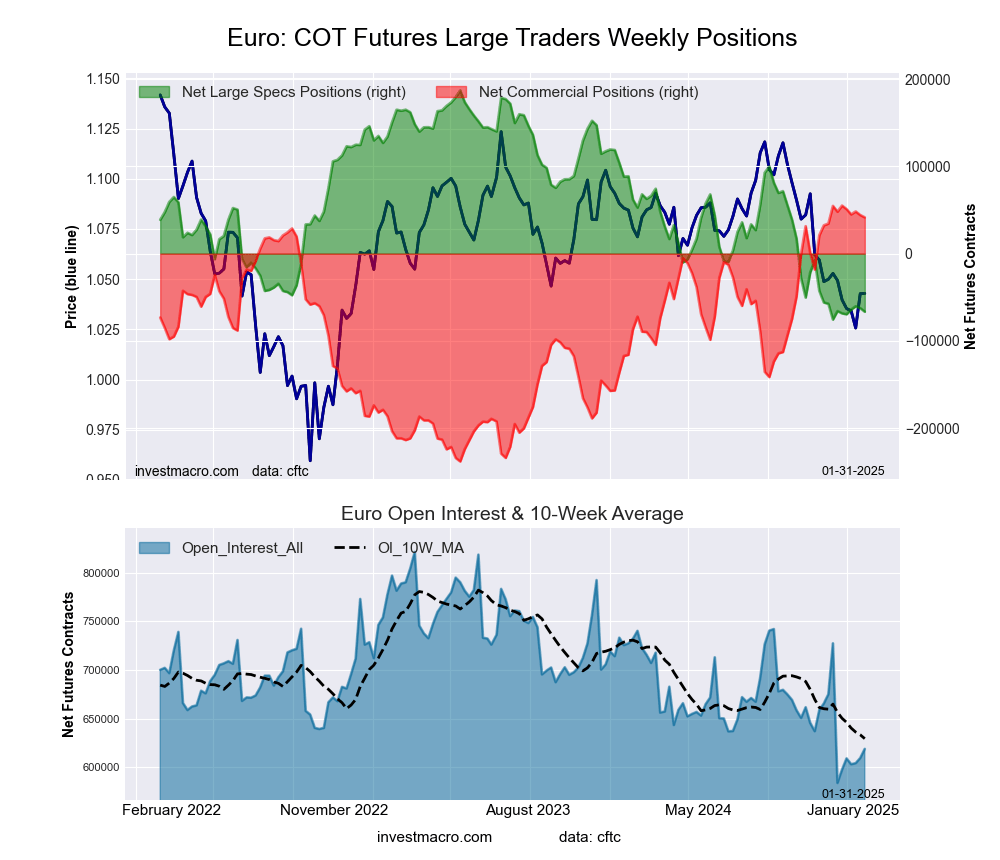 The Euro Currency large speculator standing this week was a net position of -66,604 contracts in the data reported through Tuesday. This was a weekly lowering of -4,118 contracts from the previous week which had a total of -62,486 net contracts.
This week’s current strength score (the trader positioning range over the past three years, measured from 0 to 100) shows the speculators are currently Bearish-Extreme with a score of 3.4 percent. The commercials are Bullish-Extreme with a score of 95.4 percent and the small traders (not shown in chart) are Bearish with a score of 28.8 percent.
Price Trend-Following Model: Downtrend
Our weekly trend-following model classifies the current market price position as: Downtrend.
| EURO Currency Statistics | SPECULATORS | COMMERCIALS | SMALL TRADERS |
| – Percent of Open Interest Longs: | 24.8 | 57.3 | 12.3 |
| – Percent of Open Interest Shorts: | 35.6 | 50.6 | 8.2 |
| – Net Position: | -66,604 | 41,595 | 25,009 |
| – Gross Longs: | 153,660 | 354,830 | 75,982 |
| – Gross Shorts: | 220,264 | 313,235 | 50,973 |
| – Long to Short Ratio: | 0.7 to 1 | 1.1 to 1 | 1.5 to 1 |
| NET POSITION TREND: | | | |
| – Strength Index Score (3 Year Range Pct): | 3.4 | 95.4 | 28.8 |
| – Strength Index Reading (3 Year Range): | Bearish-Extreme | Bullish-Extreme | Bearish |
| NET POSITION MOVEMENT INDEX: | | | |
| – 6-Week Change in Strength Index: | -0.3 | -2.2 | 16.0 |
British Pound Sterling Futures:
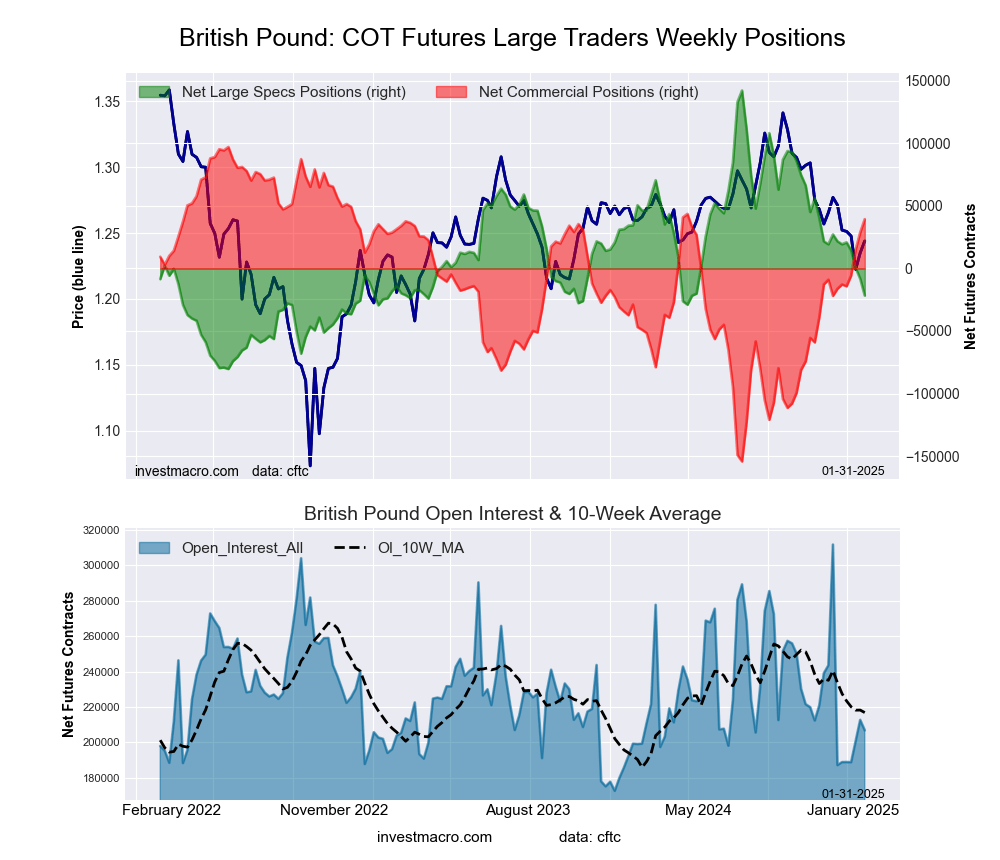 The British Pound Sterling large speculator standing this week was a net position of -21,672 contracts in the data reported through Tuesday. This was a weekly lowering of -13,415 contracts from the previous week which had a total of -8,257 net contracts.
This week’s current strength score (the trader positioning range over the past three years, measured from 0 to 100) shows the speculators are currently Bearish with a score of 26.4 percent. The commercials are Bullish with a score of 77.0 percent and the small traders (not shown in chart) are Bearish with a score of 25.0 percent.
Price Trend-Following Model: Downtrend
Our weekly trend-following model classifies the current market price position as: Downtrend.
| BRITISH POUND Statistics | SPECULATORS | COMMERCIALS | SMALL TRADERS |
| – Percent of Open Interest Longs: | 28.7 | 58.7 | 10.2 |
| – Percent of Open Interest Shorts: | 39.2 | 39.7 | 18.7 |
| – Net Position: | -21,672 | 39,354 | -17,682 |
| – Gross Longs: | 59,331 | 121,421 | 21,081 |
| – Gross Shorts: | 81,003 | 82,067 | 38,763 |
| – Long to Short Ratio: | 0.7 to 1 | 1.5 to 1 | 0.5 to 1 |
| NET POSITION TREND: | | | |
| – Strength Index Score (3 Year Range Pct): | 26.4 | 77.0 | 25.0 |
| – Strength Index Reading (3 Year Range): | Bearish | Bullish | Bearish |
| NET POSITION MOVEMENT INDEX: | | | |
| – 6-Week Change in Strength Index: | -19.5 | 22.1 | -25.8 |
Japanese Yen Futures:
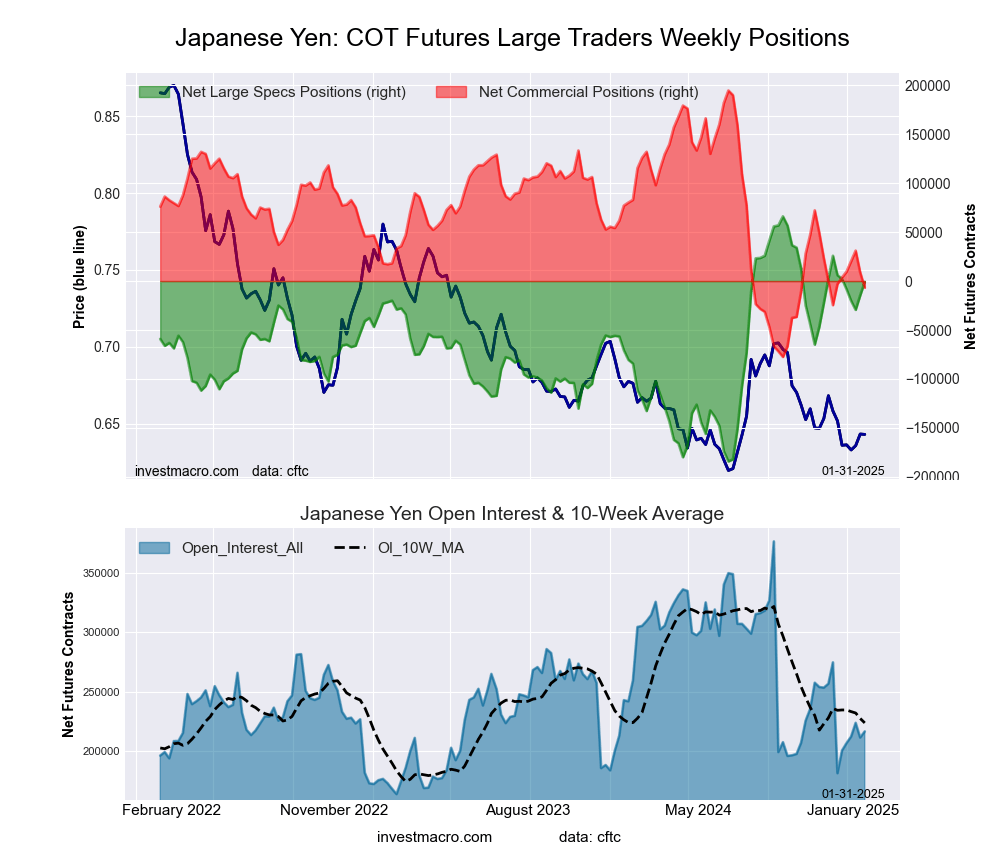 The Japanese Yen large speculator standing this week was a net position of -959 contracts in the data reported through Tuesday. This was a weekly advance of 13,714 contracts from the previous week which had a total of -14,673 net contracts.
This week’s current strength score (the trader positioning range over the past three years, measured from 0 to 100) shows the speculators are currently Bullish with a score of 73.2 percent. The commercials are Bearish with a score of 26.0 percent and the small traders (not shown in chart) are Bullish-Extreme with a score of 82.3 percent.
Price Trend-Following Model: Downtrend
Our weekly trend-following model classifies the current market price position as: Downtrend.
| JAPANESE YEN Statistics | SPECULATORS | COMMERCIALS | SMALL TRADERS |
| – Percent of Open Interest Longs: | 44.7 | 31.7 | 20.4 |
| – Percent of Open Interest Shorts: | 45.1 | 34.8 | 16.8 |
| – Net Position: | -959 | -6,737 | 7,696 |
| – Gross Longs: | 96,809 | 68,683 | 44,173 |
| – Gross Shorts: | 97,768 | 75,420 | 36,477 |
| – Long to Short Ratio: | 1.0 to 1 | 0.9 to 1 | 1.2 to 1 |
| NET POSITION TREND: | | | |
| – Strength Index Score (3 Year Range Pct): | 73.2 | 26.0 | 82.3 |
| – Strength Index Reading (3 Year Range): | Bullish | Bearish | Bullish-Extreme |
| NET POSITION MOVEMENT INDEX: | | | |
| – 6-Week Change in Strength Index: | -2.8 | -1.3 | 25.6 |
Swiss Franc Futures:
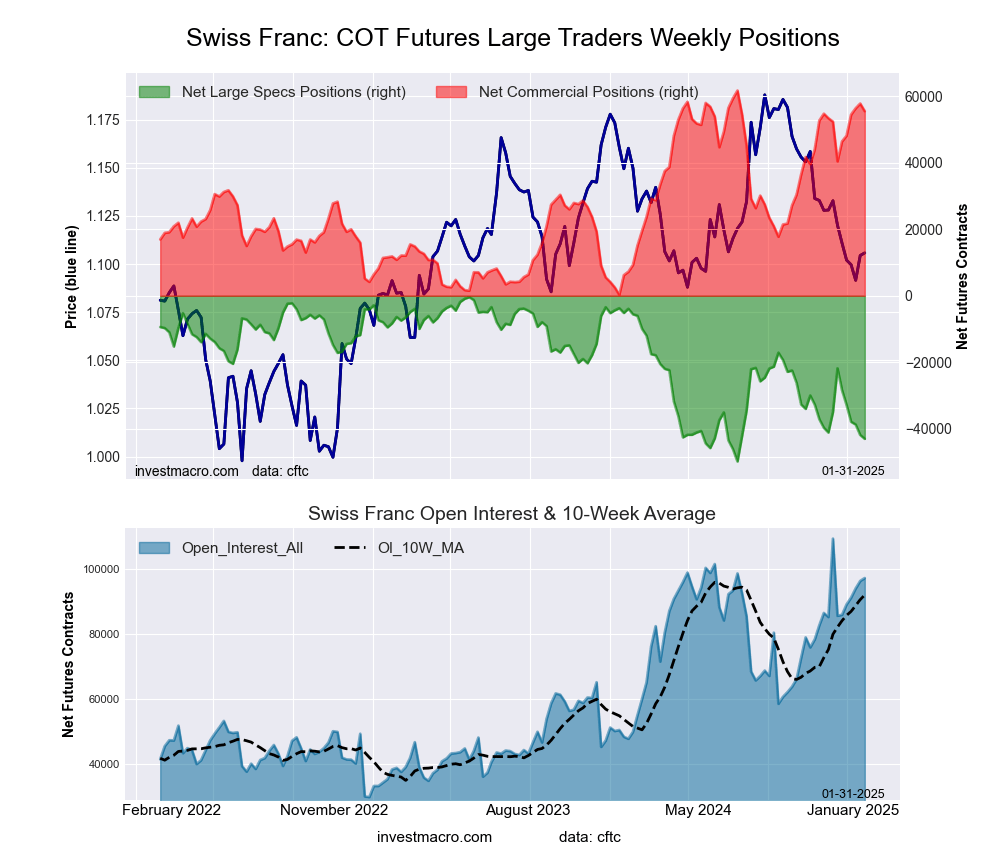 The Swiss Franc large speculator standing this week was a net position of -43,000 contracts in the data reported through Tuesday. This was a weekly decline of -1,163 contracts from the previous week which had a total of -41,837 net contracts.
This week’s current strength score (the trader positioning range over the past three years, measured from 0 to 100) shows the speculators are currently Bearish-Extreme with a score of 13.8 percent. The commercials are Bullish-Extreme with a score of 89.9 percent and the small traders (not shown in chart) are Bearish with a score of 26.0 percent.
Price Trend-Following Model: Downtrend
Our weekly trend-following model classifies the current market price position as: Downtrend.
| SWISS FRANC Statistics | SPECULATORS | COMMERCIALS | SMALL TRADERS |
| – Percent of Open Interest Longs: | 5.1 | 85.8 | 8.7 |
| – Percent of Open Interest Shorts: | 49.3 | 28.8 | 21.5 |
| – Net Position: | -43,000 | 55,450 | -12,450 |
| – Gross Longs: | 4,996 | 83,473 | 8,491 |
| – Gross Shorts: | 47,996 | 28,023 | 20,941 |
| – Long to Short Ratio: | 0.1 to 1 | 3.0 to 1 | 0.4 to 1 |
| NET POSITION TREND: | | | |
| – Strength Index Score (3 Year Range Pct): | 13.8 | 89.9 | 26.0 |
| – Strength Index Reading (3 Year Range): | Bearish-Extreme | Bullish-Extreme | Bearish |
| NET POSITION MOVEMENT INDEX: | | | |
| – 6-Week Change in Strength Index: | -43.0 | 24.5 | 26.0 |
Canadian Dollar Futures:
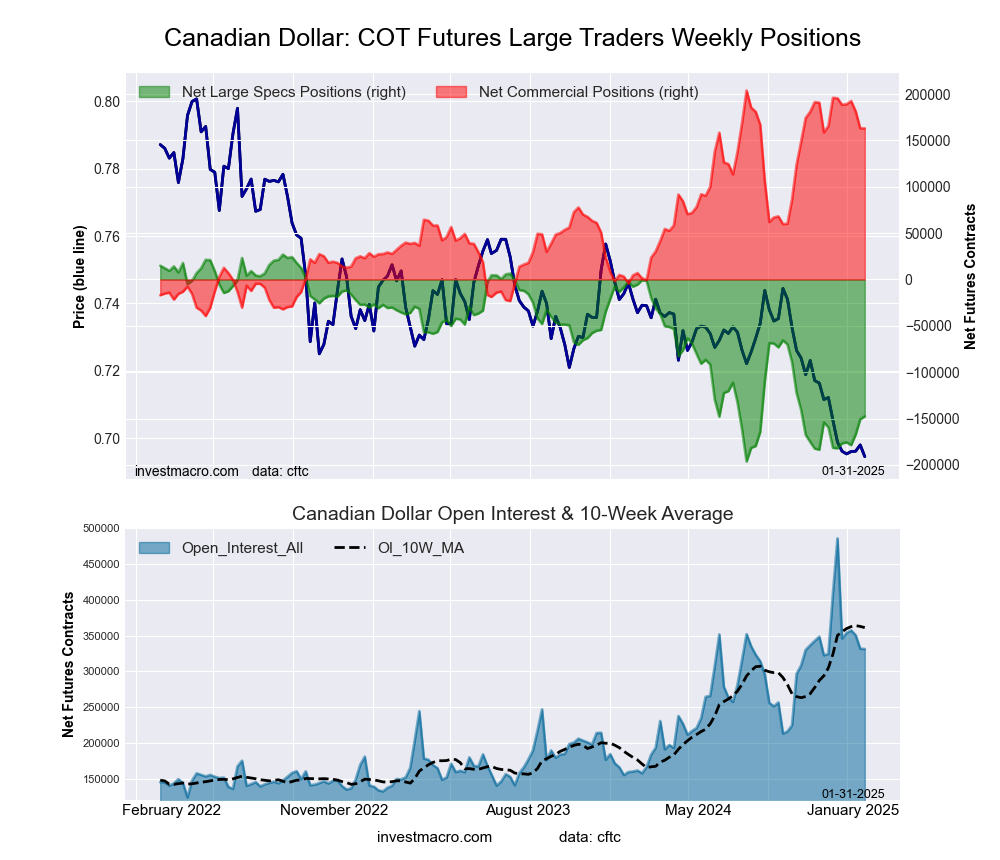 The Canadian Dollar large speculator standing this week was a net position of -147,601 contracts in the data reported through Tuesday. This was a weekly advance of 3,186 contracts from the previous week which had a total of -150,787 net contracts.
This week’s current strength score (the trader positioning range over the past three years, measured from 0 to 100) shows the speculators are currently Bearish with a score of 21.8 percent. The commercials are Bullish-Extreme with a score of 83.2 percent and the small traders (not shown in chart) are Bearish-Extreme with a score of 0.0 percent.
Price Trend-Following Model: Downtrend
Our weekly trend-following model classifies the current market price position as: Downtrend.
| CANADIAN DOLLAR Statistics | SPECULATORS | COMMERCIALS | SMALL TRADERS |
| – Percent of Open Interest Longs: | 6.4 | 83.4 | 8.0 |
| – Percent of Open Interest Shorts: | 51.0 | 34.2 | 12.6 |
| – Net Position: | -147,601 | 162,970 | -15,369 |
| – Gross Longs: | 21,219 | 276,259 | 26,467 |
| – Gross Shorts: | 168,820 | 113,289 | 41,836 |
| – Long to Short Ratio: | 0.1 to 1 | 2.4 to 1 | 0.6 to 1 |
| NET POSITION TREND: | | | |
| – Strength Index Score (3 Year Range Pct): | 21.8 | 83.2 | 0.0 |
| – Strength Index Reading (3 Year Range): | Bearish | Bullish-Extreme | Bearish-Extreme |
| NET POSITION MOVEMENT INDEX: | | | |
| – 6-Week Change in Strength Index: | 15.4 | -13.4 | -5.1 |
Australian Dollar Futures:
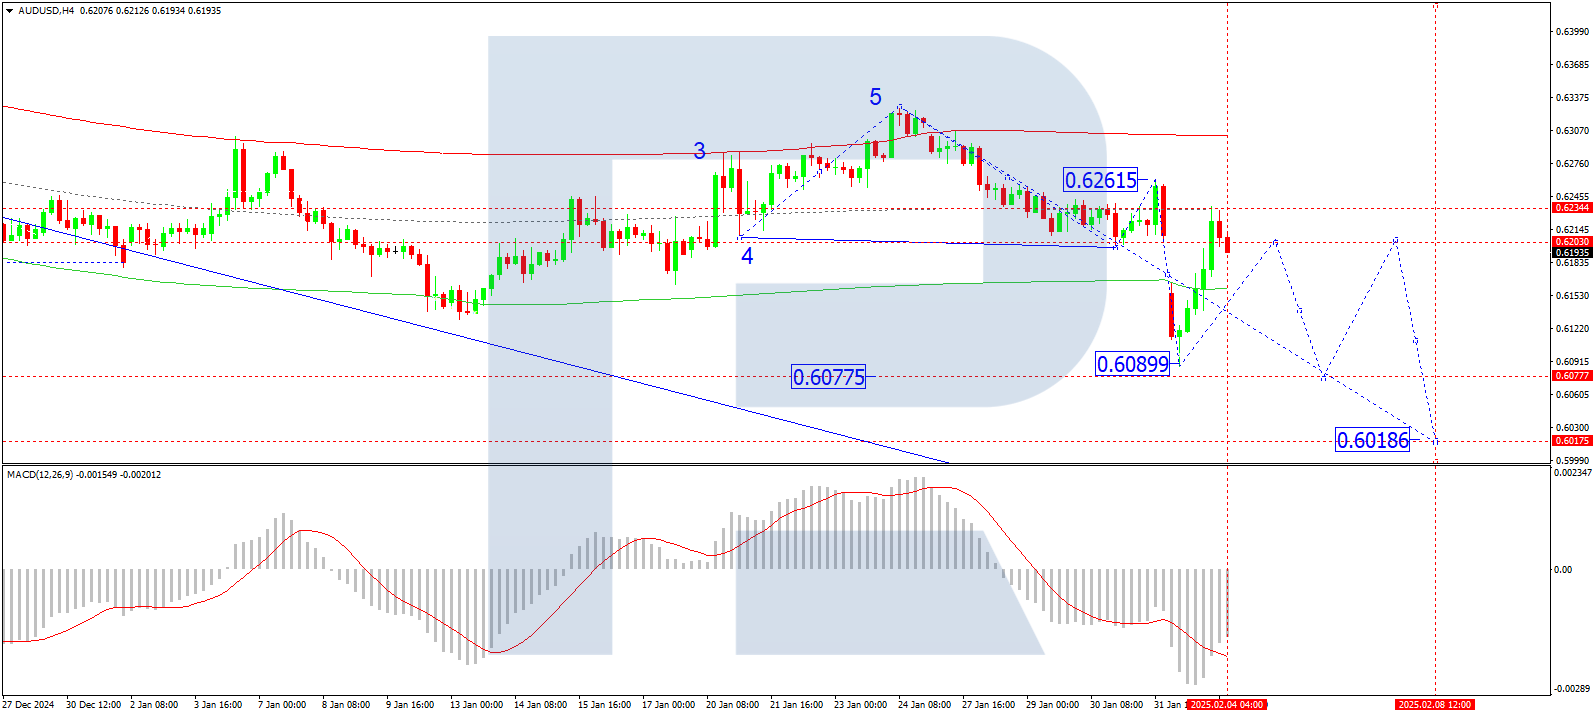
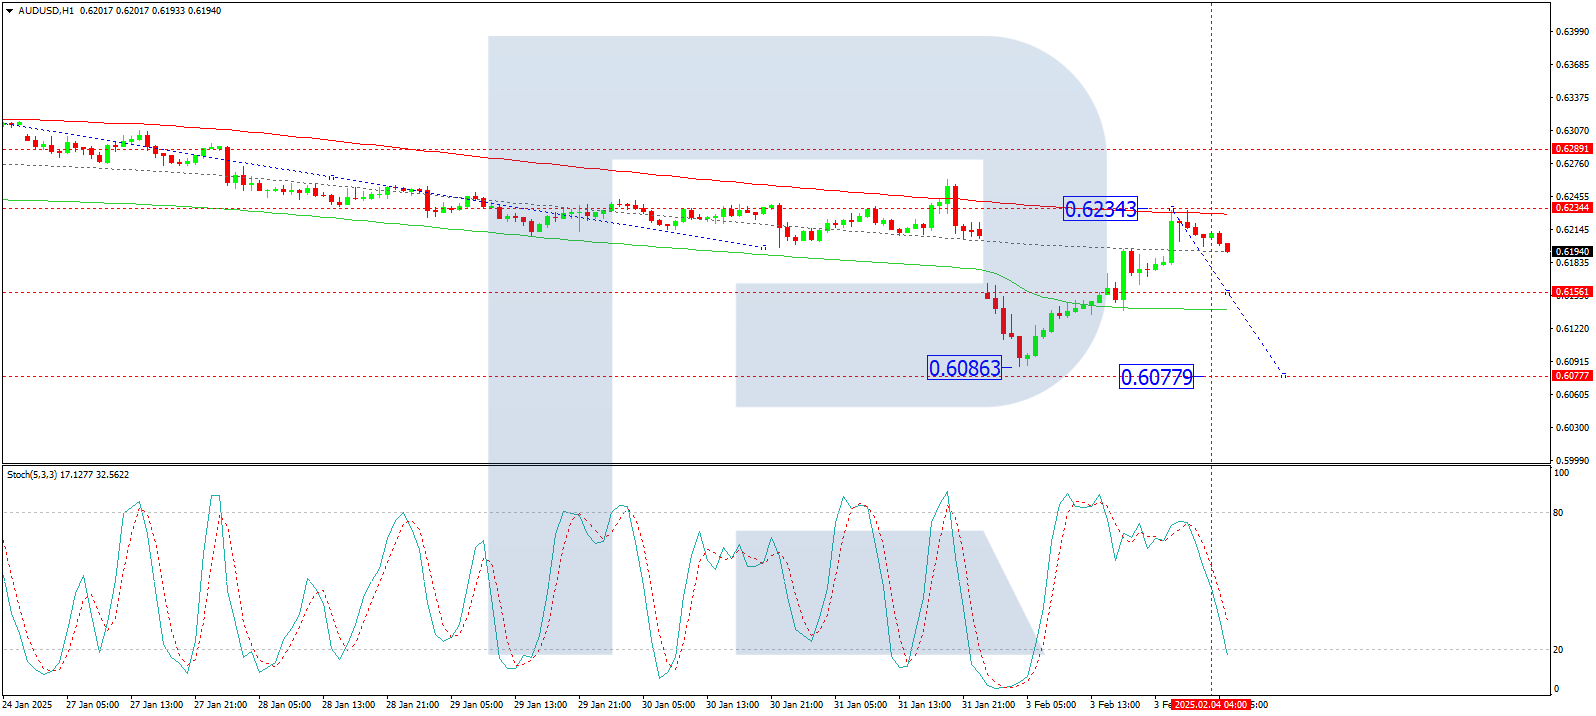
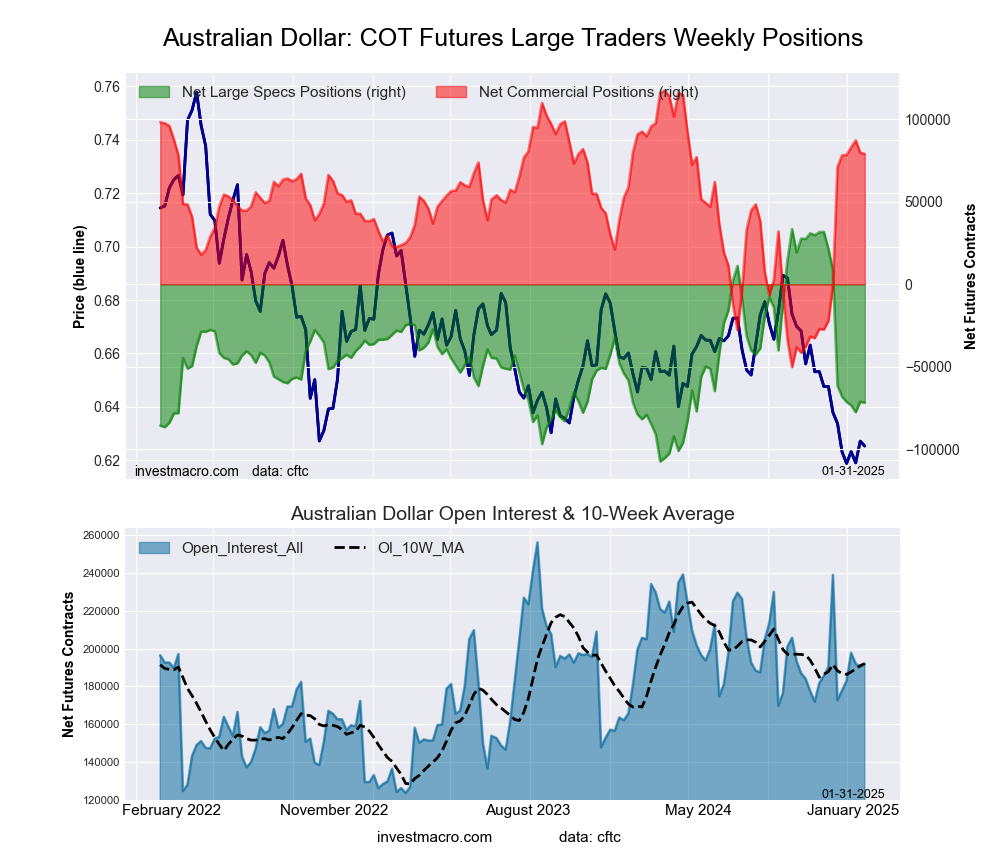 The Australian Dollar large speculator standing this week was a net position of -71,831 contracts in the data reported through Tuesday. This was a weekly decline of -535 contracts from the previous week which had a total of -71,296 net contracts.
This week’s current strength score (the trader positioning range over the past three years, measured from 0 to 100) shows the speculators are currently Bearish with a score of 25.3 percent. The commercials are Bullish with a score of 77.0 percent and the small traders (not shown in chart) are Bearish with a score of 30.2 percent.
Price Trend-Following Model: Downtrend
Our weekly trend-following model classifies the current market price position as: Downtrend.
| AUSTRALIAN DOLLAR Statistics | SPECULATORS | COMMERCIALS | SMALL TRADERS |
| – Percent of Open Interest Longs: | 16.8 | 67.5 | 12.4 |
| – Percent of Open Interest Shorts: | 54.2 | 26.3 | 16.2 |
| – Net Position: | -71,831 | 79,001 | -7,170 |
| – Gross Longs: | 32,196 | 129,574 | 23,866 |
| – Gross Shorts: | 104,027 | 50,573 | 31,036 |
| – Long to Short Ratio: | 0.3 to 1 | 2.6 to 1 | 0.8 to 1 |
| NET POSITION TREND: | | | |
| – Strength Index Score (3 Year Range Pct): | 25.3 | 77.0 | 30.2 |
| – Strength Index Reading (3 Year Range): | Bearish | Bullish | Bearish |
| NET POSITION MOVEMENT INDEX: | | | |
| – 6-Week Change in Strength Index: | -7.3 | 4.7 | 6.3 |
New Zealand Dollar Futures:
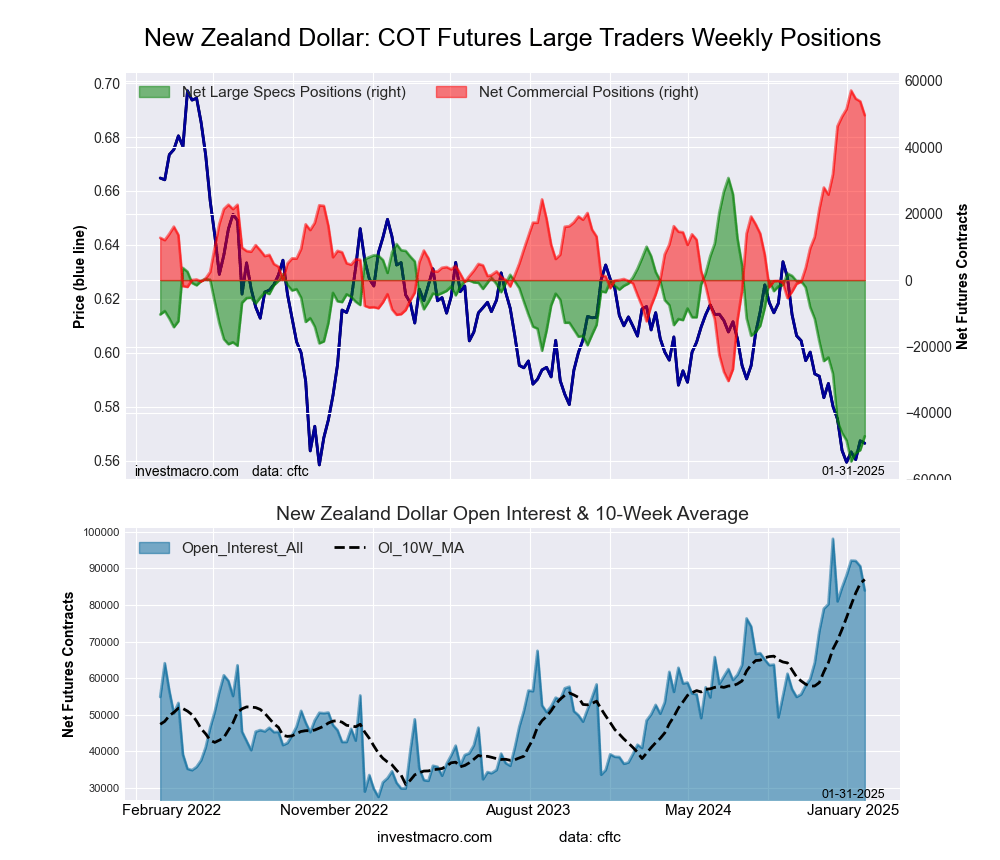 The New Zealand Dollar large speculator standing this week was a net position of -47,031 contracts in the data reported through Tuesday. This was a weekly lift of 4,192 contracts from the previous week which had a total of -51,223 net contracts.
This week’s current strength score (the trader positioning range over the past three years, measured from 0 to 100) shows the speculators are currently Bearish-Extreme with a score of 8.9 percent. The commercials are Bullish-Extreme with a score of 91.5 percent and the small traders (not shown in chart) are Bearish with a score of 20.1 percent.
Price Trend-Following Model: Downtrend
Our weekly trend-following model classifies the current market price position as: Downtrend.
| NEW ZEALAND DOLLAR Statistics | SPECULATORS | COMMERCIALS | SMALL TRADERS |
| – Percent of Open Interest Longs: | 9.4 | 86.3 | 3.8 |
| – Percent of Open Interest Shorts: | 65.4 | 27.2 | 6.9 |
| – Net Position: | -47,031 | 49,651 | -2,620 |
| – Gross Longs: | 7,898 | 72,468 | 3,201 |
| – Gross Shorts: | 54,929 | 22,817 | 5,821 |
| – Long to Short Ratio: | 0.1 to 1 | 3.2 to 1 | 0.5 to 1 |
| NET POSITION TREND: | | | |
| – Strength Index Score (3 Year Range Pct): | 8.9 | 91.5 | 20.1 |
| – Strength Index Reading (3 Year Range): | Bearish-Extreme | Bullish-Extreme | Bearish |
| NET POSITION MOVEMENT INDEX: | | | |
| – 6-Week Change in Strength Index: | -5.3 | 3.8 | 15.2 |
Mexican Peso Futures:
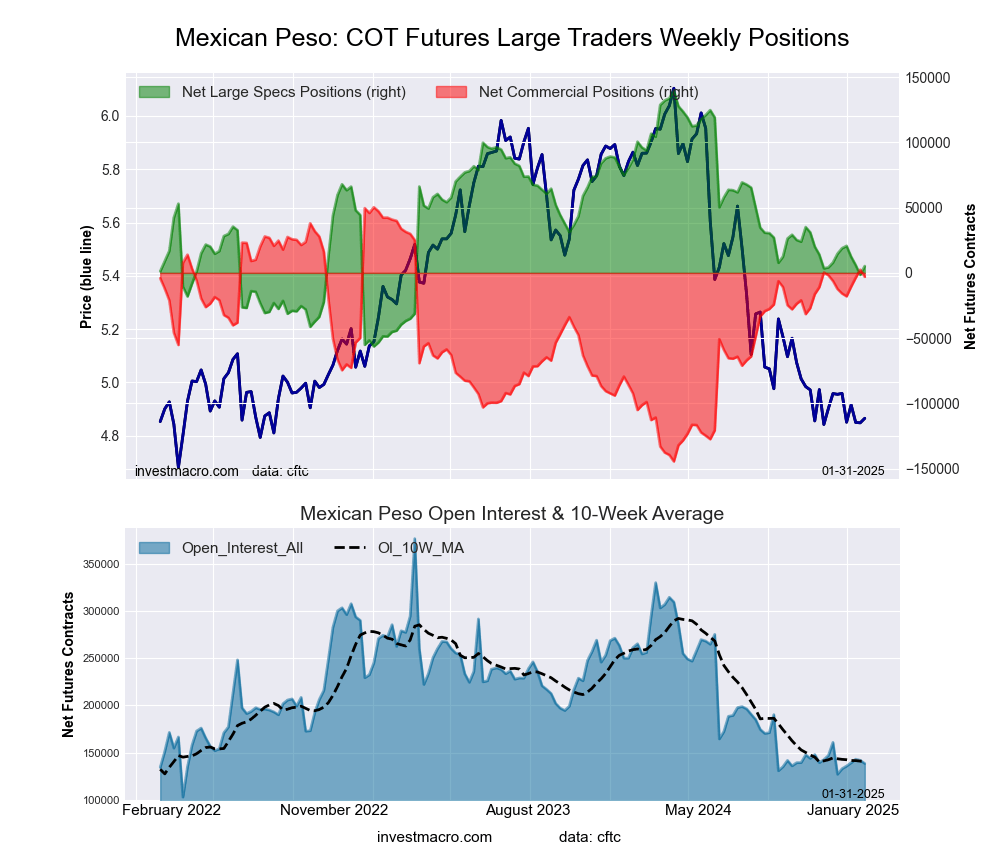 The Mexican Peso large speculator standing this week was a net position of 5,224 contracts in the data reported through Tuesday. This was a weekly boost of 6,768 contracts from the previous week which had a total of -1,544 net contracts.
This week’s current strength score (the trader positioning range over the past three years, measured from 0 to 100) shows the speculators are currently Bearish with a score of 31.4 percent. The commercials are Bullish with a score of 72.6 percent and the small traders (not shown in chart) are Bearish-Extreme with a score of 10.5 percent.
Price Trend-Following Model: Downtrend
Our weekly trend-following model classifies the current market price position as: Downtrend.
| MEXICAN PESO Statistics | SPECULATORS | COMMERCIALS | SMALL TRADERS |
| – Percent of Open Interest Longs: | 33.7 | 61.0 | 2.8 |
| – Percent of Open Interest Shorts: | 29.9 | 63.2 | 4.4 |
| – Net Position: | 5,224 | -3,023 | -2,201 |
| – Gross Longs: | 46,601 | 84,388 | 3,854 |
| – Gross Shorts: | 41,377 | 87,411 | 6,055 |
| – Long to Short Ratio: | 1.1 to 1 | 1.0 to 1 | 0.6 to 1 |
| NET POSITION TREND: | | | |
| – Strength Index Score (3 Year Range Pct): | 31.4 | 72.6 | 10.5 |
| – Strength Index Reading (3 Year Range): | Bearish | Bullish | Bearish-Extreme |
| NET POSITION MOVEMENT INDEX: | | | |
| – 6-Week Change in Strength Index: | -4.8 | 4.8 | 0.4 |
Brazilian Real Futures:
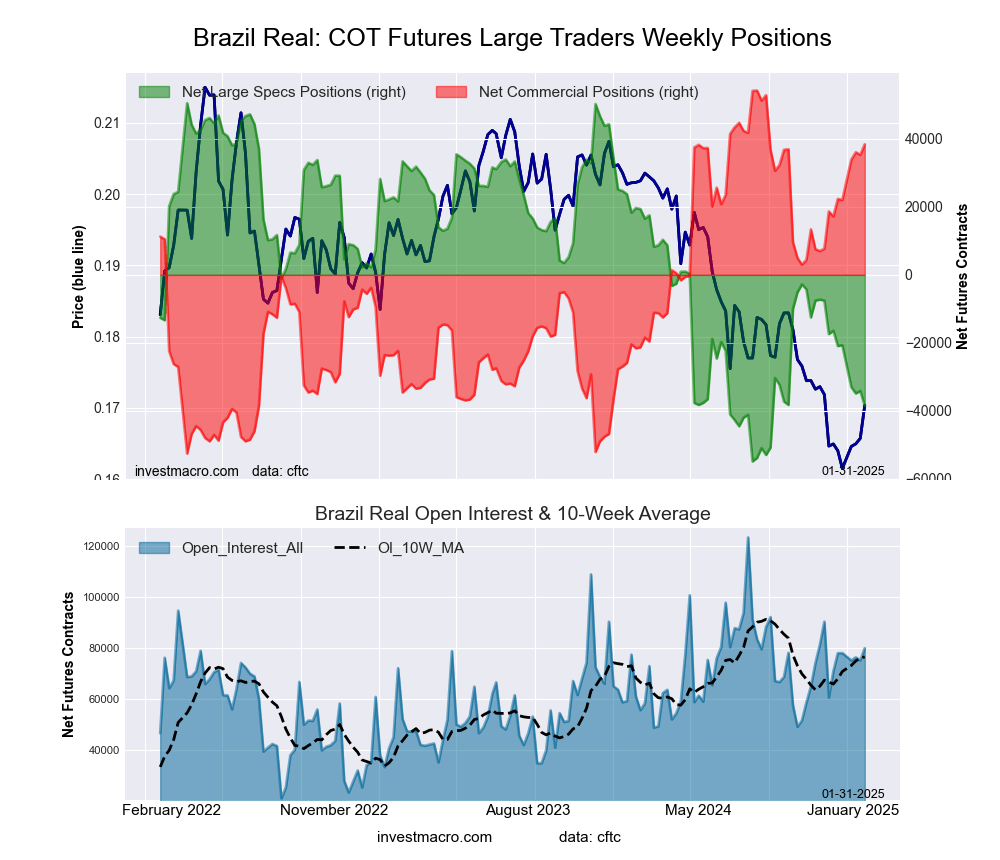 The Brazilian Real large speculator standing this week was a net position of -38,494 contracts in the data reported through Tuesday. This was a weekly decline of -4,363 contracts from the previous week which had a total of -34,131 net contracts.
This week’s current strength score (the trader positioning range over the past three years, measured from 0 to 100) shows the speculators are currently Bearish-Extreme with a score of 15.6 percent. The commercials are Bullish-Extreme with a score of 85.2 percent and the small traders (not shown in chart) are Bearish with a score of 21.3 percent.
Price Trend-Following Model: Weak Downtrend
Our weekly trend-following model classifies the current market price position as: Weak Downtrend.
| BRAZIL REAL Statistics | SPECULATORS | COMMERCIALS | SMALL TRADERS |
| – Percent of Open Interest Longs: | 24.2 | 71.3 | 3.2 |
| – Percent of Open Interest Shorts: | 72.4 | 23.2 | 3.1 |
| – Net Position: | -38,494 | 38,407 | 87 |
| – Gross Longs: | 19,372 | 56,952 | 2,529 |
| – Gross Shorts: | 57,866 | 18,545 | 2,442 |
| – Long to Short Ratio: | 0.3 to 1 | 3.1 to 1 | 1.0 to 1 |
| NET POSITION TREND: | | | |
| – Strength Index Score (3 Year Range Pct): | 15.6 | 85.2 | 21.3 |
| – Strength Index Reading (3 Year Range): | Bearish-Extreme | Bullish-Extreme | Bearish |
| NET POSITION MOVEMENT INDEX: | | | |
| – 6-Week Change in Strength Index: | -16.7 | 15.1 | 8.3 |
Bitcoin Futures:
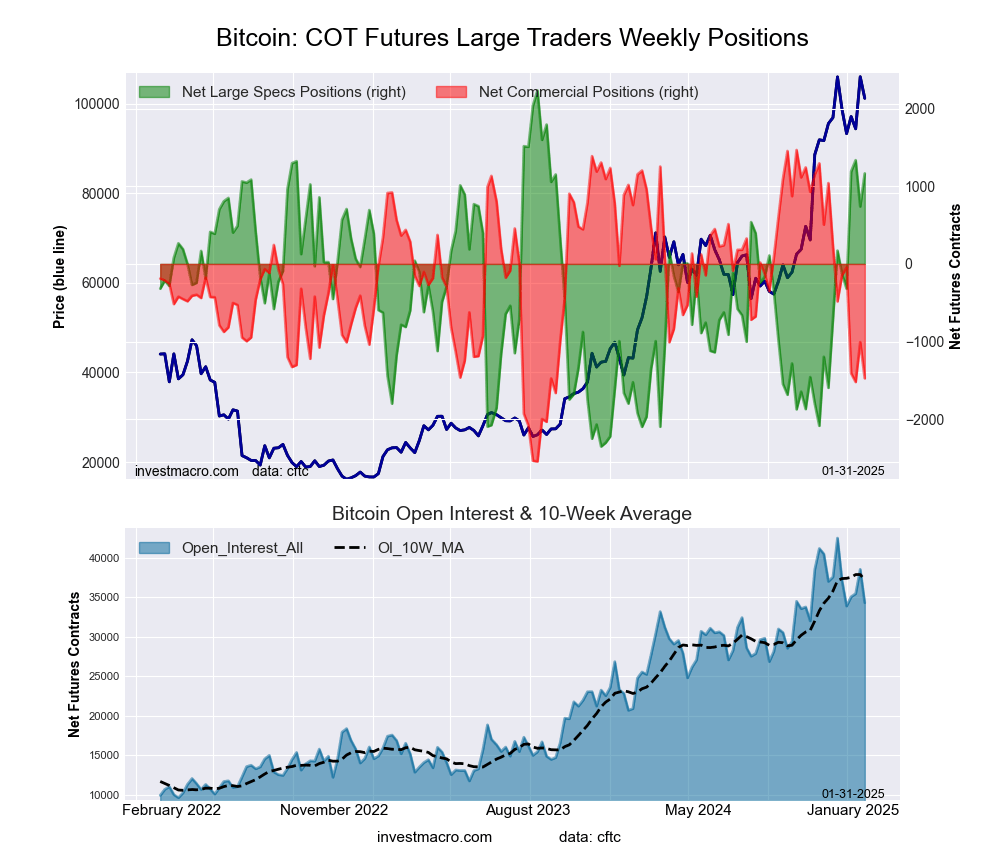 The Bitcoin large speculator standing this week was a net position of 1,165 contracts in the data reported through Tuesday. This was a weekly rise of 426 contracts from the previous week which had a total of 739 net contracts.
This week’s current strength score (the trader positioning range over the past three years, measured from 0 to 100) shows the speculators are currently Bullish with a score of 76.7 percent. The commercials are Bearish with a score of 26.7 percent and the small traders (not shown in chart) are Bearish with a score of 33.1 percent.
Price Trend-Following Model: Uptrend
Our weekly trend-following model classifies the current market price position as: Uptrend.
| BITCOIN Statistics | SPECULATORS | COMMERCIALS | SMALL TRADERS |
| – Percent of Open Interest Longs: | 83.3 | 4.3 | 4.8 |
| – Percent of Open Interest Shorts: | 79.9 | 8.6 | 3.9 |
| – Net Position: | 1,165 | -1,473 | 308 |
| – Gross Longs: | 28,593 | 1,482 | 1,661 |
| – Gross Shorts: | 27,428 | 2,955 | 1,353 |
| – Long to Short Ratio: | 1.0 to 1 | 0.5 to 1 | 1.2 to 1 |
| NET POSITION TREND: | | | |
| – Strength Index Score (3 Year Range Pct): | 76.7 | 26.7 | 33.1 |
| – Strength Index Reading (3 Year Range): | Bullish | Bearish | Bearish |
| NET POSITION MOVEMENT INDEX: | | | |
| – 6-Week Change in Strength Index: | 21.7 | -24.7 | -0.3 |
Article By InvestMacro – Receive our weekly COT Newsletter
*COT Report: The COT data, released weekly to the public each Friday, is updated through the most recent Tuesday (data is 3 days old) and shows a quick view of how large speculators or non-commercials (for-profit traders) were positioned in the futures markets.
The CFTC categorizes trader positions according to commercial hedgers (traders who use futures contracts for hedging as part of the business), non-commercials (large traders who speculate to realize trading profits) and nonreportable traders (usually small traders/speculators) as well as their open interest (contracts open in the market at time of reporting). See CFTC criteria here.