By InvestMacro
Here are the latest charts and statistics for the Commitment of Traders (COT) reports data published by the Commodities Futures Trading Commission (CFTC).
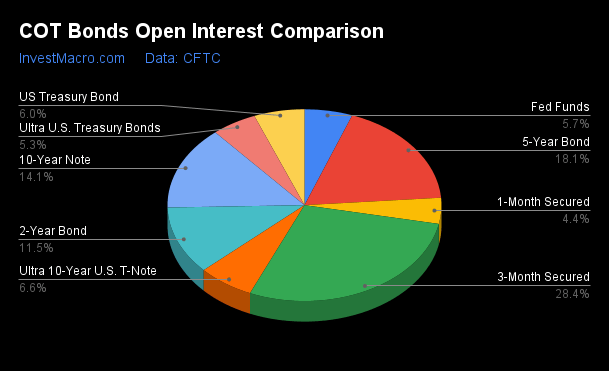
The latest COT data is updated through Tuesday February 25th and shows a quick view of how large traders (for-profit speculators and commercial hedgers) were positioned in the futures markets.
Weekly Speculator Changes led by 2-Year, Fed Funds & 5-Year Bonds
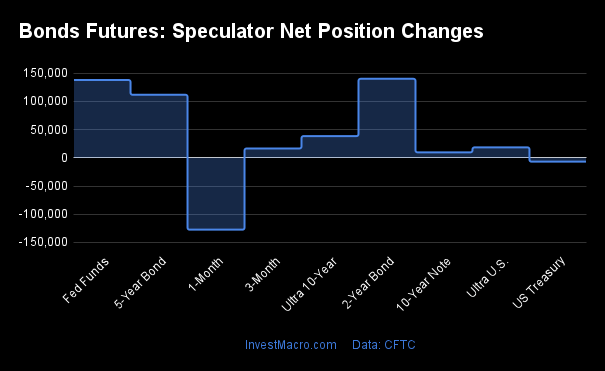
The COT bond market speculator bets were overall higher this week as seven out of the nine bond markets we cover had higher positioning while the other two markets had lower speculator contracts.
Leading the gains for the bond markets was the 2-Year Bonds (140,066 contracts), the Fed Funds (137,915 contracts), the 5-Year Bonds (111,760 contracts), the Ultra 10-Year Bonds (38,476 contracts), the SOFR 3-Months (16,557 contracts), the 10-Year Bonds (9,672 contracts) and the Ultra Treasury Bonds (3,675 contracts) also seeing positive weeks.
The bond market leading the declines in speculator bets for the week was the SOFR 1-Month (-127,401 contracts) and with the US Treasury Bonds (-6,869 contracts) also having lower bets on the week.
Bonds Net Speculators Leaderboard
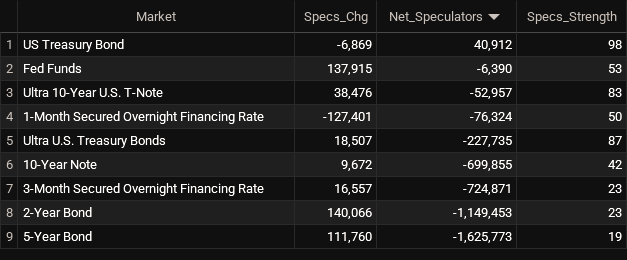
Legend: Weekly Speculators Change | Speculators Current Net Position | Speculators Strength Score compared to last 3-Years (0-100 range)
Strength Scores led by US Treasury Bonds
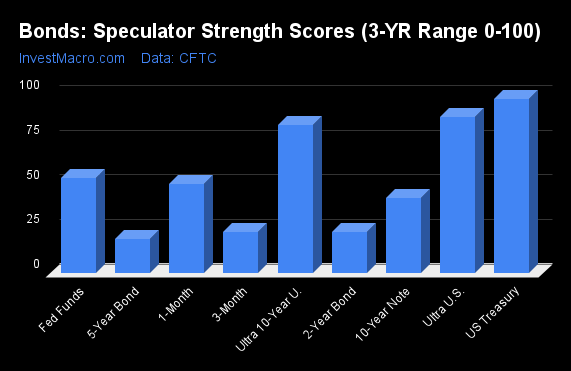
COT Strength Scores (a normalized measure of Speculator positions over a 3-Year range, from 0 to 100 where above 80 is Extreme-Bullish and below 20 is Extreme-Bearish) showed that the US Treasury Bonds (98 percent) leads the bond markets this week. The Ultra 10-Year Bonds (83 percent) and the Ultra Treasury Bonds (83 percent) come in as the next highest in the weekly strength scores.
On the downside, the 5-Year Bonds (19.0 percent) come in at the lowest strength level currently and are in Extreme-Bearish territory (below 20 percent). The next lowest strength scores were the SOFR 3-Months (23 percent) and the 2-Year Bonds (23 percent).
Strength Statistics:
Fed Funds (53.4 percent) vs Fed Funds previous week (28.0 percent)
2-Year Bond (23.0 percent) vs 2-Year Bond previous week (13.4 percent)
5-Year Bond (19.0 percent) vs 5-Year Bond previous week (13.1 percent)
10-Year Bond (42.0 percent) vs 10-Year Bond previous week (41.1 percent)
Ultra 10-Year Bond (83.0 percent) vs Ultra 10-Year Bond previous week (68.8 percent)
US Treasury Bond (97.6 percent) vs US Treasury Bond previous week (100.0 percent)
Ultra US Treasury Bond (82.7 percent) vs Ultra US Treasury Bond previous week (81.3 percent)
SOFR 1-Month (49.7 percent) vs SOFR 1-Month previous week (81.1 percent)
SOFR 3-Months (22.8 percent) vs SOFR 3-Months previous week (22.0 percent)
Fed Funds & Ultra 10-Year Bonds top the 6-Week Strength Trends
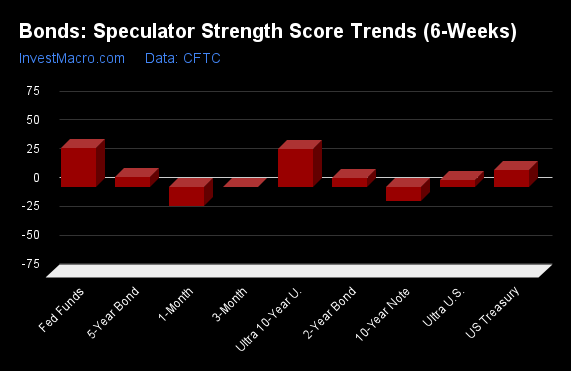
COT Strength Score Trends (or move index, calculates the 6-week changes in strength scores) showed that the Fed Funds (33 percent) and the Ultra 10-Year Bonds (32 percent) lead the past six weeks trends for bonds. The US Treasury Bonds (14 percent) and the 5-Year Bond (8 percent) are the next highest positive movers in the latest trends data.
The SOFR 1-Month (-17 percent) leads the downside trend scores currently with the 10-Year Bond (-12.5 percent) following next with lower trend scores.
Strength Trend Statistics:
Fed Funds (33.3 percent) vs Fed Funds previous week (4.2 percent)
2-Year Bond (7.4 percent) vs 2-Year Bond previous week (-6.6 percent)
5-Year Bond (8.1 percent) vs 5-Year Bond previous week (3.4 percent)
10-Year Bond (-12.5 percent) vs 10-Year Bond previous week (-3.5 percent)
Ultra 10-Year Bond (32.2 percent) vs Ultra 10-Year Bond previous week (15.5 percent)
US Treasury Bond (14.2 percent) vs US Treasury Bond previous week (22.5 percent)
Ultra US Treasury Bond (-0.5 percent) vs Ultra US Treasury Bond previous week (-15.0 percent)
SOFR 1-Month (-16.9 percent) vs SOFR 1-Month previous week (19.0 percent)
SOFR 3-Months (-0.2 percent) vs SOFR 3-Months previous week (-15.5 percent)
30-Day Federal Funds Futures:
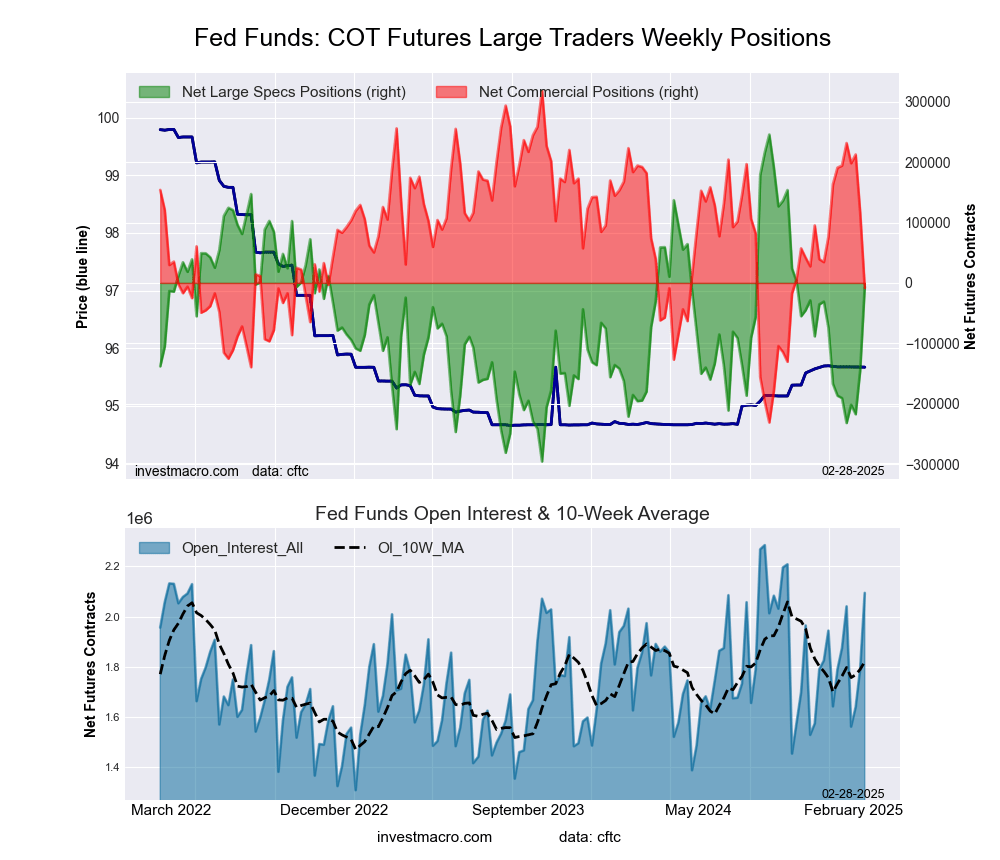 The 30-Day Federal Funds large speculator standing this week came in at a net position of -6,390 contracts in the data reported through Tuesday. This was a weekly advance of 137,915 contracts from the previous week which had a total of -144,305 net contracts.
This week’s current strength score (the trader positioning range over the past three years, measured from 0 to 100) shows the speculators are currently Bullish with a score of 53.4 percent. The commercials are Bearish with a score of 40.5 percent and the small traders (not shown in chart) are Bullish-Extreme with a score of 81.5 percent.
Price Trend-Following Model: Downtrend
Our weekly trend-following model classifies the current market price position as: Downtrend.
| 30-Day Federal Funds Statistics | SPECULATORS | COMMERCIALS | SMALL TRADERS |
| – Percent of Open Interest Longs: | 20.1 | 59.9 | 2.2 |
| – Percent of Open Interest Shorts: | 20.4 | 60.3 | 1.5 |
| – Net Position: | -6,390 | -8,353 | 14,743 |
| – Gross Longs: | 420,888 | 1,254,622 | 47,031 |
| – Gross Shorts: | 427,278 | 1,262,975 | 32,288 |
| – Long to Short Ratio: | 1.0 to 1 | 1.0 to 1 | 1.5 to 1 |
| NET POSITION TREND: | |||
| – Strength Index Score (3 Year Range Pct): | 53.4 | 40.5 | 81.5 |
| – Strength Index Reading (3 Year Range): | Bullish | Bearish | Bullish-Extreme |
| NET POSITION MOVEMENT INDEX: | |||
| – 6-Week Change in Strength Index: | 33.3 | -36.2 | 25.1 |
Secured Overnight Financing Rate (3-Month) Futures:
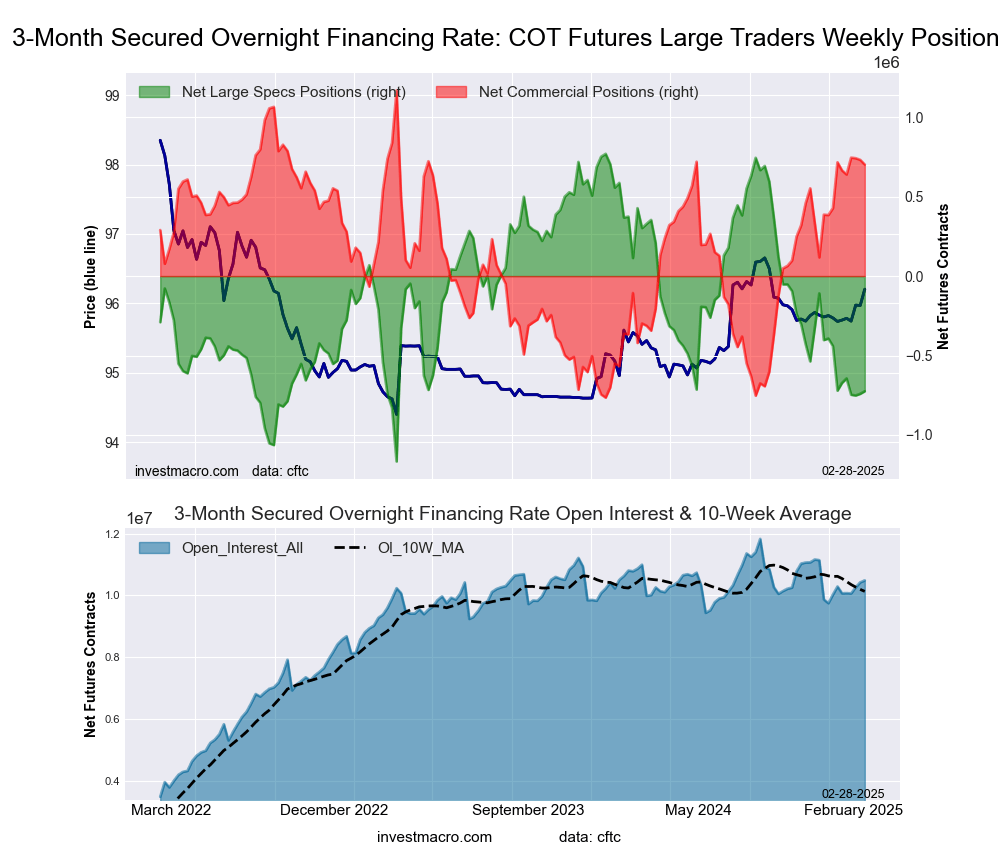 The Secured Overnight Financing Rate (3-Month) large speculator standing this week came in at a net position of -724,871 contracts in the data reported through Tuesday. This was a weekly advance of 16,557 contracts from the previous week which had a total of -741,428 net contracts.
This week’s current strength score (the trader positioning range over the past three years, measured from 0 to 100) shows the speculators are currently Bearish with a score of 22.8 percent. The commercials are Bullish with a score of 75.9 percent and the small traders (not shown in chart) are Bullish-Extreme with a score of 100.0 percent.
Price Trend-Following Model: Weak Uptrend
Our weekly trend-following model classifies the current market price position as: Weak Uptrend.
| SOFR 3-Months Statistics | SPECULATORS | COMMERCIALS | SMALL TRADERS |
| – Percent of Open Interest Longs: | 14.0 | 60.8 | 0.3 |
| – Percent of Open Interest Shorts: | 20.9 | 54.1 | 0.1 |
| – Net Position: | -724,871 | 701,660 | 23,211 |
| – Gross Longs: | 1,470,019 | 6,375,832 | 29,317 |
| – Gross Shorts: | 2,194,890 | 5,674,172 | 6,106 |
| – Long to Short Ratio: | 0.7 to 1 | 1.1 to 1 | 4.8 to 1 |
| NET POSITION TREND: | |||
| – Strength Index Score (3 Year Range Pct): | 22.8 | 75.9 | 100.0 |
| – Strength Index Reading (3 Year Range): | Bearish | Bullish | Bullish-Extreme |
| NET POSITION MOVEMENT INDEX: | |||
| – 6-Week Change in Strength Index: | -0.2 | -0.7 | 10.1 |
Individual Bond Markets:
Secured Overnight Financing Rate (1-Month) Futures:
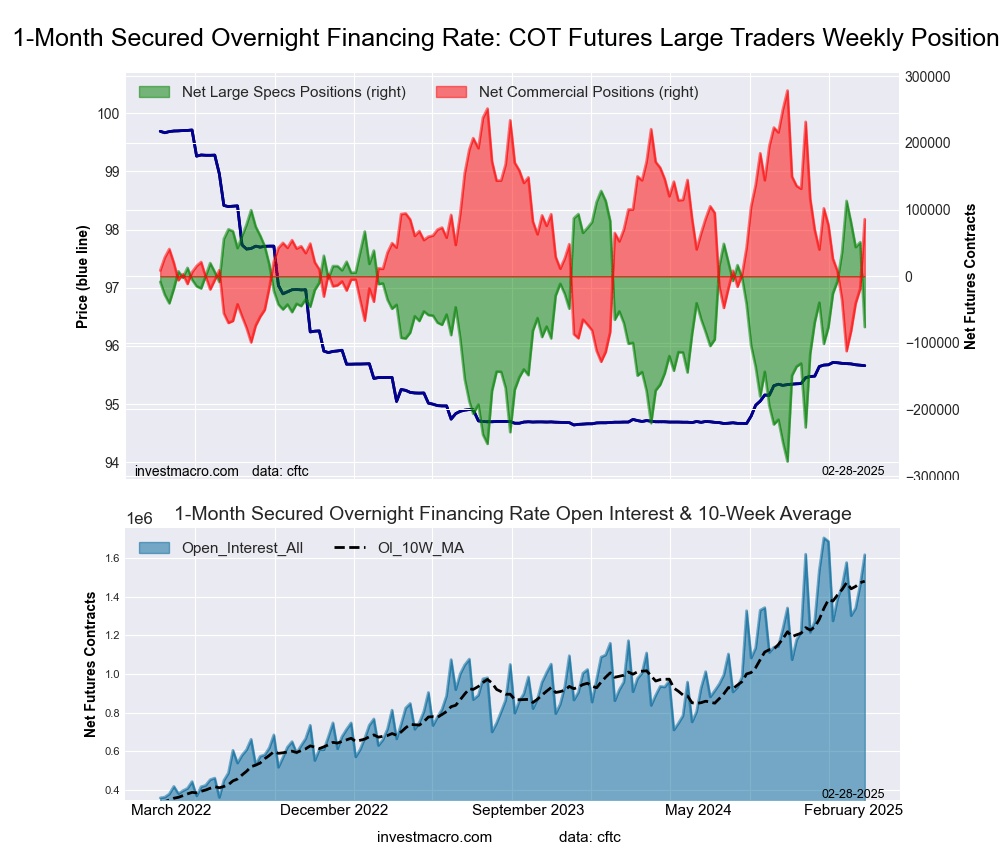 The Secured Overnight Financing Rate (1-Month) large speculator standing this week came in at a net position of -76,324 contracts in the data reported through Tuesday. This was a weekly reduction of -127,401 contracts from the previous week which had a total of 51,077 net contracts.
This week’s current strength score (the trader positioning range over the past three years, measured from 0 to 100) shows the speculators are currently Bearish with a score of 49.7 percent. The commercials are Bullish with a score of 52.6 percent and the small traders (not shown in chart) are Bullish with a score of 60.8 percent.
Price Trend-Following Model: Uptrend
Our weekly trend-following model classifies the current market price position as: Uptrend.
| SOFR 1-Month Statistics | SPECULATORS | COMMERCIALS | SMALL TRADERS |
| – Percent of Open Interest Longs: | 25.8 | 56.2 | 0.2 |
| – Percent of Open Interest Shorts: | 30.5 | 50.9 | 0.8 |
| – Net Position: | -76,324 | 85,618 | -9,294 |
| – Gross Longs: | 416,124 | 908,842 | 3,211 |
| – Gross Shorts: | 492,448 | 823,224 | 12,505 |
| – Long to Short Ratio: | 0.8 to 1 | 1.1 to 1 | 0.3 to 1 |
| NET POSITION TREND: | |||
| – Strength Index Score (3 Year Range Pct): | 49.7 | 52.6 | 60.8 |
| – Strength Index Reading (3 Year Range): | Bearish | Bullish | Bullish |
| NET POSITION MOVEMENT INDEX: | |||
| – 6-Week Change in Strength Index: | -16.9 | 19.1 | -24.0 |
2-Year Treasury Note Futures:
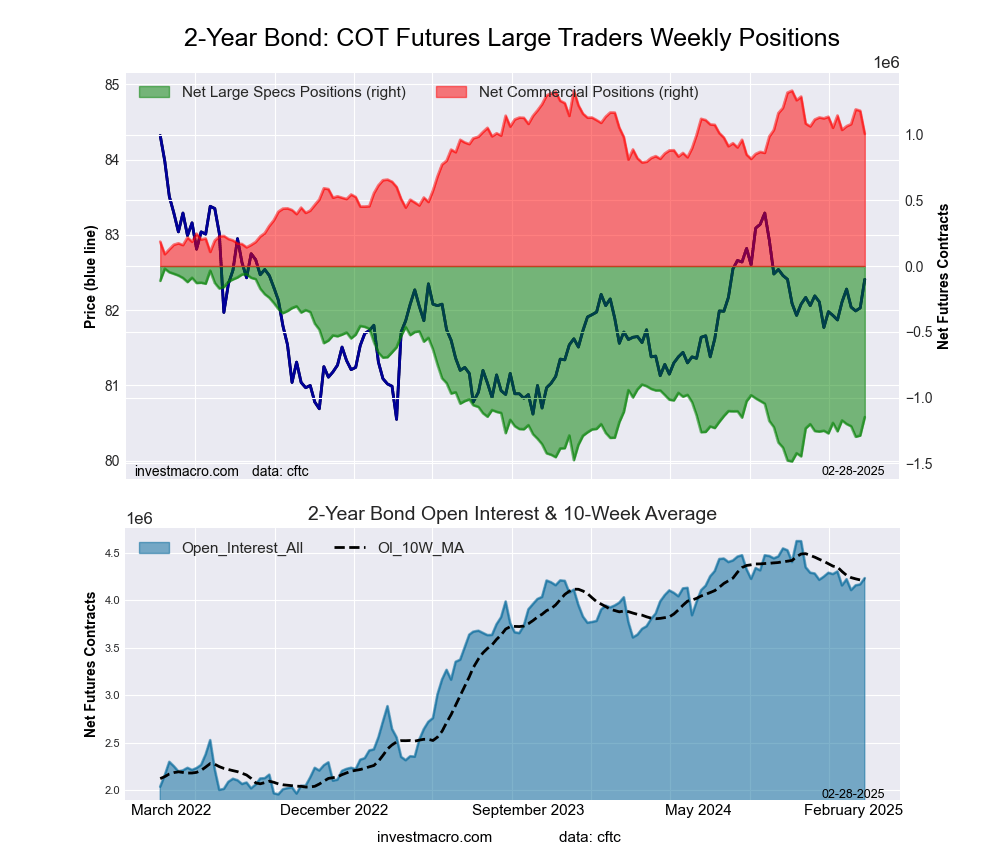 The 2-Year Treasury Note large speculator standing this week came in at a net position of -1,149,453 contracts in the data reported through Tuesday. This was a weekly lift of 140,066 contracts from the previous week which had a total of -1,289,519 net contracts.
This week’s current strength score (the trader positioning range over the past three years, measured from 0 to 100) shows the speculators are currently Bearish with a score of 23.0 percent. The commercials are Bullish with a score of 73.6 percent and the small traders (not shown in chart) are Bullish-Extreme with a score of 81.2 percent.
Price Trend-Following Model: Weak Downtrend
Our weekly trend-following model classifies the current market price position as: Weak Downtrend.
| 2-Year Treasury Note Statistics | SPECULATORS | COMMERCIALS | SMALL TRADERS |
| – Percent of Open Interest Longs: | 12.3 | 72.4 | 6.4 |
| – Percent of Open Interest Shorts: | 39.5 | 48.6 | 3.0 |
| – Net Position: | -1,149,453 | 1,006,450 | 143,003 |
| – Gross Longs: | 521,528 | 3,063,965 | 270,344 |
| – Gross Shorts: | 1,670,981 | 2,057,515 | 127,341 |
| – Long to Short Ratio: | 0.3 to 1 | 1.5 to 1 | 2.1 to 1 |
| NET POSITION TREND: | |||
| – Strength Index Score (3 Year Range Pct): | 23.0 | 73.6 | 81.2 |
| – Strength Index Reading (3 Year Range): | Bearish | Bullish | Bullish-Extreme |
| NET POSITION MOVEMENT INDEX: | |||
| – 6-Week Change in Strength Index: | 7.4 | -11.1 | 9.5 |
5-Year Treasury Note Futures:
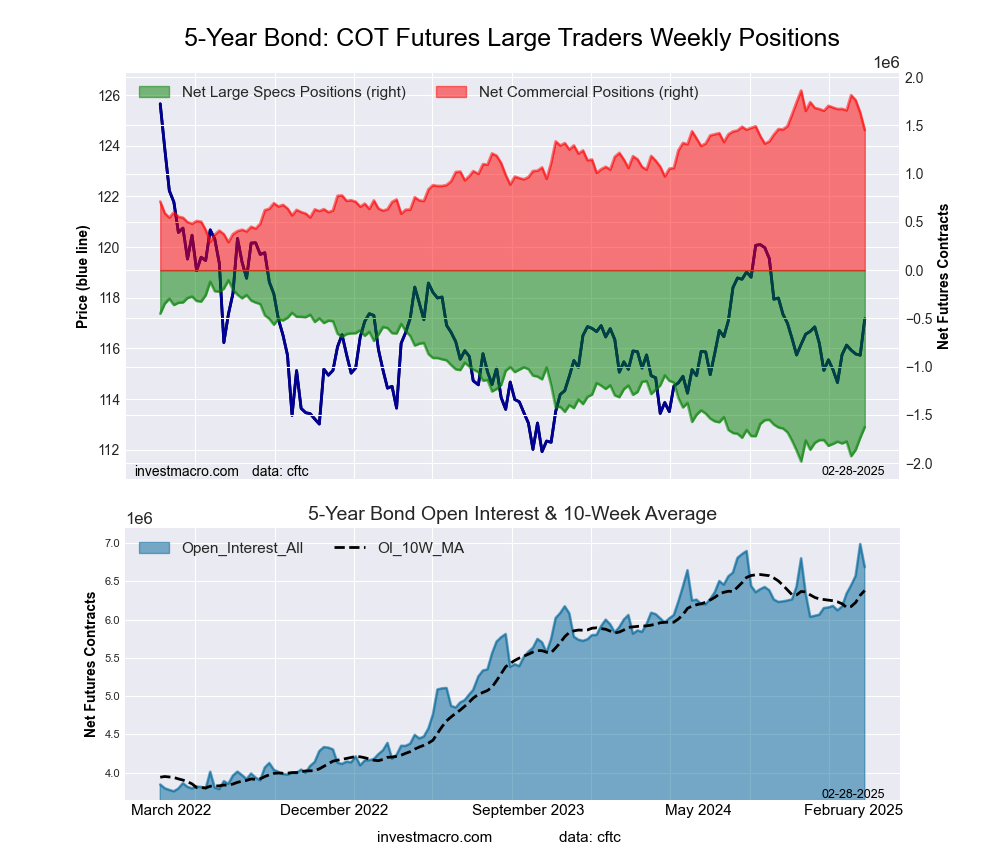 The 5-Year Treasury Note large speculator standing this week came in at a net position of -1,625,773 contracts in the data reported through Tuesday. This was a weekly advance of 111,760 contracts from the previous week which had a total of -1,737,533 net contracts.
This week’s current strength score (the trader positioning range over the past three years, measured from 0 to 100) shows the speculators are currently Bearish-Extreme with a score of 19.0 percent. The commercials are Bullish with a score of 74.0 percent and the small traders (not shown in chart) are Bullish-Extreme with a score of 84.8 percent.
Price Trend-Following Model: Weak Downtrend
Our weekly trend-following model classifies the current market price position as: Weak Downtrend.
| 5-Year Treasury Note Statistics | SPECULATORS | COMMERCIALS | SMALL TRADERS |
| – Percent of Open Interest Longs: | 5.5 | 79.5 | 7.1 |
| – Percent of Open Interest Shorts: | 29.9 | 57.8 | 4.5 |
| – Net Position: | -1,625,773 | 1,452,453 | 173,320 |
| – Gross Longs: | 370,975 | 5,315,137 | 474,030 |
| – Gross Shorts: | 1,996,748 | 3,862,684 | 300,710 |
| – Long to Short Ratio: | 0.2 to 1 | 1.4 to 1 | 1.6 to 1 |
| NET POSITION TREND: | |||
| – Strength Index Score (3 Year Range Pct): | 19.0 | 74.0 | 84.8 |
| – Strength Index Reading (3 Year Range): | Bearish-Extreme | Bullish | Bullish-Extreme |
| NET POSITION MOVEMENT INDEX: | |||
| – 6-Week Change in Strength Index: | 8.1 | -13.8 | 12.8 |
10-Year Treasury Note Futures:
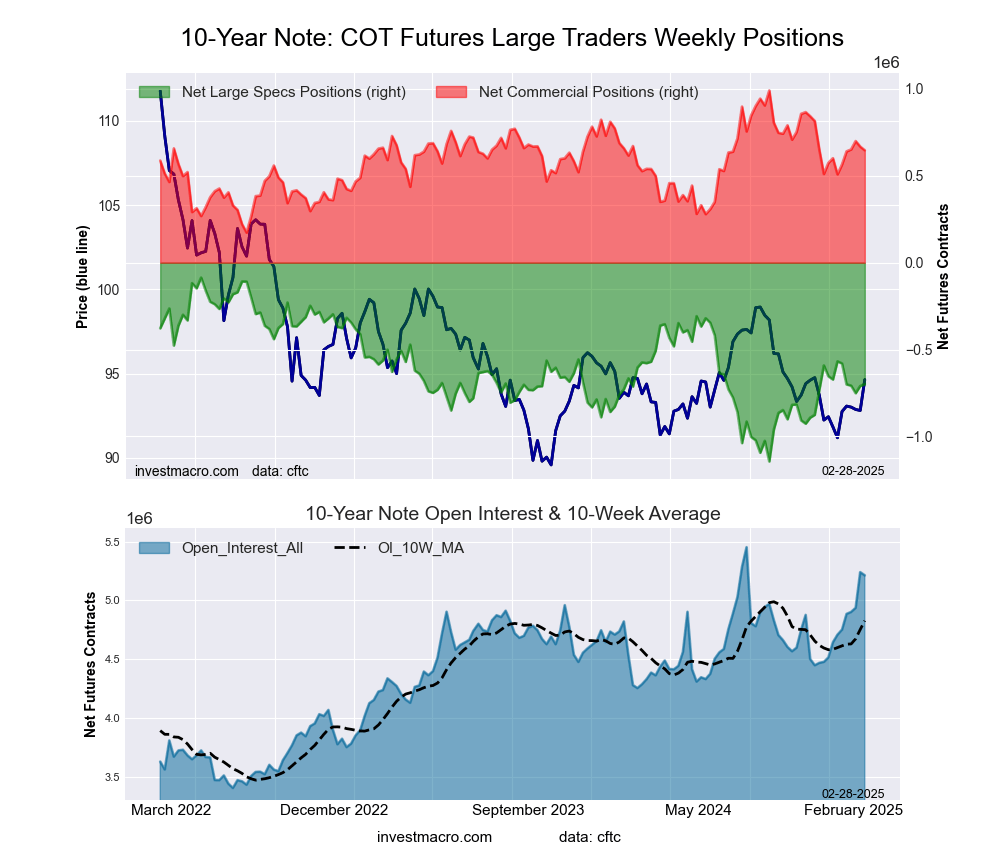 The 10-Year Treasury Note large speculator standing this week came in at a net position of -699,855 contracts in the data reported through Tuesday. This was a weekly rise of 9,672 contracts from the previous week which had a total of -709,527 net contracts.
This week’s current strength score (the trader positioning range over the past three years, measured from 0 to 100) shows the speculators are currently Bearish with a score of 42.0 percent. The commercials are Bullish with a score of 58.0 percent and the small traders (not shown in chart) are Bullish with a score of 71.2 percent.
Price Trend-Following Model: Weak Downtrend
Our weekly trend-following model classifies the current market price position as: Weak Downtrend.
| 10-Year Treasury Note Statistics | SPECULATORS | COMMERCIALS | SMALL TRADERS |
| – Percent of Open Interest Longs: | 13.0 | 72.5 | 8.2 |
| – Percent of Open Interest Shorts: | 26.4 | 60.1 | 7.2 |
| – Net Position: | -699,855 | 646,801 | 53,054 |
| – Gross Longs: | 677,868 | 3,780,605 | 429,465 |
| – Gross Shorts: | 1,377,723 | 3,133,804 | 376,411 |
| – Long to Short Ratio: | 0.5 to 1 | 1.2 to 1 | 1.1 to 1 |
| NET POSITION TREND: | |||
| – Strength Index Score (3 Year Range Pct): | 42.0 | 58.0 | 71.2 |
| – Strength Index Reading (3 Year Range): | Bearish | Bullish | Bullish |
| NET POSITION MOVEMENT INDEX: | |||
| – 6-Week Change in Strength Index: | -12.5 | 16.9 | -1.8 |
Ultra 10-Year Notes Futures:
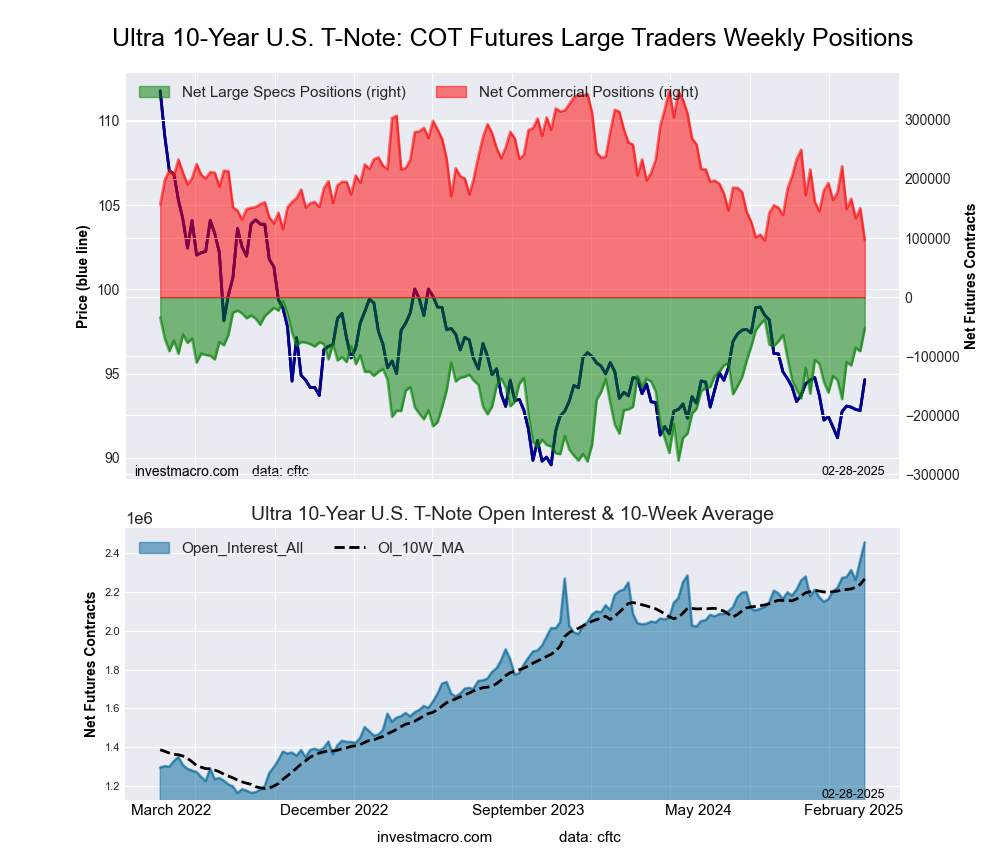 The Ultra 10-Year Notes large speculator standing this week came in at a net position of -52,957 contracts in the data reported through Tuesday. This was a weekly gain of 38,476 contracts from the previous week which had a total of -91,433 net contracts.
This week’s current strength score (the trader positioning range over the past three years, measured from 0 to 100) shows the speculators are currently Bullish-Extreme with a score of 83.0 percent. The commercials are Bearish-Extreme with a score of 0.1 percent and the small traders (not shown in chart) are Bullish-Extreme with a score of 82.7 percent.
Price Trend-Following Model: Weak Uptrend
Our weekly trend-following model classifies the current market price position as: Weak Uptrend.
| Ultra 10-Year Notes Statistics | SPECULATORS | COMMERCIALS | SMALL TRADERS |
| – Percent of Open Interest Longs: | 14.1 | 70.0 | 10.1 |
| – Percent of Open Interest Shorts: | 16.3 | 66.1 | 11.9 |
| – Net Position: | -52,957 | 96,118 | -43,161 |
| – Gross Longs: | 346,258 | 1,719,027 | 248,084 |
| – Gross Shorts: | 399,215 | 1,622,909 | 291,245 |
| – Long to Short Ratio: | 0.9 to 1 | 1.1 to 1 | 0.9 to 1 |
| NET POSITION TREND: | |||
| – Strength Index Score (3 Year Range Pct): | 83.0 | 0.1 | 82.7 |
| – Strength Index Reading (3 Year Range): | Bullish-Extreme | Bearish-Extreme | Bullish-Extreme |
| NET POSITION MOVEMENT INDEX: | |||
| – 6-Week Change in Strength Index: | 32.2 | -32.2 | -4.4 |
US Treasury Bonds Futures:
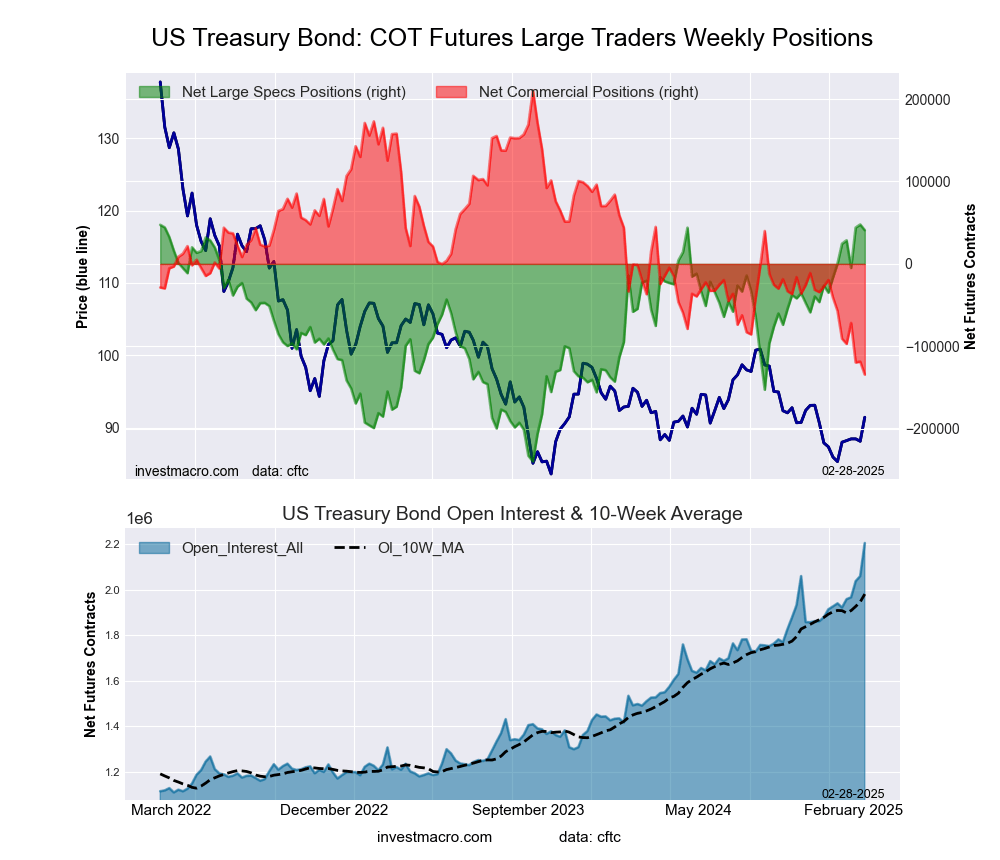 The US Treasury Bonds large speculator standing this week came in at a net position of 40,912 contracts in the data reported through Tuesday. This was a weekly lowering of -6,869 contracts from the previous week which had a total of 47,781 net contracts.
This week’s current strength score (the trader positioning range over the past three years, measured from 0 to 100) shows the speculators are currently Bullish-Extreme with a score of 97.6 percent. The commercials are Bearish-Extreme with a score of 0.0 percent and the small traders (not shown in chart) are Bullish-Extreme with a score of 82.7 percent.
Price Trend-Following Model: Weak Downtrend
Our weekly trend-following model classifies the current market price position as: Weak Downtrend.
| US Treasury Bonds Statistics | SPECULATORS | COMMERCIALS | SMALL TRADERS |
| – Percent of Open Interest Longs: | 18.9 | 62.3 | 10.6 |
| – Percent of Open Interest Shorts: | 17.0 | 68.4 | 6.3 |
| – Net Position: | 40,912 | -134,212 | 93,300 |
| – Gross Longs: | 415,998 | 1,373,857 | 233,255 |
| – Gross Shorts: | 375,086 | 1,508,069 | 139,955 |
| – Long to Short Ratio: | 1.1 to 1 | 0.9 to 1 | 1.7 to 1 |
| NET POSITION TREND: | |||
| – Strength Index Score (3 Year Range Pct): | 97.6 | 0.0 | 82.7 |
| – Strength Index Reading (3 Year Range): | Bullish-Extreme | Bearish-Extreme | Bullish-Extreme |
| NET POSITION MOVEMENT INDEX: | |||
| – 6-Week Change in Strength Index: | 14.2 | -22.5 | 25.1 |
Ultra US Treasury Bonds Futures:
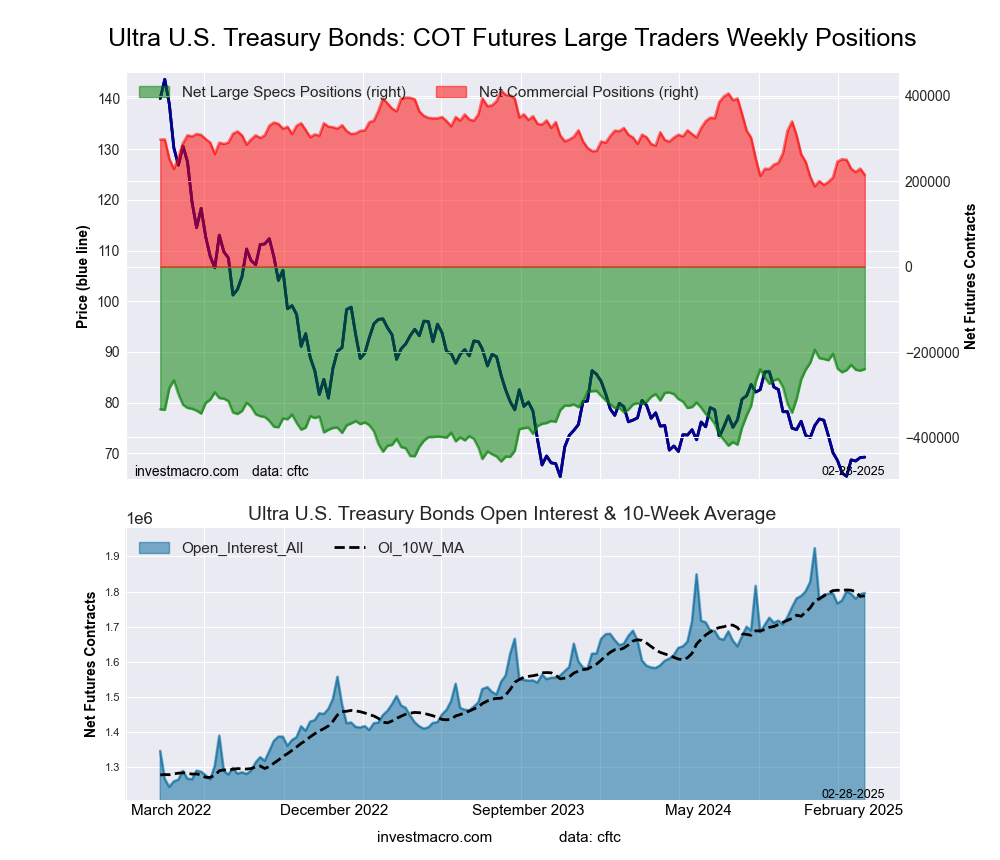 The Ultra US Treasury Bonds large speculator standing this week came in at a net position of -239,941 contracts in the data reported through Tuesday. This was a weekly boost of 3,675 contracts from the previous week which had a total of -243,616 net contracts.
This week’s current strength score (the trader positioning range over the past three years, measured from 0 to 100) shows the speculators are currently Bullish-Extreme with a score of 82.7 percent. The commercials are Bearish-Extreme with a score of 11.9 percent and the small traders (not shown in chart) are Bearish with a score of 44.3 percent.
Price Trend-Following Model: Downtrend
Our weekly trend-following model classifies the current market price position as: Downtrend.
| Ultra US Treasury Bonds Statistics | SPECULATORS | COMMERCIALS | SMALL TRADERS |
| – Percent of Open Interest Longs: | 8.5 | 80.8 | 10.0 |
| – Percent of Open Interest Shorts: | 21.8 | 68.8 | 8.6 |
| – Net Position: | -239,941 | 214,843 | 25,098 |
| – Gross Longs: | 152,029 | 1,450,800 | 179,900 |
| – Gross Shorts: | 391,970 | 1,235,957 | 154,802 |
| – Long to Short Ratio: | 0.4 to 1 | 1.2 to 1 | 1.2 to 1 |
| NET POSITION TREND: | |||
| – Strength Index Score (3 Year Range Pct): | 82.7 | 11.9 | 44.3 |
| – Strength Index Reading (3 Year Range): | Bullish-Extreme | Bearish-Extreme | Bearish |
| NET POSITION MOVEMENT INDEX: | |||
| – 6-Week Change in Strength Index: | -0.5 | -14.0 | 43.9 |
Article By InvestMacro – Receive our weekly COT Newsletter
*COT Report: The COT data, released weekly to the public each Friday, is updated through the most recent Tuesday (data is 3 days old) and shows a quick view of how large speculators or non-commercials (for-profit traders) were positioned in the futures markets.
The CFTC categorizes trader positions according to commercial hedgers (traders who use futures contracts for hedging as part of the business), non-commercials (large traders who speculate to realize trading profits) and nonreportable traders (usually small traders/speculators) as well as their open interest (contracts open in the market at time of reporting). See CFTC criteria here.