By InvestMacro

Here are the latest charts and statistics for the Commitment of Traders (COT) data published by the Commodities Futures Trading Commission (CFTC).
The latest COT data is updated through Tuesday February 25th and shows a quick view of how large market participants (for-profit speculators and commercial traders) were positioned in the futures markets. All currency positions are in direct relation to the US dollar where, for example, a bet for the euro is a bet that the euro will rise versus the dollar while a bet against the euro will be a bet that the euro will decline versus the dollar.
Weekly Speculator Changes led by Japanese Yen & Euro

The COT currency market speculator bets were decisively higher this week as eight out of the eleven currency markets we cover had higher positioning while the other three markets had lower speculator contracts.
Leading the gains for the currency markets was the Japanese Yen (35,411 contracts) with the EuroFX (25,995 contracts), the Mexican Peso (14,057 contracts), the Australian Dollar (11,143 contracts), the Canadian Dollar (6,737 contracts), the British Pound Sterling (5,042 contracts), the Brazilian Real (1,438 contracts) and Bitcoin (571 contracts) also recording positive weeks.
The currencies seeing declines in speculator bets on the week were the New Zealand Dollar (-1,546 contracts), the US Dollar Index (-1,036 contracts) and with the Swiss Franc (-1,101 contracts) also registering lower bets on the week.
Currency Speculators push Japanese Yen bets up to New Record High
Highlighting the COT currency’s data this week is the continued boost in bullish bets for the Japanese yen speculators.
Japanese yen speculator positions have continued their remarkable run of bullish bets since January and increased for a sixth consecutive weekly gain. This week’s rise in speculator bets was by over +35,000 contracts and marks the fifth time out of the past six weeks positions have gained by over +10,000 contracts.
Overall, the last six weeks have added a total of +125,391 contracts to the net positioning and has brought the total net position to a new all-time record high of +95,980 contracts. The previous record high was +71,870 contracts that took place in 2016 and the previous high (before 2016) was in March of 2008.

Japanese 10-Year Bond Yields
The yen exchange rate, despite the record high sentiment, has not exactly shared the same upside as of yet. The yen futures dipped this week by approximately -1 percent but had risen in five out of the previous six weeks. The yen exchange versus the US Dollar remains close to the lowest levels since the 1990’s at the 0.0066 futures price level and the USDJPY currency pair still holds above the major level of 150.00.
The Bank of Japan has raised its interest rate this year to the highest level in 17 years with some forecasts expecting the BOJ to increase it at least one more time. The Japanese 10-year bond yield has been rising strongly as well with the recent yield of 1.45 percent marking the highest level since 2009.
The strengthening speculator sentiment could signal a shift in the views toward the Japanese currency and which could take the currency’s fortunes some time to build upon. It could also possibly be a false start in which an unwinding of the speculator bets would once again put downward pressure on the JPY exchange rate into new multi-decade depths. Either way, this development bears watching.
Currencies Net Speculators Leaderboard

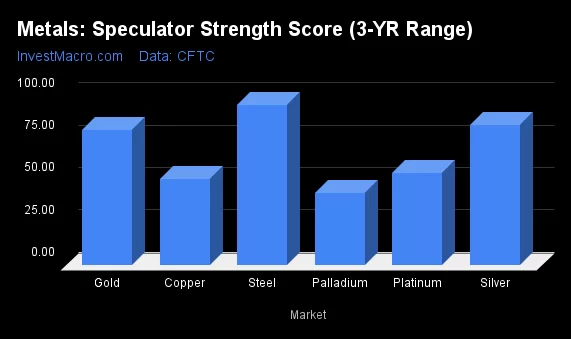
Legend: Weekly Speculators Change | Speculators Current Net Position | Speculators Strength Score compared to last 3-Years (0-100 range)
Strength Scores led by Japanese Yen

COT Strength Scores (a normalized measure of Speculator positions over a 3-Year range, from 0 to 100 where above 80 is Extreme-Bullish and below 20 is Extreme-Bearish) showed that the Japanese Yen (100 percent) leads the currency markets this week. Bitcoin (56 percent) and the Brazilian Real (54 percent) come in as the next highest in the weekly strength scores.
On the downside, the New Zealand Dollar (1 percent) and the EuroFX (19 percent) come in at the lowest strength levels currently and are in Extreme-Bearish territory (below 20 percent). The next lowest strength scores are the Swiss Franc (21 percent) and the Canadian Dollar (26 percent).
3-Year Strength Statistics:
US Dollar Index (39.3 percent) vs US Dollar Index previous week (41.4 percent)
EuroFX (19.1 percent) vs EuroFX previous week (9.2 percent)
British Pound Sterling (38.1 percent) vs British Pound Sterling previous week (35.9 percent)
Japanese Yen (100.0 percent) vs Japanese Yen previous week (87.4 percent)
Swiss Franc (20.9 percent) vs Swiss Franc previous week (23.2 percent)
Canadian Dollar (26.2 percent) vs Canadian Dollar previous week (23.1 percent)
Australian Dollar (44.0 percent) vs Australian Dollar previous week (36.0 percent)
New Zealand Dollar (1.1 percent) vs New Zealand Dollar previous week (2.9 percent)
Mexican Peso (43.4 percent) vs Mexican Peso previous week (36.2 percent)
Brazilian Real (54.3 percent) vs Brazilian Real previous week (53.0 percent)
Bitcoin (55.7 percent) vs Bitcoin previous week (43.3 percent)
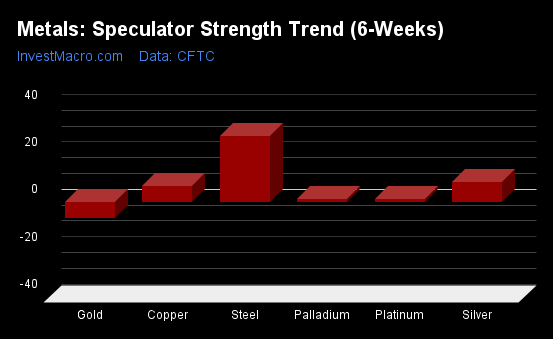
Japanese Yen & Brazilian Real top the 6-Week Strength Trends

COT Strength Score Trends (or move index, calculates the 6-week changes in strength scores) showed that the Japanese Yen (45 percent) and the Brazilian Real (35 percent) lead the past six weeks trends for the currencies. The Australian Dollar (23 percent), the EuroFX (13 percent) and the Canadian Dollar (13 percent) are the next highest positive movers in the 3-Year trends data.
Bitcoin (-25 percent) leads the downside trend scores currently with the New Zealand Dollar (-2 percent) and the Swiss Franc (-2 percent) following next with lower trend scores.
3-Year Strength Trends:
US Dollar Index (6.2 percent) vs US Dollar Index previous week (16.8 percent)
EuroFX (13.3 percent) vs EuroFX previous week (4.8 percent)
British Pound Sterling (1.8 percent) vs British Pound Sterling previous week (-6.8 percent)
Japanese Yen (44.8 percent) vs Japanese Yen previous week (28.8 percent)
Swiss Franc (-1.5 percent) vs Swiss Franc previous week (-1.0 percent)
Canadian Dollar (13.1 percent) vs Canadian Dollar previous week (15.2 percent)
Australian Dollar (22.7 percent) vs Australian Dollar previous week (11.9 percent)
New Zealand Dollar (-1.9 percent) vs New Zealand Dollar previous week (2.9 percent)
Mexican Peso (11.6 percent) vs Mexican Peso previous week (1.2 percent)
Brazilian Real (35.4 percent) vs Brazilian Real previous week (32.2 percent)
Bitcoin (-24.7 percent) vs Bitcoin previous week (-34.0 percent)
Individual COT Forex Markets:
US Dollar Index Futures:
 The US Dollar Index large speculator standing this week recorded a net position of 15,732 contracts in the data reported through Tuesday. This was a weekly decrease of -1,036 contracts from the previous week which had a total of 16,768 net contracts.
This week’s current strength score (the trader positioning range over the past three years, measured from 0 to 100) shows the speculators are currently Bearish with a score of 39.3 percent. The commercials are Bullish with a score of 62.8 percent and the small traders (not shown in chart) are Bearish with a score of 27.3 percent.
Price Trend-Following Model: Weak Uptrend
Our weekly trend-following model classifies the current market price position as: Weak Uptrend.
| US DOLLAR INDEX Statistics | SPECULATORS | COMMERCIALS | SMALL TRADERS |
| – Percent of Open Interest Longs: | 68.1 | 17.2 | 7.4 |
| – Percent of Open Interest Shorts: | 26.7 | 58.9 | 7.0 |
| – Net Position: | 15,732 | -15,861 | 129 |
| – Gross Longs: | 25,906 | 6,543 | 2,808 |
| – Gross Shorts: | 10,174 | 22,404 | 2,679 |
| – Long to Short Ratio: | 2.5 to 1 | 0.3 to 1 | 1.0 to 1 |
| NET POSITION TREND: | | | |
| – Strength Index Score (3 Year Range Pct): | 39.3 | 62.8 | 27.3 |
| – Strength Index Reading (3 Year Range): | Bearish | Bullish | Bearish |
| NET POSITION MOVEMENT INDEX: | | | |
| – 6-Week Change in Strength Index: | 6.2 | -3.1 | -16.6 |
Euro Currency Futures:
 The Euro Currency large speculator standing this week recorded a net position of -25,425 contracts in the data reported through Tuesday. This was a weekly rise of 25,995 contracts from the previous week which had a total of -51,420 net contracts.
This week’s current strength score (the trader positioning range over the past three years, measured from 0 to 100) shows the speculators are currently Bearish-Extreme with a score of 19.1 percent. The commercials are Bullish-Extreme with a score of 81.0 percent and the small traders (not shown in chart) are Bearish with a score of 31.1 percent.
Price Trend-Following Model: Weak Downtrend
Our weekly trend-following model classifies the current market price position as: Weak Downtrend.
| EURO Currency Statistics | SPECULATORS | COMMERCIALS | SMALL TRADERS |
| – Percent of Open Interest Longs: | 27.7 | 55.0 | 11.9 |
| – Percent of Open Interest Shorts: | 31.6 | 55.1 | 8.0 |
| – Net Position: | -25,425 | -640 | 26,065 |
| – Gross Longs: | 182,699 | 362,477 | 78,634 |
| – Gross Shorts: | 208,124 | 363,117 | 52,569 |
| – Long to Short Ratio: | 0.9 to 1 | 1.0 to 1 | 1.5 to 1 |
| NET POSITION TREND: | | | |
| – Strength Index Score (3 Year Range Pct): | 19.1 | 81.0 | 31.1 |
| – Strength Index Reading (3 Year Range): | Bearish-Extreme | Bullish-Extreme | Bearish |
| NET POSITION MOVEMENT INDEX: | | | |
| – 6-Week Change in Strength Index: | 13.3 | -16.7 | 31.1 |
British Pound Sterling Futures:
 The British Pound Sterling large speculator standing this week recorded a net position of 4,463 contracts in the data reported through Tuesday. This was a weekly increase of 5,042 contracts from the previous week which had a total of -579 net contracts.
This week’s current strength score (the trader positioning range over the past three years, measured from 0 to 100) shows the speculators are currently Bearish with a score of 38.1 percent. The commercials are Bullish with a score of 63.8 percent and the small traders (not shown in chart) are Bearish with a score of 39.8 percent.
Price Trend-Following Model: Weak Downtrend
Our weekly trend-following model classifies the current market price position as: Weak Downtrend.
| BRITISH POUND Statistics | SPECULATORS | COMMERCIALS | SMALL TRADERS |
| – Percent of Open Interest Longs: | 37.0 | 47.5 | 12.5 |
| – Percent of Open Interest Shorts: | 34.7 | 44.4 | 17.8 |
| – Net Position: | 4,463 | 6,186 | -10,649 |
| – Gross Longs: | 74,089 | 95,277 | 24,992 |
| – Gross Shorts: | 69,626 | 89,091 | 35,641 |
| – Long to Short Ratio: | 1.1 to 1 | 1.1 to 1 | 0.7 to 1 |
| NET POSITION TREND: | | | |
| – Strength Index Score (3 Year Range Pct): | 38.1 | 63.8 | 39.8 |
| – Strength Index Reading (3 Year Range): | Bearish | Bullish | Bearish |
| NET POSITION MOVEMENT INDEX: | | | |
| – 6-Week Change in Strength Index: | 1.8 | -3.5 | 10.0 |
Japanese Yen Futures:
 The Japanese Yen large speculator standing this week recorded a net position of 95,980 contracts in the data reported through Tuesday. This was a weekly rise of 35,411 contracts from the previous week which had a total of 60,569 net contracts.
This week’s current strength score (the trader positioning range over the past three years, measured from 0 to 100) shows the speculators are currently Bullish-Extreme with a score of 100.0 percent. The commercials are Bearish-Extreme with a score of 0.0 percent and the small traders (not shown in chart) are Bullish-Extreme with a score of 95.1 percent.
Price Trend-Following Model: Weak Downtrend
Our weekly trend-following model classifies the current market price position as: Weak Downtrend.
| JAPANESE YEN Statistics | SPECULATORS | COMMERCIALS | SMALL TRADERS |
| – Percent of Open Interest Longs: | 52.2 | 28.3 | 13.9 |
| – Percent of Open Interest Shorts: | 23.0 | 61.4 | 10.0 |
| – Net Position: | 95,980 | -108,945 | 12,965 |
| – Gross Longs: | 171,751 | 93,060 | 45,737 |
| – Gross Shorts: | 75,771 | 202,005 | 32,772 |
| – Long to Short Ratio: | 2.3 to 1 | 0.5 to 1 | 1.4 to 1 |
| NET POSITION TREND: | | | |
| – Strength Index Score (3 Year Range Pct): | 100.0 | 0.0 | 95.1 |
| – Strength Index Reading (3 Year Range): | Bullish-Extreme | Bearish-Extreme | Bullish-Extreme |
| NET POSITION MOVEMENT INDEX: | | | |
| – 6-Week Change in Strength Index: | 44.8 | -46.1 | 35.3 |
Swiss Franc Futures:
 The Swiss Franc large speculator standing this week recorded a net position of -39,460 contracts in the data reported through Tuesday. This was a weekly decline of -1,101 contracts from the previous week which had a total of -38,359 net contracts.
This week’s current strength score (the trader positioning range over the past three years, measured from 0 to 100) shows the speculators are currently Bearish with a score of 20.9 percent. The commercials are Bullish-Extreme with a score of 82.2 percent and the small traders (not shown in chart) are Bearish with a score of 30.8 percent.
Price Trend-Following Model: Downtrend
Our weekly trend-following model classifies the current market price position as: Downtrend.
| SWISS FRANC Statistics | SPECULATORS | COMMERCIALS | SMALL TRADERS |
| – Percent of Open Interest Longs: | 5.2 | 84.2 | 10.5 |
| – Percent of Open Interest Shorts: | 45.8 | 32.0 | 22.2 |
| – Net Position: | -39,460 | 50,769 | -11,309 |
| – Gross Longs: | 5,019 | 81,861 | 10,235 |
| – Gross Shorts: | 44,479 | 31,092 | 21,544 |
| – Long to Short Ratio: | 0.1 to 1 | 2.6 to 1 | 0.5 to 1 |
| NET POSITION TREND: | | | |
| – Strength Index Score (3 Year Range Pct): | 20.9 | 82.2 | 30.8 |
| – Strength Index Reading (3 Year Range): | Bearish | Bullish-Extreme | Bearish |
| NET POSITION MOVEMENT INDEX: | | | |
| – 6-Week Change in Strength Index: | -1.5 | -9.1 | 26.8 |
Canadian Dollar Futures:
 The Canadian Dollar large speculator standing this week recorded a net position of -137,906 contracts in the data reported through Tuesday. This was a weekly gain of 6,737 contracts from the previous week which had a total of -144,643 net contracts.
This week’s current strength score (the trader positioning range over the past three years, measured from 0 to 100) shows the speculators are currently Bearish with a score of 26.2 percent. The commercials are Bullish with a score of 74.9 percent and the small traders (not shown in chart) are Bearish with a score of 26.9 percent.
Price Trend-Following Model: Downtrend
Our weekly trend-following model classifies the current market price position as: Downtrend.
| CANADIAN DOLLAR Statistics | SPECULATORS | COMMERCIALS | SMALL TRADERS |
| – Percent of Open Interest Longs: | 6.4 | 81.7 | 8.7 |
| – Percent of Open Interest Shorts: | 49.6 | 37.0 | 10.2 |
| – Net Position: | -137,906 | 142,821 | -4,915 |
| – Gross Longs: | 20,523 | 261,075 | 27,768 |
| – Gross Shorts: | 158,429 | 118,254 | 32,683 |
| – Long to Short Ratio: | 0.1 to 1 | 2.2 to 1 | 0.8 to 1 |
| NET POSITION TREND: | | | |
| – Strength Index Score (3 Year Range Pct): | 26.2 | 74.9 | 26.9 |
| – Strength Index Reading (3 Year Range): | Bearish | Bullish | Bearish |
| NET POSITION MOVEMENT INDEX: | | | |
| – 6-Week Change in Strength Index: | 13.1 | -15.9 | 24.2 |
Australian Dollar Futures:
 The Australian Dollar large speculator standing this week recorded a net position of -45,580 contracts in the data reported through Tuesday. This was a weekly advance of 11,143 contracts from the previous week which had a total of -56,723 net contracts.
This week’s current strength score (the trader positioning range over the past three years, measured from 0 to 100) shows the speculators are currently Bearish with a score of 44.0 percent. The commercials are Bullish with a score of 61.1 percent and the small traders (not shown in chart) are Bearish with a score of 31.3 percent.
Price Trend-Following Model: Downtrend
Our weekly trend-following model classifies the current market price position as: Downtrend.
| AUSTRALIAN DOLLAR Statistics | SPECULATORS | COMMERCIALS | SMALL TRADERS |
| – Percent of Open Interest Longs: | 27.4 | 56.5 | 13.0 |
| – Percent of Open Interest Shorts: | 51.9 | 28.4 | 16.7 |
| – Net Position: | -45,580 | 52,332 | -6,752 |
| – Gross Longs: | 50,873 | 105,108 | 24,241 |
| – Gross Shorts: | 96,453 | 52,776 | 30,993 |
| – Long to Short Ratio: | 0.5 to 1 | 2.0 to 1 | 0.8 to 1 |
| NET POSITION TREND: | | | |
| – Strength Index Score (3 Year Range Pct): | 44.0 | 61.1 | 31.3 |
| – Strength Index Reading (3 Year Range): | Bearish | Bullish | Bearish |
| NET POSITION MOVEMENT INDEX: | | | |
| – 6-Week Change in Strength Index: | 22.7 | -20.8 | 7.7 |
New Zealand Dollar Futures:
 The New Zealand Dollar large speculator standing this week recorded a net position of -53,709 contracts in the data reported through Tuesday. This was a weekly lowering of -1,546 contracts from the previous week which had a total of -52,163 net contracts.
This week’s current strength score (the trader positioning range over the past three years, measured from 0 to 100) shows the speculators are currently Bearish-Extreme with a score of 1.1 percent. The commercials are Bullish-Extreme with a score of 97.7 percent and the small traders (not shown in chart) are Bearish with a score of 36.5 percent.
Price Trend-Following Model: Downtrend
Our weekly trend-following model classifies the current market price position as: Downtrend.
| NEW ZEALAND DOLLAR Statistics | SPECULATORS | COMMERCIALS | SMALL TRADERS |
| – Percent of Open Interest Longs: | 15.1 | 79.8 | 4.4 |
| – Percent of Open Interest Shorts: | 74.6 | 18.9 | 5.9 |
| – Net Position: | -53,709 | 55,044 | -1,335 |
| – Gross Longs: | 13,628 | 72,094 | 3,958 |
| – Gross Shorts: | 67,337 | 17,050 | 5,293 |
| – Long to Short Ratio: | 0.2 to 1 | 4.2 to 1 | 0.7 to 1 |
| NET POSITION TREND: | | | |
| – Strength Index Score (3 Year Range Pct): | 1.1 | 97.7 | 36.5 |
| – Strength Index Reading (3 Year Range): | Bearish-Extreme | Bullish-Extreme | Bearish |
| NET POSITION MOVEMENT INDEX: | | | |
| – 6-Week Change in Strength Index: | -1.9 | 0.5 | 15.5 |
Mexican Peso Futures:
 The Mexican Peso large speculator standing this week recorded a net position of 28,730 contracts in the data reported through Tuesday. This was a weekly boost of 14,057 contracts from the previous week which had a total of 14,673 net contracts.
This week’s current strength score (the trader positioning range over the past three years, measured from 0 to 100) shows the speculators are currently Bearish with a score of 43.4 percent. The commercials are Bullish with a score of 60.7 percent and the small traders (not shown in chart) are Bearish-Extreme with a score of 8.7 percent.
Price Trend-Following Model: Downtrend
Our weekly trend-following model classifies the current market price position as: Downtrend.
| MEXICAN PESO Statistics | SPECULATORS | COMMERCIALS | SMALL TRADERS |
| – Percent of Open Interest Longs: | 46.7 | 49.4 | 2.3 |
| – Percent of Open Interest Shorts: | 27.6 | 66.8 | 3.9 |
| – Net Position: | 28,730 | -26,207 | -2,523 |
| – Gross Longs: | 70,337 | 74,354 | 3,415 |
| – Gross Shorts: | 41,607 | 100,561 | 5,938 |
| – Long to Short Ratio: | 1.7 to 1 | 0.7 to 1 | 0.6 to 1 |
| NET POSITION TREND: | | | |
| – Strength Index Score (3 Year Range Pct): | 43.4 | 60.7 | 8.7 |
| – Strength Index Reading (3 Year Range): | Bearish | Bullish | Bearish-Extreme |
| NET POSITION MOVEMENT INDEX: | | | |
| – 6-Week Change in Strength Index: | 11.6 | -11.5 | -1.6 |
Brazilian Real Futures:
 The Brazilian Real large speculator standing this week recorded a net position of 2,378 contracts in the data reported through Tuesday. This was a weekly boost of 1,438 contracts from the previous week which had a total of 940 net contracts.
This week’s current strength score (the trader positioning range over the past three years, measured from 0 to 100) shows the speculators are currently Bullish with a score of 54.3 percent. The commercials are Bearish with a score of 45.5 percent and the small traders (not shown in chart) are Bearish with a score of 29.8 percent.
Price Trend-Following Model: Weak Downtrend
Our weekly trend-following model classifies the current market price position as: Weak Downtrend.
| BRAZIL REAL Statistics | SPECULATORS | COMMERCIALS | SMALL TRADERS |
| – Percent of Open Interest Longs: | 41.9 | 51.1 | 2.6 |
| – Percent of Open Interest Shorts: | 40.3 | 53.7 | 1.6 |
| – Net Position: | 2,378 | -3,962 | 1,584 |
| – Gross Longs: | 63,879 | 77,856 | 3,952 |
| – Gross Shorts: | 61,501 | 81,818 | 2,368 |
| – Long to Short Ratio: | 1.0 to 1 | 1.0 to 1 | 1.7 to 1 |
| NET POSITION TREND: | | | |
| – Strength Index Score (3 Year Range Pct): | 54.3 | 45.5 | 29.8 |
| – Strength Index Reading (3 Year Range): | Bullish | Bearish | Bearish |
| NET POSITION MOVEMENT INDEX: | | | |
| – 6-Week Change in Strength Index: | 35.4 | -37.5 | 15.7 |
Bitcoin Futures:
 The Bitcoin large speculator standing this week recorded a net position of 204 contracts in the data reported through Tuesday. This was a weekly advance of 571 contracts from the previous week which had a total of -367 net contracts.
This week’s current strength score (the trader positioning range over the past three years, measured from 0 to 100) shows the speculators are currently Bullish with a score of 55.7 percent. The commercials are Bullish with a score of 56.9 percent and the small traders (not shown in chart) are Bearish-Extreme with a score of 14.5 percent.
Price Trend-Following Model: Weak Uptrend
Our weekly trend-following model classifies the current market price position as: Weak Uptrend.
| BITCOIN Statistics | SPECULATORS | COMMERCIALS | SMALL TRADERS |
| – Percent of Open Interest Longs: | 80.3 | 4.6 | 4.6 |
| – Percent of Open Interest Shorts: | 79.6 | 5.5 | 4.4 |
| – Net Position: | 204 | -261 | 57 |
| – Gross Longs: | 25,737 | 1,489 | 1,480 |
| – Gross Shorts: | 25,533 | 1,750 | 1,423 |
| – Long to Short Ratio: | 1.0 to 1 | 0.9 to 1 | 1.0 to 1 |
| NET POSITION TREND: | | | |
| – Strength Index Score (3 Year Range Pct): | 55.7 | 56.9 | 14.5 |
| – Strength Index Reading (3 Year Range): | Bullish | Bullish | Bearish-Extreme |
| NET POSITION MOVEMENT INDEX: | | | |
| – 6-Week Change in Strength Index: | -24.7 | 31.4 | -9.5 |
Article By InvestMacro – Receive our weekly COT Newsletter
*COT Report: The COT data, released weekly to the public each Friday, is updated through the most recent Tuesday (data is 3 days old) and shows a quick view of how large speculators or non-commercials (for-profit traders) were positioned in the futures markets.
The CFTC categorizes trader positions according to commercial hedgers (traders who use futures contracts for hedging as part of the business), non-commercials (large traders who speculate to realize trading profits) and nonreportable traders (usually small traders/speculators) as well as their open interest (contracts open in the market at time of reporting). See CFTC criteria here.