By InvestMacro

Here are the latest charts and statistics for the Commitment of Traders (COT) data published by the Commodities Futures Trading Commission (CFTC).
The latest COT data is updated through Tuesday February 18th and shows a quick view of how large market participants (for-profit speculators and commercial traders) were positioned in the futures markets. All currency positions are in direct relation to the US dollar where, for example, a bet for the euro is a bet that the euro will rise versus the dollar while a bet against the euro will be a bet that the euro will decline versus the dollar.
Weekly Speculator Changes led by the Euro, Australian & Canadian Dollars

The COT currency market speculator bets were higher this week as seven out of the eleven currency markets we cover had higher positioning while three markets had lower speculator contracts and one market saw no change.
Leading the gains for the currency markets was the EuroFX (13,005 contracts) with the Australian Dollar (8,862 contracts), the Canadian Dollar (6,191 contracts), the Japanese Yen (5,954 contracts), the British Pound (2,589 contracts), the US Dollar Index (1,472 contracts) and the Swiss Franc (386 contracts) also showing positive weeks.
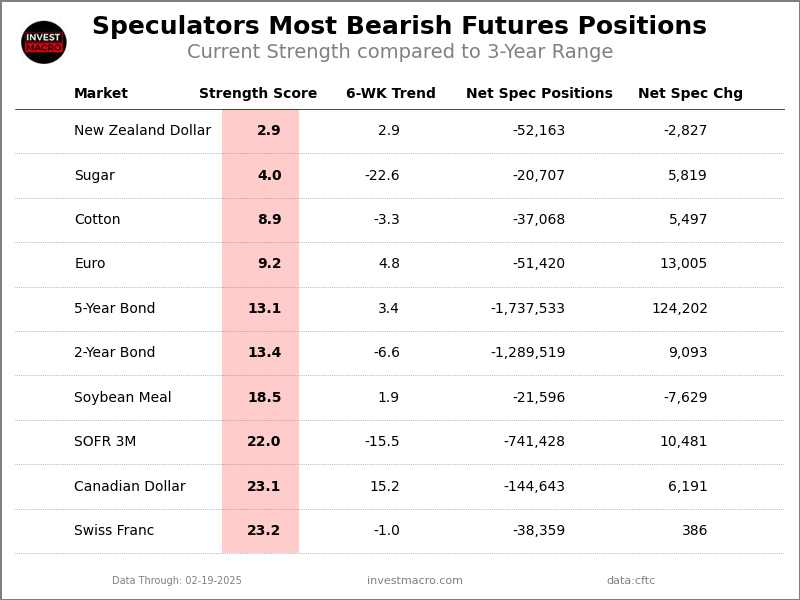
The currencies seeing declines in speculator bets on the week were the New Zealand Dollar (-2,827 contracts), the Mexican Peso (-1,177 contracts) and with the Brazilian Real (-140 contracts) also registering lower bets on the week.
In an extremely rare occurrence this week (that likely will be updated later), Bitcoin (0 contracts) saw no change in its futures contracts for the speculator positioning.
Large Currency Speculators push US Dollar Index & Japanese Yen bullish bets higher
Highlighting the COT data for the week was a rebound in some of the most bearish currency speculator positions (EUR, CAD & AUD) while the Japanese yen and the US Dollar Index speculators pushed their bets higher.
Here is a Quick Currency Roundup:
The US Dollar Index positioning rose once again this week and gained for the third week in a row. The USD Index bets has now risen in nine out of the past ten weeks and the current bullish position has grown to the highest level since September. Despite the positioning gains, the US Dollar Index futures price (DX) has actually dipped for the past three straight weeks. The DX closed the week at the 106.52 level and after the recent bullish momentum hit a roadblock around the 109.00-110.00 resistance level numerous times over the past month. Currently, the DX sits at support that used to be resistance in the recent past at 106.50.
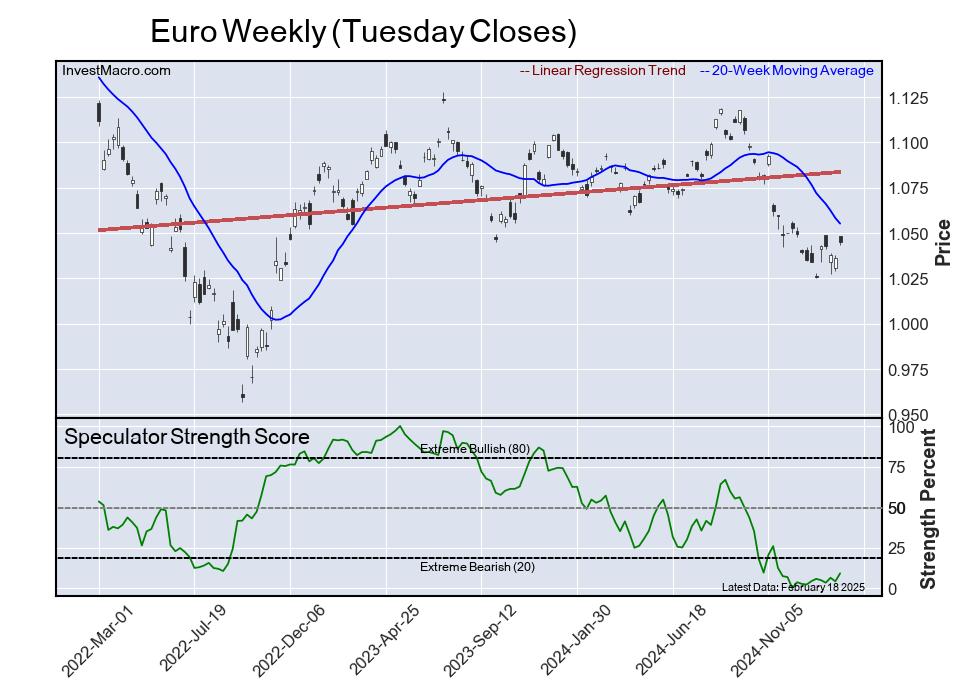
The Euro speculator bets jumped this week by over +13,000 contracts after falling in three out of the past four weeks. The current speculator level sits at -51,420 contracts which is in extreme bearish territory compared to the past three years of positioning. The Euro exchange rate versus the USD has been trading at the lowest levels since 2022 when the EURUSD exchange went below parity for the first time in decades. The EURUSD recently bounced off support levels at 1.0250 but remains in a downtrend that has seen the Euro fall approximately 9 percent vs the USD since September.
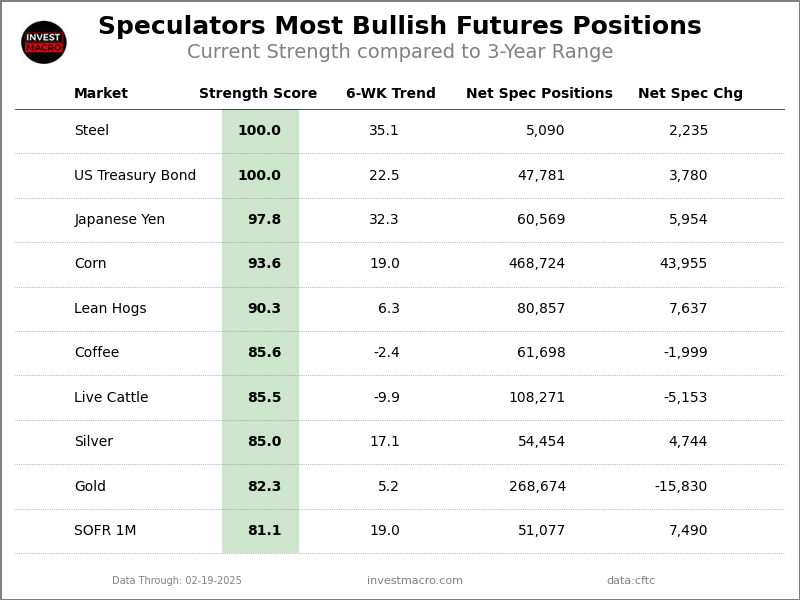
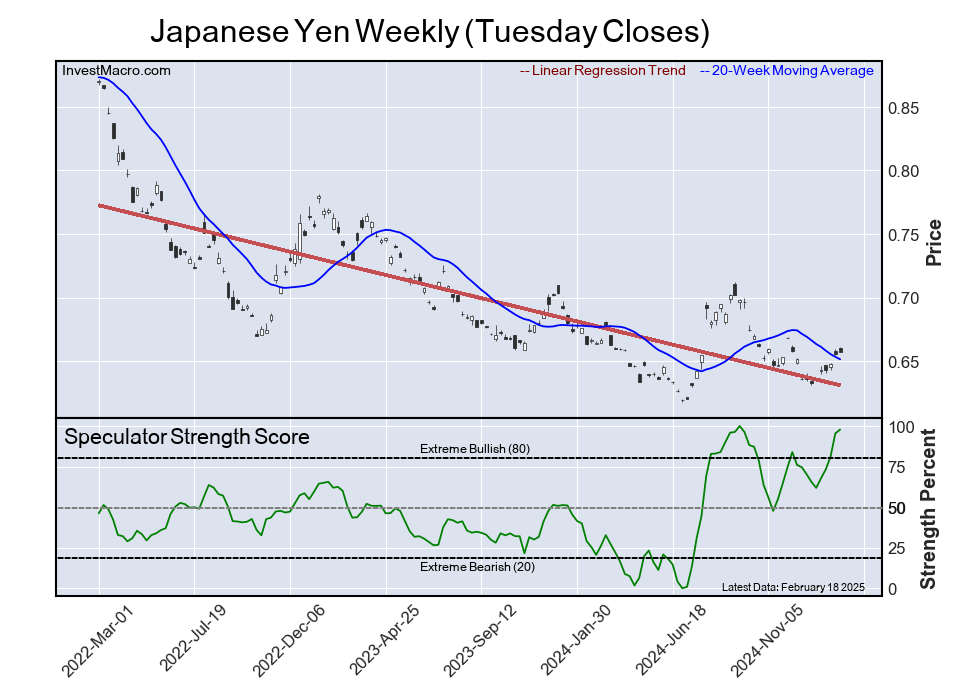
The Japanese yen speculator positioning gained once again this week for the fifth straight week. The current speculator level leads all the currencies in net bullish positions at +60,569 contracts and has jumped by +89,980 contracts in just the past five weeks (going from -14,673 contracts five weeks ago to this week over +60k contracts). The turnaround in sentiment has also been felt in the yen exchange rate versus the US Dollar which has risen in five out of the past six weeks. The USDJPY currency pair closed below 150.00 this week for the first time since October which is a gain for the yen by over 6 percent since the beginning of the year.
The Australian dollar speculators boosted their bets by over +8,000 contracts this week to bring the total spec standing to -56,723 contracts. The AUD speculator standing has had a sharply bearish end to 2024 and start to this year as the spec level has fallen by -88,499 contracts since the beginning of December. The AUD positions have declined in nine out of the past twelve weeks but have rebounded in each of the past two weeks. The Australian currency recently dipped to the 0.6098 exchange level vs the USD which marked the lowest exchange rate since 2020. The AUDUSD currency pair closed the week at the 0.6355 exchange rate which is off the recent lows but remains in a downtrend currently.
The Canadian dollar speculative position improved again this week and rose for a second straight week. The CAD positioning has been extremely bearish and above the -100,000 contract level for nineteen straight weeks and overall, the CAD position has been in bearish territory for eighty-one consecutive weeks. Despite this extreme bearishness, the speculator positions have actually been positive in seven out of the past nine weeks. The Canadian dollar exchange rate versus the US Dollar dipped modestly this week but had gained in the previous two weeks. The CAD futures price had recently fallen to the lowest level in over 20 years under the 0.6800 threshold but managed to bounce off long-term support around 0.6820-0.6875. This level has proved to be a strong turnaround level in both 2016 and 2020 and time will only tell if this turns out to be a similar case.
Currencies Net Speculators Leaderboard

Legend: Weekly Speculators Change | Speculators Current Net Position | Speculators Strength Score compared to last 3-Years (0-100 range)
Strength Scores led by Japanese Yen & Brazilian Real

COT Strength Scores (a normalized measure of Speculator positions over a 3-Year range, from 0 to 100 where above 80 is Extreme-Bullish and below 20 is Extreme-Bearish) showed that the Japanese Yen (98 percent) and the Brazilian Real (53 percent) lead the currency markets this week.
On the downside, the New Zealand Dollar (3 percent) and the EuroFX (9 percent) come in at the lowest strength levels currently and are in Extreme-Bearish territory (below 20 percent). The next lowest strength scores are the Canadian Dollar (23 percent) and the Swiss Franc (23 percent).
3-Year Strength Statistics:
US Dollar Index (41.4 percent) vs US Dollar Index previous week (38.4 percent)
EuroFX (9.2 percent) vs EuroFX previous week (4.2 percent)
British Pound Sterling (35.9 percent) vs British Pound Sterling previous week (34.7 percent)
Japanese Yen (97.8 percent) vs Japanese Yen previous week (95.4 percent)
Swiss Franc (23.2 percent) vs Swiss Franc previous week (22.4 percent)
Canadian Dollar (23.1 percent) vs Canadian Dollar previous week (20.4 percent)
Australian Dollar (36.0 percent) vs Australian Dollar previous week (29.8 percent)
New Zealand Dollar (2.9 percent) vs New Zealand Dollar previous week (6.2 percent)
Mexican Peso (36.2 percent) vs Mexican Peso previous week (36.8 percent)
Brazilian Real (53.0 percent) vs Brazilian Real previous week (53.1 percent)
Bitcoin (43.3 percent) vs Bitcoin previous week (43.3 percent)
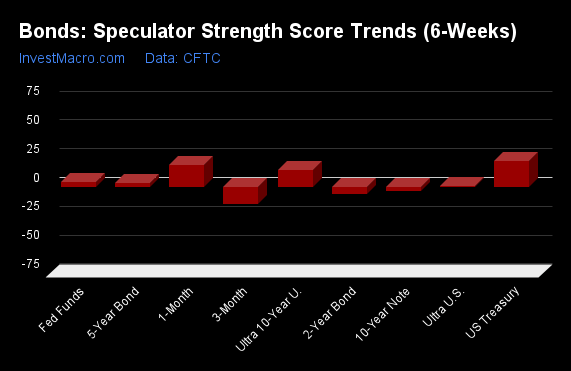
Japanese Yen & Brazilian Real top the 6-Week Strength Trends

COT Strength Score Trends (or move index, calculates the 6-week changes in strength scores) showed that the Japanese Yen (32 percent) and the Brazilian Real (32 percent) lead the past six weeks trends for the currencies. The US Dollar Index (17 percent), the Canadian Dollar (15 percent) and the Australian Dollar (12 percent) are the next highest positive movers in the 3-Year trends data.
Bitcoin (-34 percent) leads the downside trend scores currently with the British Pound (-7 percent) and the Swiss Franc (-1 percent) following next with lower trend scores.
3-Year Strength Trends:
US Dollar Index (16.8 percent) vs US Dollar Index previous week (17.5 percent)
EuroFX (4.8 percent) vs EuroFX previous week (2.0 percent)
British Pound Sterling (-6.8 percent) vs British Pound Sterling previous week (-10.8 percent)
Japanese Yen (32.3 percent) vs Japanese Yen previous week (25.2 percent)
Swiss Franc (-1.0 percent) vs Swiss Franc previous week (-12.0 percent)
Canadian Dollar (15.2 percent) vs Canadian Dollar previous week (11.1 percent)
Australian Dollar (11.9 percent) vs Australian Dollar previous week (4.1 percent)
New Zealand Dollar (2.9 percent) vs New Zealand Dollar previous week (-1.2 percent)
Mexican Peso (1.2 percent) vs Mexican Peso previous week (-2.5 percent)
Brazilian Real (32.2 percent) vs Brazilian Real previous week (25.3 percent)
Bitcoin (-34.0 percent) vs Bitcoin previous week (-1.0 percent)
Individual COT Forex Markets:
US Dollar Index Futures:
 The US Dollar Index large speculator standing this week reached a net position of 16,768 contracts in the data reported through Tuesday. This was a weekly gain of 1,472 contracts from the previous week which had a total of 15,296 net contracts.
This week’s current strength score (the trader positioning range over the past three years, measured from 0 to 100) shows the speculators are currently Bearish with a score of 41.4 percent. The commercials are Bullish with a score of 60.5 percent and the small traders (not shown in chart) are Bearish with a score of 29.2 percent.
Price Trend-Following Model: Weak Uptrend
Our weekly trend-following model classifies the current market price position as: Weak Uptrend.
| US DOLLAR INDEX Statistics | SPECULATORS | COMMERCIALS | SMALL TRADERS |
| – Percent of Open Interest Longs: | 69.5 | 18.9 | 8.2 |
| – Percent of Open Interest Shorts: | 25.9 | 63.3 | 7.5 |
| – Net Position: | 16,768 | -17,057 | 289 |
| – Gross Longs: | 26,729 | 7,275 | 3,161 |
| – Gross Shorts: | 9,961 | 24,332 | 2,872 |
| – Long to Short Ratio: | 2.7 to 1 | 0.3 to 1 | 1.1 to 1 |
| NET POSITION TREND: | | | |
| – Strength Index Score (3 Year Range Pct): | 41.4 | 60.5 | 29.2 |
| – Strength Index Reading (3 Year Range): | Bearish | Bullish | Bearish |
| NET POSITION MOVEMENT INDEX: | | | |
| – 6-Week Change in Strength Index: | 16.8 | -13.6 | -14.2 |
Euro Currency Futures:
 The Euro Currency large speculator standing this week reached a net position of -51,420 contracts in the data reported through Tuesday. This was a weekly increase of 13,005 contracts from the previous week which had a total of -64,425 net contracts.
This week’s current strength score (the trader positioning range over the past three years, measured from 0 to 100) shows the speculators are currently Bearish-Extreme with a score of 9.2 percent. The commercials are Bullish-Extreme with a score of 90.1 percent and the small traders (not shown in chart) are Bearish with a score of 29.3 percent.
Price Trend-Following Model: Downtrend
Our weekly trend-following model classifies the current market price position as: Downtrend.
| EURO Currency Statistics | SPECULATORS | COMMERCIALS | SMALL TRADERS |
| – Percent of Open Interest Longs: | 26.7 | 56.6 | 11.9 |
| – Percent of Open Interest Shorts: | 34.8 | 52.5 | 7.9 |
| – Net Position: | -51,420 | 26,195 | 25,225 |
| – Gross Longs: | 170,320 | 361,239 | 75,697 |
| – Gross Shorts: | 221,740 | 335,044 | 50,472 |
| – Long to Short Ratio: | 0.8 to 1 | 1.1 to 1 | 1.5 to 1 |
| NET POSITION TREND: | | | |
| – Strength Index Score (3 Year Range Pct): | 9.2 | 90.1 | 29.3 |
| – Strength Index Reading (3 Year Range): | Bearish-Extreme | Bullish-Extreme | Bearish |
| NET POSITION MOVEMENT INDEX: | | | |
| – 6-Week Change in Strength Index: | 4.8 | -6.4 | 13.6 |
British Pound Sterling Futures:
 The British Pound Sterling large speculator standing this week reached a net position of -579 contracts in the data reported through Tuesday. This was a weekly gain of 2,589 contracts from the previous week which had a total of -3,168 net contracts.
This week’s current strength score (the trader positioning range over the past three years, measured from 0 to 100) shows the speculators are currently Bearish with a score of 35.9 percent. The commercials are Bullish with a score of 65.7 percent and the small traders (not shown in chart) are Bearish with a score of 40.7 percent.
Price Trend-Following Model: Downtrend
Our weekly trend-following model classifies the current market price position as: Downtrend.
| BRITISH POUND Statistics | SPECULATORS | COMMERCIALS | SMALL TRADERS |
| – Percent of Open Interest Longs: | 36.2 | 49.2 | 11.9 |
| – Percent of Open Interest Shorts: | 36.5 | 43.9 | 16.9 |
| – Net Position: | -579 | 10,797 | -10,218 |
| – Gross Longs: | 73,564 | 100,001 | 24,129 |
| – Gross Shorts: | 74,143 | 89,204 | 34,347 |
| – Long to Short Ratio: | 1.0 to 1 | 1.1 to 1 | 0.7 to 1 |
| NET POSITION TREND: | | | |
| – Strength Index Score (3 Year Range Pct): | 35.9 | 65.7 | 40.7 |
| – Strength Index Reading (3 Year Range): | Bearish | Bullish | Bearish |
| NET POSITION MOVEMENT INDEX: | | | |
| – 6-Week Change in Strength Index: | -6.8 | 6.6 | -3.0 |
Japanese Yen Futures:
 The Japanese Yen large speculator standing this week reached a net position of 60,569 contracts in the data reported through Tuesday. This was a weekly rise of 5,954 contracts from the previous week which had a total of 54,615 net contracts.
This week’s current strength score (the trader positioning range over the past three years, measured from 0 to 100) shows the speculators are currently Bullish-Extreme with a score of 97.8 percent. The commercials are Bearish-Extreme with a score of 2.7 percent and the small traders (not shown in chart) are Bullish-Extreme with a score of 87.0 percent.
Price Trend-Following Model: Weak Downtrend
Our weekly trend-following model classifies the current market price position as: Weak Downtrend.
| JAPANESE YEN Statistics | SPECULATORS | COMMERCIALS | SMALL TRADERS |
| – Percent of Open Interest Longs: | 52.5 | 29.9 | 15.6 |
| – Percent of Open Interest Shorts: | 30.9 | 54.8 | 12.2 |
| – Net Position: | 60,569 | -70,193 | 9,624 |
| – Gross Longs: | 147,566 | 84,001 | 43,985 |
| – Gross Shorts: | 86,997 | 154,194 | 34,361 |
| – Long to Short Ratio: | 1.7 to 1 | 0.5 to 1 | 1.3 to 1 |
| NET POSITION TREND: | | | |
| – Strength Index Score (3 Year Range Pct): | 97.8 | 2.7 | 87.0 |
| – Strength Index Reading (3 Year Range): | Bullish-Extreme | Bearish-Extreme | Bullish-Extreme |
| NET POSITION MOVEMENT INDEX: | | | |
| – 6-Week Change in Strength Index: | 32.3 | -33.3 | 23.5 |
Swiss Franc Futures:
 The Swiss Franc large speculator standing this week reached a net position of -38,359 contracts in the data reported through Tuesday. This was a weekly rise of 386 contracts from the previous week which had a total of -38,745 net contracts.
This week’s current strength score (the trader positioning range over the past three years, measured from 0 to 100) shows the speculators are currently Bearish with a score of 23.2 percent. The commercials are Bullish-Extreme with a score of 83.4 percent and the small traders (not shown in chart) are Bearish with a score of 23.0 percent.
Price Trend-Following Model: Downtrend
Our weekly trend-following model classifies the current market price position as: Downtrend.
| SWISS FRANC Statistics | SPECULATORS | COMMERCIALS | SMALL TRADERS |
| – Percent of Open Interest Longs: | 7.2 | 83.7 | 9.0 |
| – Percent of Open Interest Shorts: | 46.4 | 31.1 | 22.4 |
| – Net Position: | -38,359 | 51,505 | -13,146 |
| – Gross Longs: | 7,047 | 81,921 | 8,807 |
| – Gross Shorts: | 45,406 | 30,416 | 21,953 |
| – Long to Short Ratio: | 0.2 to 1 | 2.7 to 1 | 0.4 to 1 |
| NET POSITION TREND: | | | |
| – Strength Index Score (3 Year Range Pct): | 23.2 | 83.4 | 23.0 |
| – Strength Index Reading (3 Year Range): | Bearish | Bullish-Extreme | Bearish |
| NET POSITION MOVEMENT INDEX: | | | |
| – 6-Week Change in Strength Index: | -1.0 | -4.8 | 14.5 |
Canadian Dollar Futures:
 The Canadian Dollar large speculator standing this week reached a net position of -144,643 contracts in the data reported through Tuesday. This was a weekly rise of 6,191 contracts from the previous week which had a total of -150,834 net contracts.
This week’s current strength score (the trader positioning range over the past three years, measured from 0 to 100) shows the speculators are currently Bearish with a score of 23.1 percent. The commercials are Bullish with a score of 78.4 percent and the small traders (not shown in chart) are Bearish with a score of 22.6 percent.
Price Trend-Following Model: Downtrend
Our weekly trend-following model classifies the current market price position as: Downtrend.
| CANADIAN DOLLAR Statistics | SPECULATORS | COMMERCIALS | SMALL TRADERS |
| – Percent of Open Interest Longs: | 6.6 | 82.4 | 8.2 |
| – Percent of Open Interest Shorts: | 51.3 | 35.6 | 10.3 |
| – Net Position: | -144,643 | 151,212 | -6,569 |
| – Gross Longs: | 21,276 | 266,233 | 26,645 |
| – Gross Shorts: | 165,919 | 115,021 | 33,214 |
| – Long to Short Ratio: | 0.1 to 1 | 2.3 to 1 | 0.8 to 1 |
| NET POSITION TREND: | | | |
| – Strength Index Score (3 Year Range Pct): | 23.1 | 78.4 | 22.6 |
| – Strength Index Reading (3 Year Range): | Bearish | Bullish | Bearish |
| NET POSITION MOVEMENT INDEX: | | | |
| – 6-Week Change in Strength Index: | 15.2 | -17.0 | 18.8 |
Australian Dollar Futures:
 The Australian Dollar large speculator standing this week reached a net position of -56,723 contracts in the data reported through Tuesday. This was a weekly advance of 8,862 contracts from the previous week which had a total of -65,585 net contracts.
This week’s current strength score (the trader positioning range over the past three years, measured from 0 to 100) shows the speculators are currently Bearish with a score of 36.0 percent. The commercials are Bullish with a score of 65.9 percent and the small traders (not shown in chart) are Bearish with a score of 39.5 percent.
Price Trend-Following Model: Downtrend
Our weekly trend-following model classifies the current market price position as: Downtrend.
| AUSTRALIAN DOLLAR Statistics | SPECULATORS | COMMERCIALS | SMALL TRADERS |
| – Percent of Open Interest Longs: | 24.7 | 58.0 | 13.6 |
| – Percent of Open Interest Shorts: | 54.6 | 26.2 | 15.5 |
| – Net Position: | -56,723 | 60,353 | -3,630 |
| – Gross Longs: | 46,918 | 110,010 | 25,863 |
| – Gross Shorts: | 103,641 | 49,657 | 29,493 |
| – Long to Short Ratio: | 0.5 to 1 | 2.2 to 1 | 0.9 to 1 |
| NET POSITION TREND: | | | |
| – Strength Index Score (3 Year Range Pct): | 36.0 | 65.9 | 39.5 |
| – Strength Index Reading (3 Year Range): | Bearish | Bullish | Bearish |
| NET POSITION MOVEMENT INDEX: | | | |
| – 6-Week Change in Strength Index: | 11.9 | -13.5 | 15.7 |
New Zealand Dollar Futures:
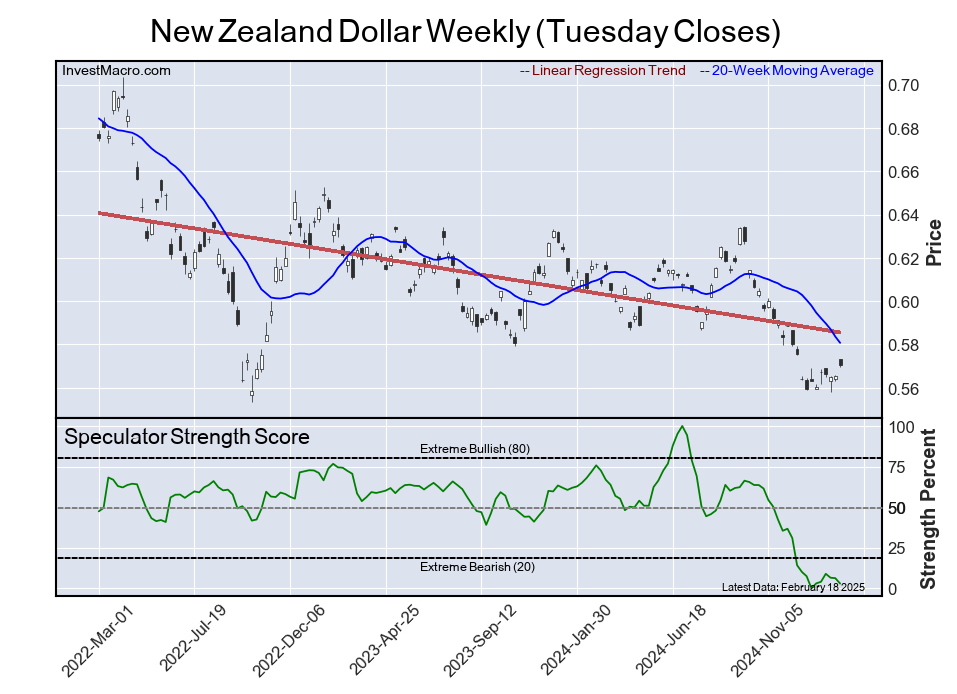
 The New Zealand Dollar large speculator standing this week reached a net position of -52,163 contracts in the data reported through Tuesday. This was a weekly fall of -2,827 contracts from the previous week which had a total of -49,336 net contracts.
This week’s current strength score (the trader positioning range over the past three years, measured from 0 to 100) shows the speculators are currently Bearish-Extreme with a score of 2.9 percent. The commercials are Bullish-Extreme with a score of 96.3 percent and the small traders (not shown in chart) are Bearish with a score of 32.2 percent.
Price Trend-Following Model: Downtrend
Our weekly trend-following model classifies the current market price position as: Downtrend.
| NEW ZEALAND DOLLAR Statistics | SPECULATORS | COMMERCIALS | SMALL TRADERS |
| – Percent of Open Interest Longs: | 14.6 | 80.4 | 4.2 |
| – Percent of Open Interest Shorts: | 73.0 | 20.2 | 6.0 |
| – Net Position: | -52,163 | 53,832 | -1,669 |
| – Gross Longs: | 13,048 | 71,887 | 3,718 |
| – Gross Shorts: | 65,211 | 18,055 | 5,387 |
| – Long to Short Ratio: | 0.2 to 1 | 4.0 to 1 | 0.7 to 1 |
| NET POSITION TREND: | | | |
| – Strength Index Score (3 Year Range Pct): | 2.9 | 96.3 | 32.2 |
| – Strength Index Reading (3 Year Range): | Bearish-Extreme | Bullish-Extreme | Bearish |
| NET POSITION MOVEMENT INDEX: | | | |
| – 6-Week Change in Strength Index: | 2.9 | -3.7 | 10.2 |
Mexican Peso Futures:
 The Mexican Peso large speculator standing this week reached a net position of 14,673 contracts in the data reported through Tuesday. This was a weekly reduction of -1,177 contracts from the previous week which had a total of 15,850 net contracts.
This week’s current strength score (the trader positioning range over the past three years, measured from 0 to 100) shows the speculators are currently Bearish with a score of 36.2 percent. The commercials are Bullish with a score of 67.6 percent and the small traders (not shown in chart) are Bearish-Extreme with a score of 12.5 percent.
Price Trend-Following Model: Downtrend
Our weekly trend-following model classifies the current market price position as: Downtrend.
| MEXICAN PESO Statistics | SPECULATORS | COMMERCIALS | SMALL TRADERS |
| – Percent of Open Interest Longs: | 42.6 | 52.7 | 2.5 |
| – Percent of Open Interest Shorts: | 32.8 | 61.2 | 3.7 |
| – Net Position: | 14,673 | -12,824 | -1,849 |
| – Gross Longs: | 63,852 | 78,851 | 3,749 |
| – Gross Shorts: | 49,179 | 91,675 | 5,598 |
| – Long to Short Ratio: | 1.3 to 1 | 0.9 to 1 | 0.7 to 1 |
| NET POSITION TREND: | | | |
| – Strength Index Score (3 Year Range Pct): | 36.2 | 67.6 | 12.5 |
| – Strength Index Reading (3 Year Range): | Bearish | Bullish | Bearish-Extreme |
| NET POSITION MOVEMENT INDEX: | | | |
| – 6-Week Change in Strength Index: | 1.2 | -1.2 | -0.0 |
Brazilian Real Futures:
 The Brazilian Real large speculator standing this week reached a net position of 940 contracts in the data reported through Tuesday. This was a weekly decline of -140 contracts from the previous week which had a total of 1,080 net contracts.
This week’s current strength score (the trader positioning range over the past three years, measured from 0 to 100) shows the speculators are currently Bullish with a score of 53.0 percent. The commercials are Bearish with a score of 47.2 percent and the small traders (not shown in chart) are Bearish with a score of 28.1 percent.
Price Trend-Following Model: Weak Downtrend
Our weekly trend-following model classifies the current market price position as: Weak Downtrend.
| BRAZIL REAL Statistics | SPECULATORS | COMMERCIALS | SMALL TRADERS |
| – Percent of Open Interest Longs: | 59.5 | 31.0 | 4.0 |
| – Percent of Open Interest Shorts: | 58.4 | 33.6 | 2.5 |
| – Net Position: | 940 | -2,216 | 1,276 |
| – Gross Longs: | 50,763 | 26,471 | 3,444 |
| – Gross Shorts: | 49,823 | 28,687 | 2,168 |
| – Long to Short Ratio: | 1.0 to 1 | 0.9 to 1 | 1.6 to 1 |
| NET POSITION TREND: | | | |
| – Strength Index Score (3 Year Range Pct): | 53.0 | 47.2 | 28.1 |
| – Strength Index Reading (3 Year Range): | Bullish | Bearish | Bearish |
| NET POSITION MOVEMENT INDEX: | | | |
| – 6-Week Change in Strength Index: | 32.2 | -33.8 | 12.2 |
Bitcoin Futures:
 The Bitcoin large speculator standing this week reached a net position of -367 contracts in the data reported through Tuesday. This was a weekly fall of 0 contracts from the previous week which had a total of -367 net contracts.
This week’s current strength score (the trader positioning range over the past three years, measured from 0 to 100) shows the speculators are currently Bearish with a score of 43.3 percent. The commercials are Bullish with a score of 66.9 percent and the small traders (not shown in chart) are Bearish with a score of 27.0 percent.
Price Trend-Following Model: Uptrend
Our weekly trend-following model classifies the current market price position as: Uptrend.
| BITCOIN Statistics | SPECULATORS | COMMERCIALS | SMALL TRADERS |
| – Percent of Open Interest Longs: | 80.9 | 5.0 | 4.5 |
| – Percent of Open Interest Shorts: | 82.0 | 4.5 | 3.8 |
| – Net Position: | -367 | 141 | 226 |
| – Gross Longs: | 27,367 | 1,680 | 1,519 |
| – Gross Shorts: | 27,734 | 1,539 | 1,293 |
| – Long to Short Ratio: | 1.0 to 1 | 1.1 to 1 | 1.2 to 1 |
| NET POSITION TREND: | | | |
| – Strength Index Score (3 Year Range Pct): | 43.3 | 66.9 | 27.0 |
| – Strength Index Reading (3 Year Range): | Bearish | Bullish | Bearish |
| NET POSITION MOVEMENT INDEX: | | | |
| – 6-Week Change in Strength Index: | -34.0 | 38.6 | 0.6 |
Article By InvestMacro – Receive our weekly COT Newsletter
*COT Report: The COT data, released weekly to the public each Friday, is updated through the most recent Tuesday (data is 3 days old) and shows a quick view of how large speculators or non-commercials (for-profit traders) were positioned in the futures markets.
The CFTC categorizes trader positions according to commercial hedgers (traders who use futures contracts for hedging as part of the business), non-commercials (large traders who speculate to realize trading profits) and nonreportable traders (usually small traders/speculators) as well as their open interest (contracts open in the market at time of reporting). See CFTC criteria here.