The EUR/USD pair surged to a fresh three-year peak on Monday, holding steady at 1.1518 amid growing unease over US economic policy.
Key Drivers Behind the EUR/USD Rally
Investors returning from the Easter break were met with renewed concerns over the US White House’s stance on the Federal Reserve and its Chair, Jerome Powell. Questions surrounding the Fed’s independence have unsettled markets, particularly after Donald Trump ramped up his criticism of Powell.
While the US President has previously threatened to dismiss Powell, legal and institutional barriers make such a move difficult. Nevertheless, Trump’s rhetoric has grown increasingly aggressive, as he pushes for swifter interest rate cuts and greater monetary policy flexibility. The Fed, however, remains caught between taming inflation and navigating a robust labour market—a delicate balancing act that has only heightened market anxiety.
These tensions compound existing worries over escalating trade conflicts and broader uncertainty surrounding the Trump administration’s economic policies. Over the weekend, Chicago Fed President Austan Goolsbee added to the unease, warning that US tariffs could dampen economic activity by summer.
Technical Analysis: EUR/USD
H4 Chart Outlook
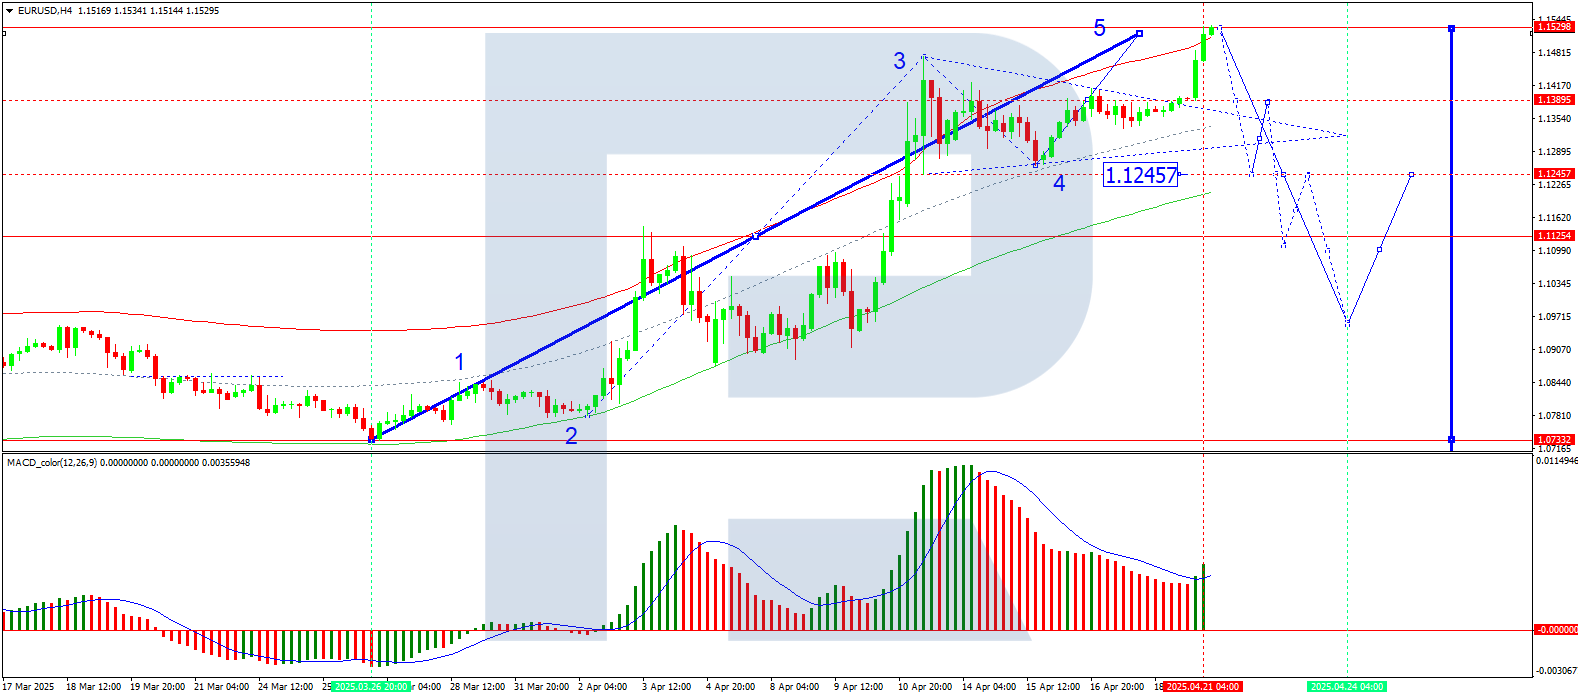
The pair previously consolidated around 1.1333 before breaking upward.
After finding support at 1.1390, it formed a bullish wave towards 1.1530.
A downward correction towards 1.1390 is now anticipated. A break below this level could extend losses to 1.1245.
The MACD indicator supports this view, with its signal line above zero but pointing sharply downward.
H1 Chart Outlook
The market briefly consolidated near 1.1390 before rallying to 1.1530.
A pullback towards 1.1390 is now in focus, with a breakdown potentially opening the door to 1.1245.
The Stochastic oscillator aligns with this scenario, hovering above 80 and poised for a decline towards 20.
Conclusion
The EUR/USD rally reflects mounting scepticism towards US policy stability, with technical indicators now hinting at a potential retracement. Traders will be watching closely for further Fed commentary and political developments that could sway the pair’s trajectory.
Disclaimer
Any forecasts contained herein are based on the author’s particular opinion. This analysis may not be treated as trading advice. RoboForex bears no responsibility for trading results based on trading recommendations and reviews contained herein.
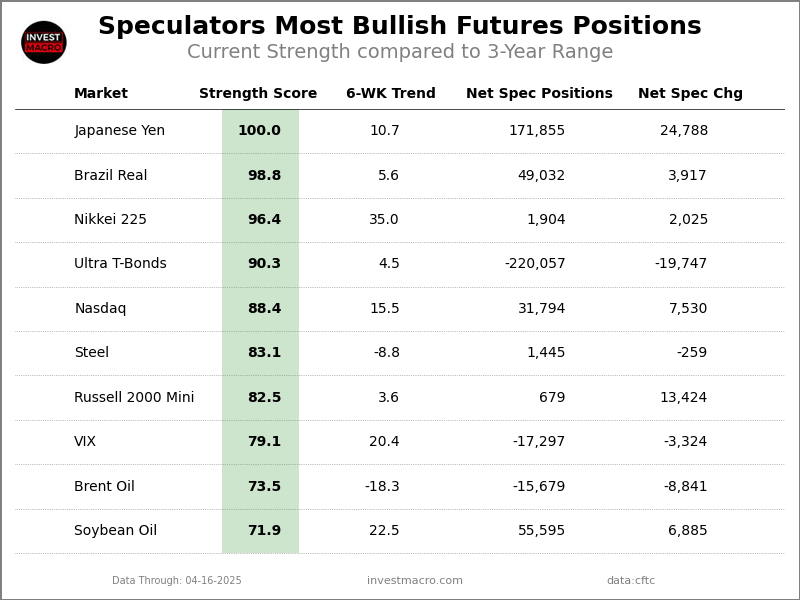
The latest update for the weekly Commitment of Traders (COT) report was released by the Commodity Futures Trading Commission (CFTC) on Friday for data ending on April 15th.
This weekly Extreme Positions report highlights the Most Bullish and Most Bearish Positions for the speculator category. Extreme positioning in these markets can foreshadow strong moves in the underlying market.
To signify an extreme position, we use the Strength Index (also known as the COT Index) of each instrument, a common method of measuring COT data. The Strength Index is simply a comparison of current trader positions against the range of positions over the previous 3 years. We use over 80 percent as extremely bullish and under 20 percent as extremely bearish. (Compare Strength Index scores across all markets in the data table or cot leaders table)
Here Are This Week’s Most Bullish Speculator Positions:
Japanese Yen
The Japanese Yen speculator position continues to make new all-time record highs and comes in as the most bullish extreme standing again this week. The Japanese Yen speculator level is currently at a maximum 100.0 percent score of its 3-year range.
The six-week trend for the percent strength score totaled a gain of 10.7 this week. The overall net speculator position was a total of 171,855 net contracts this week with a boost by 24,788 contracts in the weekly speculator bets.
Speculators or Non-Commercials Notes:
Speculators, classified as non-commercial traders by the CFTC, are made up of large commodity funds, hedge funds and other significant for-profit participants. The Specs are generally regarded as trend-followers in their behavior towards price action – net speculator bets and prices tend to go in the same directions. These traders often look to buy when prices are rising and sell when prices are falling. To illustrate this point, many times speculator contracts can be found at their most extremes (bullish or bearish) when prices are also close to their highest or lowest levels.
These extreme levels can be dangerous for the large speculators as the trade is most crowded, there is less trading ammunition still sitting on the sidelines to push the trend further and prices have moved a significant distance. When the trend becomes exhausted, some speculators take profits while others look to also exit positions when prices fail to continue in the same direction. This process usually plays out over many months to years and can ultimately create a reverse effect where prices start to fall and speculators start a process of selling when prices are falling.
Brazil Real
The Brazil Real speculator position comes next in the extreme standings this week as the Brazil Real speculator level has seen rising sentiment and is now at a 98.8 percent score of its 3-year range.
The six-week trend for the percent strength score was 5.6 this week. The speculator position registered 49,032 net contracts this week with a weekly rise of 3,917 contracts in speculator bets.
Nikkei 225
The Nikkei 225 speculator position comes in third this week in the extreme standings. The Nikkei 225 speculator level resides at a 96.4 percent score of its 3-year range.
The six-week trend for the speculator strength score came in at a rise of 35.0 this week. The overall speculator position was 1,904 net contracts this week following an increase by 2,025 contracts in the weekly speculator bets.
Ultra U.S. Treasury Bonds
The Ultra U.S. Treasury Bonds speculator position comes up number four in the extreme standings this week. The Ultra U.S. Treasury Bonds speculator level is at a 90.3 percent score of its 3-year range.
The six-week trend for the speculator strength score totaled a change of 4.5 this week. The overall speculator position was -220,057 net contracts this week with a decline of -19,747 contracts in the speculator bets.
Nasdaq
The Nasdaq speculator position rounds out the top five in this week’s bullish extreme standings as the Nasdaq speculator level sits at a 88.4 percent score of its 3-year range. The six-week trend for the speculator strength score was 15.5 this week.
The speculator position totaled 31,794 net contracts this week with a gain of 7,530 contracts in the weekly speculator bets.
This Week’s Most Bearish Speculator Positions:
5-Year Bond
The 5-Year Bond speculator position comes in as the most bearish extreme standing this week. The 5-Year Bond speculator level is at a 0.0 percent score of its 3-year range.
The six-week trend for the speculator strength score was -13.4 this week. The overall speculator position totals -2,061,575 net contracts this week with a drop of -40,000 contracts in the speculator bets.
WTI Crude Oil
The WTI Crude Oil speculator position comes in next for the most bearish extreme standing on the week. The WTI Crude Oil speculator level is at a 3.8 percent score of its 3-year range.
The six-week trend for the speculator strength score was -4.0 this week. The speculator position was 146,370 net contracts this week with a rise by 6,775 contracts in the weekly speculator bets.
US Dollar Index
The US Dollar Index speculator position comes in as third most bearish extreme standing of the week. The US Dollar Index speculator level resides at a 10.5 percent score of its 3-year range.
The six-week trend for the speculator strength score was -26.8 this week. The overall speculator position totaled 1,828 net contracts this week with a drop by -1,085 contracts in the speculator bets.
Wheat
The Wheat speculator position comes in as this week’s fourth most bearish extreme standing as the Wheat speculator level is at a 11.0 percent score of its 3-year range.
The six-week trend for the speculator strength score was -2.6 this week. The speculator position was -88,326 net contracts this week following an increase of 3,598 contracts in the weekly speculator bets.
E-mini SP MidCap400
Finally, the E-mini SP MidCap400 speculator position comes in as the fifth most bearish extreme standing for this week. The E-mini SP MidCap400 speculator level is at a 11.1 percent score of its 3-year range.
The six-week trend for the speculator strength score was -16.1 this week. The speculator position is a total of -91 net contracts this week with a change of -1,984 contracts in the weekly speculator bets.
Article By InvestMacro – Receive our weekly COT Newsletter
*COT Report: The COT data, released weekly to the public each Friday, is updated through the most recent Tuesday (data is 3 days old) and shows a quick view of how large speculators or non-commercials (for-profit traders) were positioned in the futures markets.
The CFTC categorizes trader positions according to commercial hedgers (traders who use futures contracts for hedging as part of the business), non-commercials (large traders who speculate to realize trading profits) and nonreportable traders (usually small traders/speculators) as well as their open interest (contracts open in the market at time of reporting). See CFTC criteria here.
UK data + Bailey speech + US data = heightened volatility?
UK retail sales sparked moves of ↑ 0.3% & ↓ 0.4% over past year
Technical levels – 1.3400, 1.3300 & 1.3150
Stability may return to markets as investors adopt a wait-and-see approach toward tariff talks.
There is cautious optimism over the US striking a trade deal with Japan and Europe, while China has expressed interest in talks if Trump shows respect.
Easing trade tensions could lift sentiment in the week ahead, providing fresh opportunities across financial markets.
Beyond trade developments, key economic data and corporate earnings will be in focus:
Monday, 21st April
CN50: China loan prime rates
Tuesday, 22nd April
AU200: S&P Global Australia PMI’s
NAS100: Tesla earnings
Wednesday, 23rd April
EU50: Euro-Area Flash PMI’s
GER40: HCOB Germany PMI’s
GBP: S&P Global UK PMI’s, BoE Governor Bailey speech
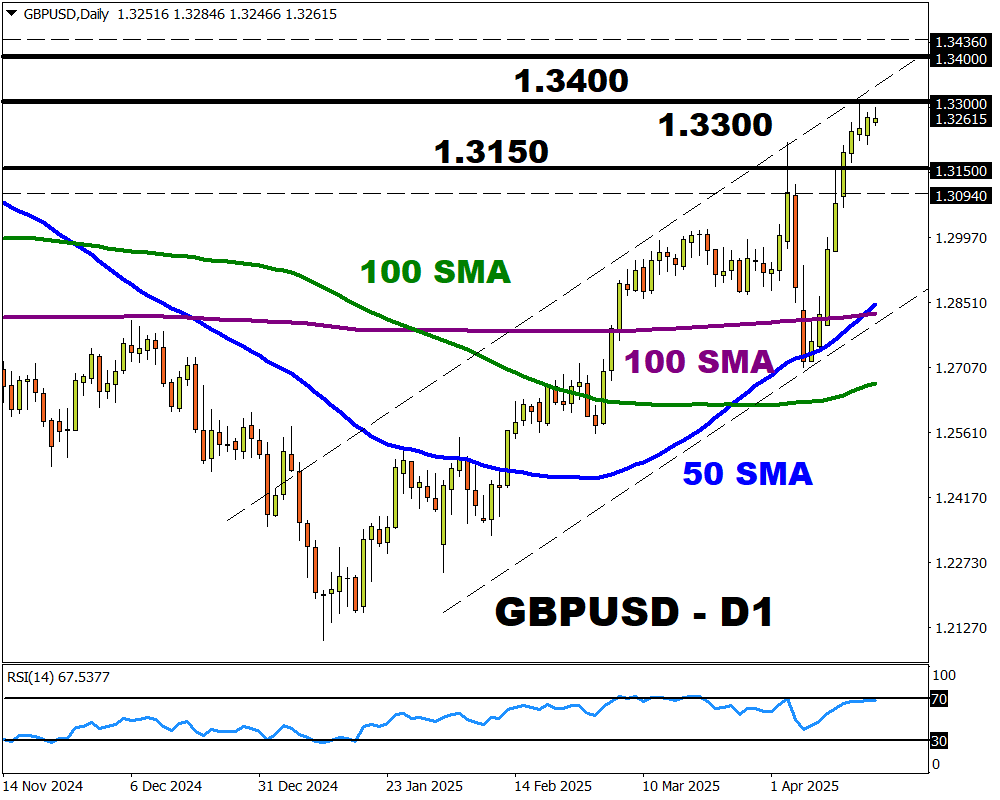
Our attention falls on the GBPUSD which has formed a “golden cross” pattern on the daily charts.
Imagen
Note: A golden cross is when an asset’s 50-day simple moving average (SMA) crosses above its 200-day SMA. This event indicates that prices may push higher.
Over the past two weeks, the GBPUSD has been on a tear thanks to a broadly weaker dollar. Prices have jumped almost 3% this month, pushing year-to-date gains to 6%.
With the major currency pair approaching resistance at 1.3300, a significant breakout could be on the horizon.
Here are 3 reasons why:
1) UK data + BoE Bailey speech
The incoming UK data could provide insight into how the economy fared during mounting uncertainty over US tariff announcements.
On Wednesday, the latest S&P Global UK PMIs will be published, followed by the GfK consumer Confidence on Thursday and UK retail sales on Friday. Much attention will be paid to BoE Governor Bailey’s speech mid-week which may offer clues on future policy moves.
Note: Over the past 12 months, the UK retail sales report has sparked upside moves of as much as 0.3% or declines of 0.4% in the 6 hours post-release.
The GBPUSD could appreciate if overall data prints better than expected and Bailey strikes a hawkish note.
If UK economic data disappoints and Bailey expresses concern over the UK economic outlook, the GBPUSD may sink as BoE cut bets jump.
As of writing traders are currently pricing in 3 BoE cuts in 2025 with the probability of a fourth one by December at 23%.
2) US data + Fed Beige Book
Upcoming US data and the Fed’s Beige Book may illustrate how the world’s largest economy has been impacted by trade uncertainty.
Mid-week, the latest US S&P PMIs and beige book will be published, followed by the initial jobless claims on Thursday and the University of Michigan Sentiment on Friday.
Note: Over the past 12 months, the US S&P PMI reports have triggered upside moves of as much as 0.5% or declines of 0.6% in a 6-hour window post-release.
A solid set of economic reports from the United States may boost the dollar, dragging the GBPUSD lower.
Should the dollar weaken on soft economic data, the GBPUSD may push higher.
3) Technical forces
The GBPUSD is firmly bullish on the daily charts with prices trading above the 50, 100 and 200-day SMA. As discussed earlier, the “golden cross” pattern is a strong bullish signal with key resistance at 1.3300.
A daily close above 1.3300 may trigger an incline toward 1.3400 and 1.3436 – the upper limit of Bloomberg’s FX model.
Sustained weakness below 1.3300, may see prices decline toward 1.3150 and 1.3094 – the lower bound of Bloomberg’s FX model.
Imagen
Bloomberg’s FX model forecasts a 76% chance that GBPUSD will trade within the 1.3094 – 1.3436 range, using current levels as a base, over the next one-week period.
As of Thursday’s close, the Dow Jones Index (US30) was down 1.33%. The S&P 500 Index (US500) was up 0.13%. The Nasdaq Technology Index (US100) closed at opening levels. The US stocks closed mixed ahead of the Good Friday holiday as investors weighed trade talks and interest rate uncertainty. A decline in weekly jobless claims indicates a resilient labor market, although attention remains focused on trade talks and monetary policy signals. The US initial jobless claims fell by 9,000 from the previous week to 215,000 in the second week of April, contrary to market expectations of a 1,000 increase to 225,000, the lowest in two months.
Equity markets in Europe were mostly down yesterday. Germany’s DAX (DE40) fell by 0.49%, France’s CAC 40 (FR40) closed down 0.60%, Spain’s IBEX 35 (ES35) lost 0.19%, and the UK’s FTSE 100 (UK100) closed positive 0.01%. Frankfurt’s DAX Index remained in negative territory after the ECB cut rates in an expected move to cushion the economy from tariff-related tensions.
The ECB cut all three key interest rates by 25 basis points, lowering the main refinancing rate to 2.40%, the deposit rate to 2.25%, and the marginal lending facility to 2.65%, as expected. The decision reflects growing confidence that inflation is on track for a sustained return to the 2% target. The ECB acknowledged that growth prospects have weakened and emphasized that further action will depend on the data. European markets will be closed for Easter through Monday and will reopen on Tuesday, April 22.
WTI crude oil prices rose by 3.5% on Thursday to settle at $64.70 a barrel, marking the second straight session of gains. The rise followed new US sanctions targeting Iran’s oil exports, adding to fears of a tightening global supply. The sanctions hit Iran’s oil sector and a refinery in China, increasing pressure on Tehran amid nuclear tensions. Supply concerns were further heightened after OPEC+ said it had received updated plans from Iraq, Kazakhstan, and other countries for additional production cuts.
Asian markets were predominantly up yesterday. Japan’s Nikkei 225 (JP225) gained 1.35%, China’s FTSE China A50 (CHA50) climbed 0.20%, Hong Kong’s Hang Seng (HK50) rose by 1.61%, and Australia’s ASX 200 (AU200) gained 0.78%. The recovery in Asian indices followed a rise in US futures after President Trump claimed “great progress” in talks aimed at helping Japan avoid a tariff hike. Investor sentiment was also boosted after Chinese President Xi Jinping called for regional unity and the creation of an “Asian family” during his tour of Southeast Asia.
The New Zealand dollar fell to US$0.593 on Friday, retreating from a five-month high and snapping a seven-day winning streak, as expectations of further easing by the Reserve Bank of New Zealand dampened momentum. This came despite stronger-than-expected first-quarter consumer inflation data, while core inflation figures declined. With price pressures contained and remaining within the RBNZ’s target range, markets still expect a rate cut in May and a reduction in the cash rate to 2.75% by the end of the year.
The Australian dollar slid to US$0.637 on Friday, breaking a seven-day winning streak in thin trading as local markets were closed due to the Good Friday holiday. The decline followed weaker-than-expected domestic employment data earlier in the week, which reinforced expectations of further monetary easing by the Reserve Bank of Australia.
Malaysia’s economy grew by 4.4% year-on-year in Q1 2025, compared to growth of 5% in the previous quarter. This is the slowest growth rate in a year, driven by weaker growth in services (5.2% vs. 5.4% in Q4), construction (14.5% vs. 20.7%), and manufacturing (4.2% vs. 4.4%). In quarterly terms, the economy contracted by 3.7% after growing by 2.7% in Q4.
S&P 500 (US500) 5,282.64 +6.94 (+0.13%)
Dow Jones (US30) 39,142.11 −527.28 (−1.33%)
DAX (DE40) 21,205.86 −105.16 (−0.49%)
FTSE 100 (UK100) 8,275.66 +0.061 (+0.01%)
USD Index 99.39 +0.01 (+0.01%)
News feed for: 2025.04.18
Japan National Core Consumer Price Index at 02:30 (GMT+3).
This article reflects a personal opinion and should not be interpreted as an investment advice, and/or offer, and/or a persistent request for carrying out financial transactions, and/or a guarantee, and/or a forecast of future events.
The EUR/USD pair continues to consolidate around 1.1371 this Friday, with trading activity subdued due to Good Friday market closures in the US and most of Europe.
Key Drivers of EUR/USD Movement
With low trading volumes, the pair’s movements remain constrained, leaving it near its three-year peak. Recent USD weakness stemmed from two primary factors:
Concerns over the impact of US tariff policies.
Growing political uncertainty under the Trump administration.
However, sentiment appears to be stabilising as the US engages in trade discussions with key partners, including Japan and Italy. President Trump hinted yesterday at a potential easing of trade tensions with China, suggesting he may halt further tariff hikes and even consider reductions in the future.
Simultaneously, Trump has sharpened his criticism of Federal Reserve Chairman Jerome Powell, expressing frustration over the slow pace of interest rate cuts. He emphasised, however, that Powell’s resignation is unlikely to happen soon.
On the data front, yesterday’s US jobless claims fell to a two-month low, reflecting the enduring strength of the labour market. Meanwhile, the ECB cut interest rates for the seventh consecutive time, adding further nuance to the currency dynamic.
Technical Analysis: EUR/USD
H4 Chart Outlook
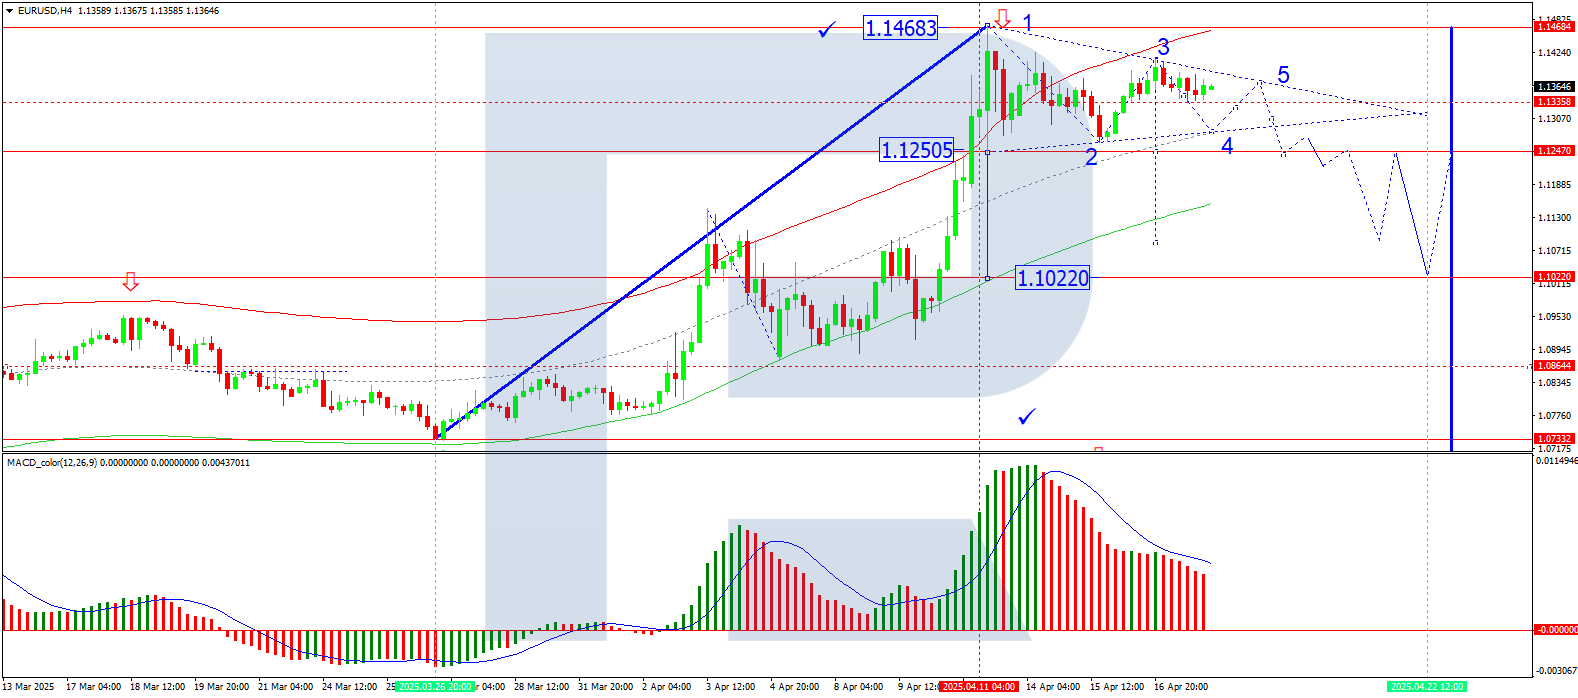
The pair is consolidating near 1.1333, with a potential Triangle pattern forming.
A decline to 1.1280 is anticipated, followed by a possible rebound to 1.1370 before another drop toward 1.1250.
This scenario is technically supported by the MACD, where the signal line remains above zero but points firmly downward.
H1 Chart Outlook
The pair completed a downward wave to 1.1264, then corrected to 1.1412.
Today, focus remains on a further decline to 1.1250. A breach here could open the door for a third wave of decline, targeting 1.1080, with potential extension to 1.1030.
The Stochastic oscillator aligns with this view, as its signal line sits below 80 and trends sharply downward toward 20.
Conclusion
With markets quiet for Good Friday, EUR/USD remains range-bound. However, technical indicators suggest downside risks in the near term, contingent on key support breaks. Traders should monitor US-China trade developments and Fed policy rhetoric for directional cues.
Disclaimer
Any forecasts contained herein are based on the author’s particular opinion. This analysis may not be treated as trading advice. RoboForex bears no responsibility for trading results based on trading recommendations and reviews contained herein.
ChatGPT and other AI chatbots based on large language models are known to occasionally make things up, including scientific andlegal citations. It turns out that measuring how accurate an AI model’s citations are is a good way of assessing the model’s reasoning abilities.
An AI model “reasons” by breaking down a query into steps and working through them in order. Think of how you learned to solve math word problems in school.
Ideally, to generate citations an AI model would understand the key concepts in a document, generate a ranked list of relevant papers to cite, and provide convincing reasoning for how each suggested paper supports the corresponding text. It would highlight specific connections between the text and the cited research, clarifying why each source matters.
The question is, can today’s models be trusted to make these connections and provide clear reasoning that justifies their source choices? The answer goes beyond citation accuracy to address how useful and accurate large language models are for any information retrieval purpose.
I’m a computer scientist. My colleagues − researchers from the AI Institute at the University of South Carolina, Ohio State University and University of Maryland Baltimore County − and I have developed the Reasons benchmark to test how well large language models can automatically generate research citations and provide understandable reasoning.
The accuracy of citations has a lot to do with whether the AI model is reasoning about information at the sentence level rather than paragraph or document level. Paragraph-level and document-level citations can be thought of as throwing a large chunk of information into a large language model and asking it to provide many citations.
In this process, the large language model overgeneralizes and misinterprets individual sentences. The user ends up with citations that explain the whole paragraph or document, not the relatively fine-grained information in the sentence.
Further, reasoning suffers when you ask the large language model to read through an entire document. These models mostly rely on memorizing patterns that they typically are better at finding at the beginning and end of longer texts than in the middle. This makes it difficult for them to fully understand all the important information throughout a long document.
Large language models get confused because paragraphs and documents hold a lot of information, which affects citation generation and the reasoning process. Consequently, reasoning from large language models over paragraphs and documents becomes more like summarizing or paraphrasing.
The Reasons benchmark addresses this weakness by examining large language models’ citation generation and reasoning.
How DeepSeek R1 and OpenAI o1 compare generally on logic problems.
Testing citations and reasoning
Following the release of DeepSeek R1 in January 2025, we wanted to examine its accuracy in generating citations and its quality of reasoning and compare it with OpenAI’s o1 model. We created a paragraph that had sentences from different sources, gave the models individual sentences from this paragraph, and asked for citations and reasoning.
To start our test, we developed a small test bed of about 4,100 research articles around four key topics that are related to human brains and computer science: neurons and cognition, human-computer interaction, databases and artificial intelligence. We evaluated the models using two measures: F-1 score, which measures how accurate the provided citation is, and hallucination rate, which measures how sound the model’s reasoning is − that is, how often it produces an inaccurate or misleading response.
Our testing revealed significant performance differences between OpenAI o1 and DeepSeek R1 across different scientific domains. OpenAI’s o1 did well connecting information between different subjects, such as understanding how research on neurons and cognition connects to human-computer interaction and then to concepts in artificial intelligence, while remaining accurate. Its performance metrics consistently outpaced DeepSeek R1’s across all evaluation categories, especially in reducing hallucinations and successfully completing assigned tasks.
OpenAI o1 was better at combining ideas semantically, whereas R1 focused on making sure it generated a response for every attribution task, which in turn increased hallucination during reasoning. OpenAI o1 had a hallucination rate of approximately 35% compared with DeepSeek R1’s rate of nearly 85% in the attribution-based reasoning task.
In terms of accuracy and linguistic competence, OpenAI o1 scored about 0.65 on the F-1 test, which means it was right about 65% of the time when answering questions. It also scored about 0.70 on the BLEU test, which measures how well a language model writes in natural language. These are pretty good scores.
DeepSeek R1 scored lower, with about 0.35 on the F-1 test, meaning it was right about 35% of the time. However, its BLEU score was only about 0.2, which means its writing wasn’t as natural-sounding as OpenAI’s o1. This shows that o1 was better at presenting that information in clear, natural language.
OpenAI holds the advantage
On other benchmarks, DeepSeek R1 performs on par with OpenAI o1 on math, coding and scientific reasoning tasks. But the substantial difference on our benchmark suggests that o1 provides more reliable information, while R1 struggles with factual consistency.
Though we included other models in our comprehensive testing, the performance gap between o1 and R1 specifically highlights the current competitive landscape in AI development, with OpenAI’s offering maintaining a significant advantage in reasoning and knowledge integration capabilities.
These results suggest that OpenAI still has a leg up when it comes to source attribution and reasoning, possibly due to the nature and volume of the data it was trained on. The company recently announced its deep research tool, which can create reports with citations, ask follow-up questions and provide reasoning for the generated response.
The jury is still out on the tool’s value for researchers, but the caveat remains for everyone: Double-check all citations an AI gives you.
At the end of Wednesday, the Dow Jones Index (US30) fell by 1.73%. The S&P 500 Index (US500) was down 2.24%. The Nasdaq Technology Index (US100) lost 3.04%. Wall Street faced a broad sell-off on Wednesday, led by a sharp drop in technology stocks amid escalating trade tensions and cautious remarks from Federal Reserve Chairman Jerome Powell. Nvidia fell by 6.9% after the chipmaker said it will have to pay $5.5 billion because of new restrictions on US exports of artificial intelligence chips destined for China. Other chipmakers followed: AMD (-7.3%) and Micron Technology (-2.4%) fell amid cost warnings and weak demand. Powell’s speech in Chicago added to market worries, warning that tariffs could push up inflation and slow growth, creating a dilemma for the Fed’s dual mandate. Investors were frustrated by the lack of a clear signal of future rate cuts, causing major indexes to fall to session lows.
The Bank of Canada kept its benchmark rate at 2.75%, its first pause after a cumulative 2.25 percentage point cut over seven meetings, citing the unclear outlook for tariffs in the US, which could either support solid growth with inflation near 2% or, if tariffs intensify, trigger a recession and higher inflation. This cautious stance has reinforced expectations of stable monetary policy in Canada, which has supported the Canadian dollar, while the US dollar is weakening under the weight of potential new tariffs on critical minerals, adding further uncertainty to the US growth outlook.
The World Trade Organization (WTO) warned that global trade could contract by 1.5% in 2025 if Donald Trump’s aggressive tariff policies cause widespread trade uncertainty, in sharp contrast to the previous expectations of 2.7% growth.
Equity markets in Europe were mostly up yesterday. Germany’s DAX (DE40) rose by 0.27%, France’s CAC 40 (FR40) closed 0.07% higher, Spain’s IBEX 35 (ES35) added 0.49%, and the UK’s FTSE 100 (UK100) closed positive 0.32%.
WTI crude oil prices hit $63 per barrel as new US sanctions against Chinese importers of Iranian oil renewed supply concerns. The sanctions are aimed at reducing Iran’s oil exports as nuclear talks resume, fueling fears of dwindling global supplies. Prices were further supported by an OPEC report that Iraq, Kazakhstan, and other countries are planning additional production cuts to offset previous overproduction.
Asian markets were predominantly falling yesterday. Japan’s Nikkei 225 (JP225) was down 1.01%, China’s FTSE China A50 (CHA50) added 0.48%, Hong Kong’s Hang Seng (HK50) was down 1.91%, and Australia’s ASX 200 (AU200) was negative 0.04%.
New Zealand’s annualized inflation rate rose to 2.5% in the first quarter, slightly above market expectations of 2.3%, up from 2.2% in the previous quarter. Despite the rise, the rate was within the Reserve Bank of New Zealand’s target range of 1-3% for the third consecutive quarter, reinforcing the view that this will not prevent further rate cuts. Markets still expect another 25bp rate cut at the next RBNZ meeting in May, with rates likely to reach the 2.75% level by the end of the year.
On Thursday, the Australian dollar slipped to USD 0.635, breaking a six-day winning streak, as weaker-than-expected employment data fueled expectations of further monetary easing by the Reserve Bank of Australia. While the unemployment rate remained at a low 4.1%, employment growth in March came in below expectations. This boosted bets that the RBA would cut interest rates by 25 basis points in May, with some even speculating a possible 50 basis point hike amid growing fears of a tariff-induced slowdown in the global economy.
S&P 500 (US500) 5,275.70 −120.93 (−2.24%)
Dow Jones (US30) 39,669.39 −699.57 (−1.73%)
DAX (DE40) 21,311.02 +57.32 (+0.27%)
FTSE 100 (UK100) 8,275.60 +26.48 (+0.32%)
USD Index 99.31 −0.91 (−0.90%)
News feed for: 2025.04.17
New Zealand Consumer Price Index (q/q) at 01:45 (GMT+3);
Japan Trade Balance (m/m) at 02:50 (GMT+3);
Australia Unemployment Rate (m/m) at 04:30 (GMT+3);
Eurozone ECB Rate Statement at 15:15 (GMT+3);
Eurozone ECB Monetary Policy Report at 15:15 (GMT+3);
US Initial Jobless Claims (w/w) at 15:30 (GMT+3);
US Philadelphia Fed Manufacturing Index (m/m) at 15:30 (GMT+3);
This article reflects a personal opinion and should not be interpreted as an investment advice, and/or offer, and/or a persistent request for carrying out financial transactions, and/or a guarantee, and/or a forecast of future events.
The GBP/USD pair climbed for seven consecutive days, reaching 1.3210, before experiencing a slight dip on Thursday. This marks the longest sustained rise for the currency pair since July last year, with the pound’s strength primarily driven by a weakening US dollar.
Key factors influencing GBP/USD movements
Fundamentally, the outlook remains mixed. The UK’s Consumer Price Index (CPI) fell more than anticipated in March, with annual inflation dropping to 2.6% and services sector inflation easing to 4.7%. This has alleviated some pressure on the Bank of England (BoE), prompting markets to adjust their expectations for monetary policy easing.
Traders are now pricing in rate cuts of around 85 basis points by year-end, with the first reduction widely expected in the coming months. By December, there is a greater than 50% probability of a further cut, as slowing inflation could give the BoE more flexibility to support the economy and households amid ongoing trade uncertainties.
Technical analysis: GBP/USD outlook
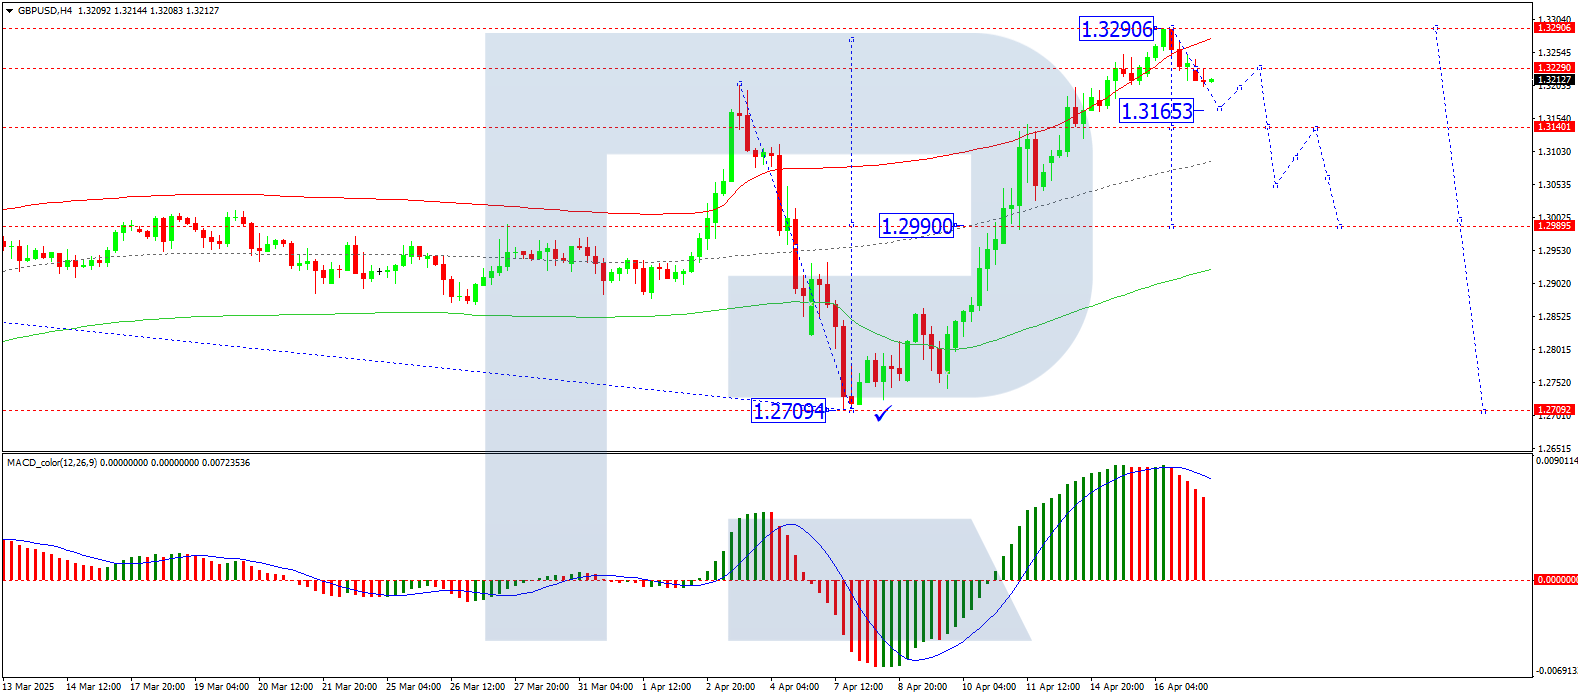
H4 Chart Perspective
The GBP/USD pair recently completed an upward wave, peaking near 1.3290
A downward impulse is now unfolding, targeting 1.3165
A potential rebound towards 1.3222 may follow before a possible decline to 1.2990
This outlook is supported by the MACD indicator, where the signal line has exited the histogram area and is trending sharply downward
H1 Chart Perspective
The pair consolidated around 1.3222 before breaking lower
The immediate downside target is 1.2880, followed by a potential retest of 1.3222 from below
The Stochastic oscillator reinforces this view, with its signal line below 50 and descending towards 20
Conclusion
While the pound benefits from a softer dollar and shifting rate expectations, technical indicators suggest potential near-term volatility. Traders should monitor both macroeconomic developments and key technical levels for further directional cues.
Disclaimer
Any forecasts contained herein are based on the author’s particular opinion. This analysis may not be treated as trading advice. RoboForex bears no responsibility for trading results based on trading recommendations and reviews contained herein.
At the end of Tuesday, the Dow Jones Index (US30) was down 0.38%. The S&P 500 Index (US500) decreased by 0.17%. The Nasdaq Technology Index (US100) jumped by 0.18%. The three major US stock indices ended mixed on Tuesday as investors weighed a fresh batch of corporate earnings and lingering concerns over tariffs and trade policy uncertainty. President Trump said China should return to the negotiating table to ease tariffs, emphasizing the importance of US consumer demand. Markets rose on Monday on hopes of a pause in tariffs on automobiles and exemptions for some technology goods. Meanwhile, the Commerce Department has begun inspecting imports of semiconductors and pharmaceuticals, signaling that new tariffs may be imposed.
Canada’s annualized inflation rate for March 2025 fell to 2.3% from an eight-month high of 2.6% in the previous month, below market expectations, which had expected inflation to remain at 2.6%, and below the Central Bank’s projections of 2.5%. The decline marked the beginning of a normalization of the Bank of England’s inflation prognoses for this year, after the end of the Goods and Services Tax (GST) and Harmonized Tax (HST) exemptions in the middle of last month caused core inflation to rise 0.6 percentage points. Gasoline prices declined (-1.6% vs. 5.1% in February) amid an aggressive fall in crude oil prices after OPEC+ confirmed plans to increase production, leading to a slowdown in transportation inflation (1.2% vs. 3%).
Equity markets in Europe were mostly up yesterday. Germany’s DAX (DE40) rose by 1.43%, France’s CAC 40 (FR40) closed 0.86% higher, Spain’s IBEX 35 (ES35) gained 2.14%, and the UK’s FTSE 100 (UK100) closed positive 1.41%. European equities closed solidly higher on Tuesday, extending last session’s sharp gains, after the prospect that the US may suspend the imposition of tariffs on cars and parts supported key sectors of the European economy.
WTI crude oil prices slipped toward $61 a barrel amid signs of weakening demand and a potential supply glut. The International Energy Agency sharply lowered its demand expectations for 2025, warning that the global glut could persist until 2026. OPEC and EIA also lowered their estimates due to slowing growth, trade tensions, and lower fuel consumption. Trump’s tariff war has raised concerns about slowing global growth, especially in the US and China, major oil consumers.
Asian markets were predominantly rising yesterday. Japan’s Nikkei 225 (JP225) gained 0.84% yesterday, China’s FTSE China A50 (CHA50) climbed 0.50%, Hong Kong’s Hang Seng (HK50) rose by 0.23%, and Australia’s ASX 200 (AU200) gained 0.17%.
The Reuters Tankan Sentiment Index for manufacturers in Japan jumped to positive 9 in April 2025 from negative 1 in March, the highest reading since August last year. Despite favorable current sentiment, the outlook for the next three months has deteriorated due to growing concerns over US trade policy. The index is expected to fall to zero as Japan prepares to impose 10% tariffs on US exports and 25% tariffs on automobiles. Export-oriented industries, especially automobile and machinery, are bracing for falling orders and rising customer caution.
China’s economy grew at an annualized rate of 5.4% in the first quarter of 2025, maintaining the same pace as in the fourth quarter and exceeding market expectations of 5.1%. This was the highest annualized growth rate in the past 1.5 years amid Beijing’s continued economic stimulus. China’s industrial production in March 2025 grew 7.7% y/y, exceeding market expectations of 5.6% and accelerating from the 5.9% growth recorded in January-February. This was the strongest growth in industrial production since June 2021. In addition, retail sales posted the fastest growth since December 2023 and beat market projections. On the labor side, the unemployment rate declined in March 2025 from the two-year high recorded in the previous month. These positive results were largely underpinned by ongoing stimulus policies aimed at strengthening the Chinese economy. Despite the positive data, escalating trade tensions between the US and China are clouding the outlook. Recently, US President Trump launched an investigation into new tariffs on imports of key minerals that are largely sourced from China, raising fresh concerns.
India’s annual inflation rate for March 2025 fell to 3.34% from 3.61% in the previous month, well below market expectations for an unchanged rate, and marked the fifth consecutive slowdown in inflation to its lowest level since August 2019. The decline pushed inflation further below the Reserve Bank of India’s average target of 4%.
S&P 500 (US500) 5,396.63 −9.34 (−0.17%)
Dow Jones (US30) 40,368.96 −155.83 (−0.38%)
DAX (DE40) 21,253.70 +298.87 (+1.43%)
FTSE 100 (UK100) 8,249.12 +114.78 (+1.41%)
USD Index 100.15 +0.51 (+0.51%)
News feed for: 2025.04.16
China GDP (q/q) at 05:00 (GMT+3);
China Industrial Production (y/y) at 05:00 (GMT+3);
China Unemployment Rate (m/m) at 05:00 (GMT+3);
China Retail Sales (m/m) at 05:00 (GMT+3);
UK Consumer Price Index (m/m) at 09:00 (GMT+3);
Eurozone Consumer Price Index (m/m) at 12:00 (GMT+3);
This article reflects a personal opinion and should not be interpreted as an investment advice, and/or offer, and/or a persistent request for carrying out financial transactions, and/or a guarantee, and/or a forecast of future events.
The USD/JPY pair extended its decline on Wednesday, dropping to 142.36 amid sustained dollar weakness.
Key factors driving USD/JPY Movements
The Japanese yen’s appreciation is being propelled by broad-based US dollar softness. The greenback faced selling pressure as concerns grew over the economic fallout from proposed new US tariffs.
In a fresh escalation of trade tensions, US President Donald Trump has called for an investigation into imposing tariffs on critical mineral imports – many of which originate from China. This move has heightened investor anxiety, further weighing on the dollar.
Meanwhile, market attention is turning to the upcoming US-Japan trade talks, where Tokyo is expected to push for the complete removal of US tariffs.
On the domestic front, Japan’s latest economic data revealed an eight-month high in manufacturing sector optimism for April. However, the outlook remains cautious due to lingering risks surrounding US trade policy.
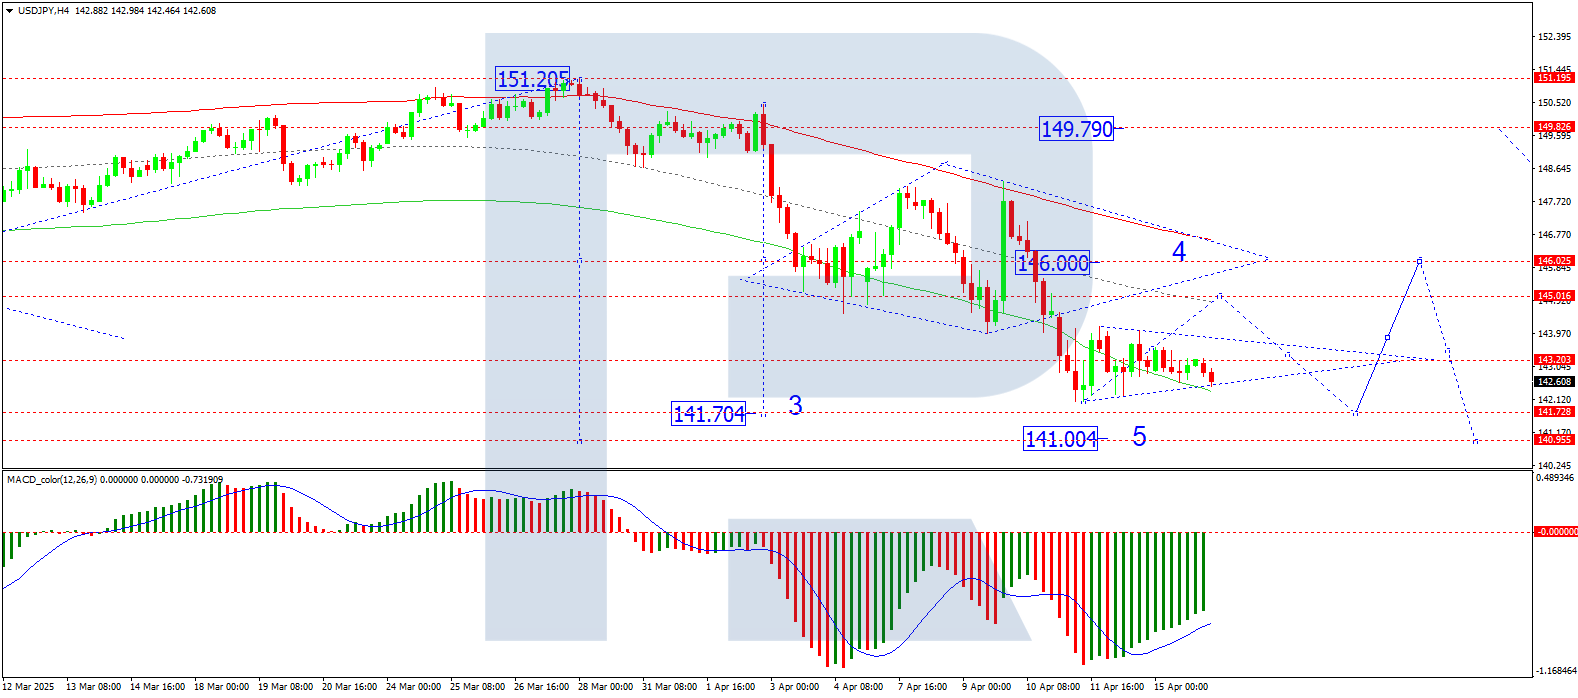
Technical Analysis: USD/JPY
The USD/JPY pair continues to consolidate around 143.20. A downside breakout could signal a further decline towards 141.70, marking the third wave of the downtrend. Conversely, an upside breakout may trigger a technical correction towards 145.00. This scenario is supported by the MACD indicator, with its signal line below zero but pointing firmly upwards.
The pair has formed a broader consolidation range between 142.46 and 144.07, with a triangle pattern emerging. A breakout above this range could initiate a corrective rally towards 145.00. The Stochastic oscillator reinforces this view, as its signal line – currently below 20 – is trending sharply upwards towards 80.
Conclusion
The yen’s rapid appreciation reflects both dollar weakness and cautious optimism in Japan’s manufacturing sector. However, trade policy uncertainties and technical patterns suggest continued volatility, with key levels at 141.70 (downside) and 145.00 (upside) in focus.
Disclaimer
Any forecasts contained herein are based on the author’s particular opinion. This analysis may not be treated as trading advice. RoboForex bears no responsibility for trading results based on trading recommendations and reviews contained herein.