By InvestMacro
Here are the latest charts and statistics for the Commitment of Traders (COT) reports data published by the Commodities Futures Trading Commission (CFTC).
The latest COT data is updated through Tuesday July 22nd and shows a quick view of how large traders (for-profit speculators and commercial entities) were positioned in the futures markets.
Weekly Speculator Changes led by Soybeans, Soybean Oil & Wheat

The COT soft commodities markets speculator bets were slightly lower this week as five out of the eleven softs markets we cover had higher positioning while the other six markets had lower speculator contracts.
Leading the gains for the softs markets was Soybeans (20,739 contracts) with Soybean Oil (12,389 contracts), Wheat (11,612 contracts), Soybean Meal (6,164 contracts) and Live Cattle (4,413 contracts) also showing positive weeks.
The markets with the declines in speculator bets this week were Sugar (-7,630 contracts), Lean Hogs (-7,623 contracts), Corn (-4,426 contracts), Cocoa (-3,491 contracts), Cotton (-2,167 contracts) and Coffee (-16 contracts) with also registering lower bets on the week.
Soft Commodities Prices down over the week
The soft commodities market prices were down across the board, with Live Cattle being the only market that had a positive week.
Soybean Meal dropped by almost -4%, Cocoa by over -3%, and Sugar was down by -2.5%. Soybeans, Coffee, Wheat, and Corn were also down by over -1 percent.
Over the past 30 days, Coffee is down by over -13%, followed by Soybean Meal which is lower by almost -9%. On the positive side, Cocoa is up by 14% in the last 30 days, followed by Soybean Oil which is up by over 10% in the same time frame.
Soft Commodities Data:

Legend: Weekly Speculators Change | Speculators Current Net Position | Speculators Strength Score compared to last 3-Years (0-100 range)
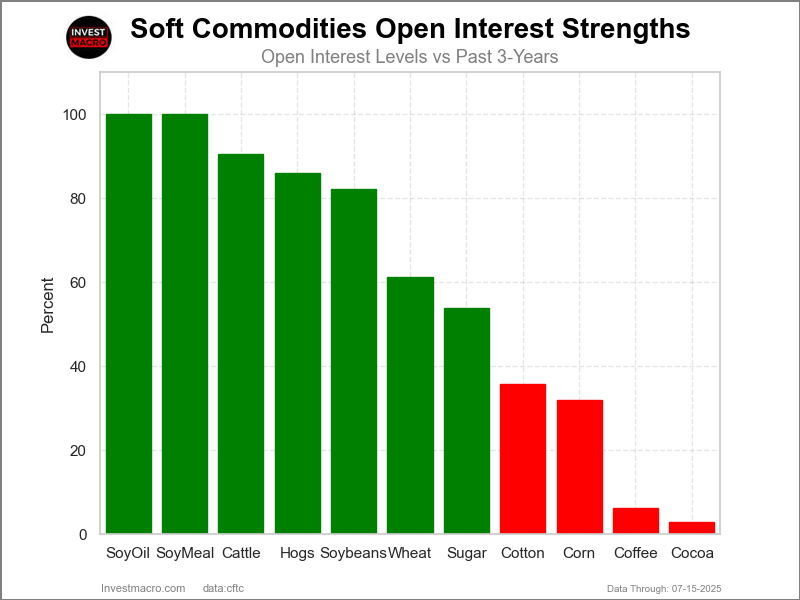
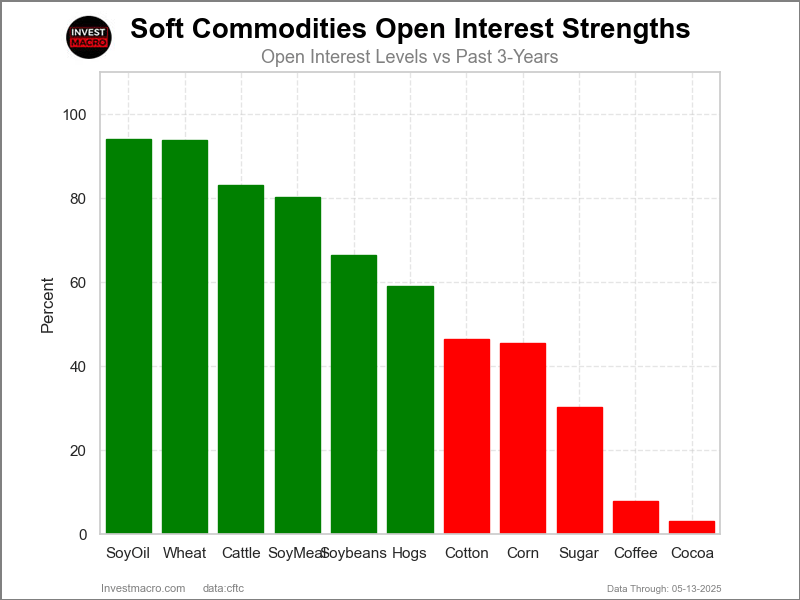
Strength Scores led by Live Cattle & Soybean Oil

COT Strength Scores (a normalized measure of Speculator positions over a 3-Year range, from 0 to 100 where above 80 is Extreme-Bullish and below 20 is Extreme-Bearish) showed that Live Cattle (85 percent), Lean Hogs (84 percent) and Soybean Oil (84 percent) lead the softs markets this week. Soybeans (60 percent) and Coffee (56 percent) come in as the next highest in the weekly strength scores.
On the downside, Sugar (2 percent), Soybean Meal (5 percent), Cocoa (19 percent) and Corn (18 percent) come in at the lowest strength levels currently and are in Extreme-Bearish territory (below 20 percent).
Strength Statistics:
Corn (18.0 percent) vs Corn previous week (18.6 percent)
Sugar (2.1 percent) vs Sugar previous week (4.3 percent)
Coffee (56.0 percent) vs Coffee previous week (56.0 percent)
Soybeans (59.7 percent) vs Soybeans previous week (54.4 percent)
Soybean Oil (84.1 percent) vs Soybean Oil previous week (77.3 percent)
Soybean Meal (5.0 percent) vs Soybean Meal previous week (2.7 percent)
Live Cattle (85.3 percent) vs Live Cattle previous week (81.0 percent)
Lean Hogs (84.1 percent) vs Lean Hogs previous week (89.8 percent)
Cotton (21.2 percent) vs Cotton previous week (22.5 percent)
Cocoa (18.5 percent) vs Cocoa previous week (22.0 percent)
Wheat (51.9 percent) vs Wheat previous week (42.5 percent)
Wheat & Soybean Oil top the 6-Week Strength Trends

COT Strength Score Trends (or move index, calculates the 6-week changes in strength scores) showed that Wheat (32 percent) and Soybean Oil (19 percent) lead the past six weeks trends for soft commodities. Cotton (6 percent) is the next highest positive mover in the latest trends data.
Sugar (-12 percent) leads the downside trend scores currently with Cocoa (-11 percent), Soybean Meal (-10 percent) and Soybeans (-9 percent) following next with lower trend scores.
Strength Trend Statistics:
Corn (-5.2 percent) vs Corn previous week (-6.6 percent)
Sugar (-11.6 percent) vs Sugar previous week (-13.9 percent)
Coffee (-6.0 percent) vs Coffee previous week (-3.8 percent)
Soybeans (-8.8 percent) vs Soybeans previous week (-11.4 percent)
Soybean Oil (19.5 percent) vs Soybean Oil previous week (12.3 percent)
Soybean Meal (-9.7 percent) vs Soybean Meal previous week (-9.6 percent)
Live Cattle (-6.3 percent) vs Live Cattle previous week (1.2 percent)
Lean Hogs (-3.6 percent) vs Lean Hogs previous week (12.3 percent)
Cotton (5.7 percent) vs Cotton previous week (4.4 percent)
Cocoa (-11.1 percent) vs Cocoa previous week (-7.8 percent)
Wheat (32.3 percent) vs Wheat previous week (25.5 percent)
Individual Soft Commodities Markets:
CORN Futures:
 The CORN large speculator standing this week totaled a net position of -133,883 contracts in the data reported through Tuesday. This was a weekly reduction of -4,426 contracts from the previous week which had a total of -129,457 net contracts.
This week’s current strength score (the trader positioning range over the past three years, measured from 0 to 100) shows the speculators are currently Bearish-Extreme with a score of 18.0 percent. The commercials are Bullish-Extreme with a score of 82.3 percent and the small traders (not shown in chart) are Bullish with a score of 69.7 percent.
Price Trend-Following Model: Strong Downtrend
Our weekly trend-following model classifies the current market price position as: Strong Downtrend.
| CORN Futures Statistics | SPECULATORS | COMMERCIALS | SMALL TRADERS |
| – Percent of Open Interest Longs: | 19.4 | 43.7 | 9.4 |
| – Percent of Open Interest Shorts: | 28.3 | 32.6 | 11.6 |
| – Net Position: | -133,883 | 165,523 | -31,640 |
| – Gross Longs: | 289,307 | 652,507 | 141,014 |
| – Gross Shorts: | 423,190 | 486,984 | 172,654 |
| – Long to Short Ratio: | 0.7 to 1 | 1.3 to 1 | 0.8 to 1 |
| NET POSITION TREND: | |||
| – Strength Index Score (3 Year Range Pct): | 18.0 | 82.3 | 69.7 |
| – Strength Index Reading (3 Year Range): | Bearish-Extreme | Bullish-Extreme | Bullish |
| NET POSITION MOVEMENT INDEX: | |||
| – 6-Week Change in Strength Index: | -5.2 | 7.7 | -14.7 |
SUGAR Futures:
 The SUGAR large speculator standing this week totaled a net position of -59,729 contracts in the data reported through Tuesday. This was a weekly fall of -7,630 contracts from the previous week which had a total of -52,099 net contracts.
This week’s current strength score (the trader positioning range over the past three years, measured from 0 to 100) shows the speculators are currently Bearish-Extreme with a score of 2.1 percent. The commercials are Bullish-Extreme with a score of 99.0 percent and the small traders (not shown in chart) are Bearish-Extreme with a score of 3.8 percent.
Price Trend-Following Model: Downtrend
Our weekly trend-following model classifies the current market price position as: Downtrend.
| SUGAR Futures Statistics | SPECULATORS | COMMERCIALS | SMALL TRADERS |
| – Percent of Open Interest Longs: | 22.9 | 53.1 | 7.2 |
| – Percent of Open Interest Shorts: | 29.8 | 44.8 | 8.6 |
| – Net Position: | -59,729 | 72,031 | -12,302 |
| – Gross Longs: | 198,761 | 460,209 | 62,484 |
| – Gross Shorts: | 258,490 | 388,178 | 74,786 |
| – Long to Short Ratio: | 0.8 to 1 | 1.2 to 1 | 0.8 to 1 |
| NET POSITION TREND: | |||
| – Strength Index Score (3 Year Range Pct): | 2.1 | 99.0 | 3.8 |
| – Strength Index Reading (3 Year Range): | Bearish-Extreme | Bullish-Extreme | Bearish-Extreme |
| NET POSITION MOVEMENT INDEX: | |||
| – 6-Week Change in Strength Index: | -11.6 | 11.1 | -7.5 |
COFFEE Futures:
 The COFFEE large speculator standing this week totaled a net position of 31,117 contracts in the data reported through Tuesday. This was a weekly decline of -16 contracts from the previous week which had a total of 31,133 net contracts.
This week’s current strength score (the trader positioning range over the past three years, measured from 0 to 100) shows the speculators are currently Bullish with a score of 56.0 percent. The commercials are Bearish with a score of 46.6 percent and the small traders (not shown in chart) are Bearish with a score of 29.6 percent.
Price Trend-Following Model: Strong Downtrend
Our weekly trend-following model classifies the current market price position as: Strong Downtrend.
| COFFEE Futures Statistics | SPECULATORS | COMMERCIALS | SMALL TRADERS |
| – Percent of Open Interest Longs: | 32.5 | 41.1 | 4.5 |
| – Percent of Open Interest Shorts: | 12.2 | 61.9 | 4.1 |
| – Net Position: | 31,117 | -31,817 | 700 |
| – Gross Longs: | 49,722 | 62,781 | 6,915 |
| – Gross Shorts: | 18,605 | 94,598 | 6,215 |
| – Long to Short Ratio: | 2.7 to 1 | 0.7 to 1 | 1.1 to 1 |
| NET POSITION TREND: | |||
| – Strength Index Score (3 Year Range Pct): | 56.0 | 46.6 | 29.6 |
| – Strength Index Reading (3 Year Range): | Bullish | Bearish | Bearish |
| NET POSITION MOVEMENT INDEX: | |||
| – 6-Week Change in Strength Index: | -6.0 | 7.6 | -31.2 |
SOYBEANS Futures:
 The SOYBEANS large speculator standing this week totaled a net position of 36,033 contracts in the data reported through Tuesday. This was a weekly increase of 20,739 contracts from the previous week which had a total of 15,294 net contracts.
This week’s current strength score (the trader positioning range over the past three years, measured from 0 to 100) shows the speculators are currently Bullish with a score of 59.7 percent. The commercials are Bearish with a score of 39.1 percent and the small traders (not shown in chart) are Bullish with a score of 66.5 percent.
Price Trend-Following Model: Uptrend
Our weekly trend-following model classifies the current market price position as: Uptrend.
| SOYBEANS Futures Statistics | SPECULATORS | COMMERCIALS | SMALL TRADERS |
| – Percent of Open Interest Longs: | 20.3 | 52.0 | 5.1 |
| – Percent of Open Interest Shorts: | 16.3 | 54.0 | 7.0 |
| – Net Position: | 36,033 | -18,411 | -17,622 |
| – Gross Longs: | 182,121 | 466,698 | 45,428 |
| – Gross Shorts: | 146,088 | 485,109 | 63,050 |
| – Long to Short Ratio: | 1.2 to 1 | 1.0 to 1 | 0.7 to 1 |
| NET POSITION TREND: | |||
| – Strength Index Score (3 Year Range Pct): | 59.7 | 39.1 | 66.5 |
| – Strength Index Reading (3 Year Range): | Bullish | Bearish | Bullish |
| NET POSITION MOVEMENT INDEX: | |||
| – 6-Week Change in Strength Index: | -8.8 | 10.7 | -13.9 |
SOYBEAN OIL Futures:
 The SOYBEAN OIL large speculator standing this week totaled a net position of 76,514 contracts in the data reported through Tuesday. This was a weekly boost of 12,389 contracts from the previous week which had a total of 64,125 net contracts.
This week’s current strength score (the trader positioning range over the past three years, measured from 0 to 100) shows the speculators are currently Bullish-Extreme with a score of 84.1 percent. The commercials are Bearish-Extreme with a score of 15.7 percent and the small traders (not shown in chart) are Bullish-Extreme with a score of 89.9 percent.
Price Trend-Following Model: Strong Uptrend
Our weekly trend-following model classifies the current market price position as: Strong Uptrend.
| SOYBEAN OIL Futures Statistics | SPECULATORS | COMMERCIALS | SMALL TRADERS |
| – Percent of Open Interest Longs: | 22.7 | 45.1 | 6.3 |
| – Percent of Open Interest Shorts: | 10.6 | 59.3 | 4.2 |
| – Net Position: | 76,514 | -90,090 | 13,576 |
| – Gross Longs: | 143,743 | 285,705 | 39,958 |
| – Gross Shorts: | 67,229 | 375,795 | 26,382 |
| – Long to Short Ratio: | 2.1 to 1 | 0.8 to 1 | 1.5 to 1 |
| NET POSITION TREND: | |||
| – Strength Index Score (3 Year Range Pct): | 84.1 | 15.7 | 89.9 |
| – Strength Index Reading (3 Year Range): | Bullish-Extreme | Bearish-Extreme | Bullish-Extreme |
| NET POSITION MOVEMENT INDEX: | |||
| – 6-Week Change in Strength Index: | 19.5 | -22.0 | 40.7 |
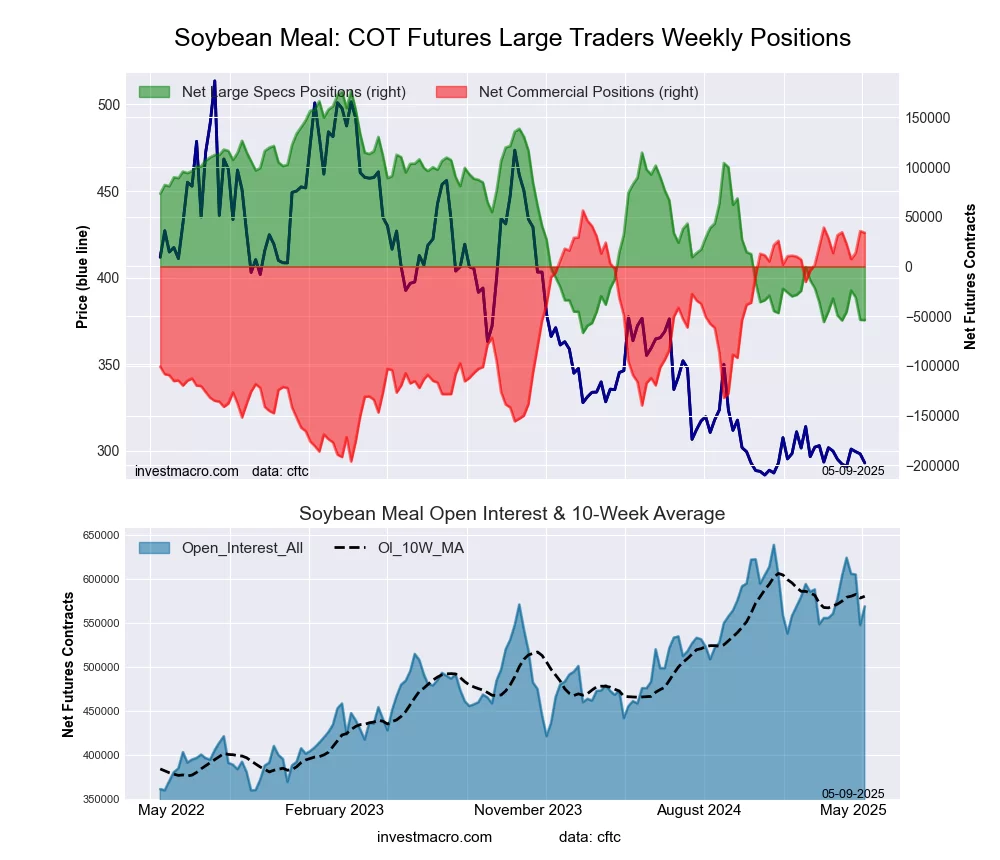
SOYBEAN MEAL Futures:
 The SOYBEAN MEAL large speculator standing this week totaled a net position of -73,578 contracts in the data reported through Tuesday. This was a weekly rise of 6,164 contracts from the previous week which had a total of -79,742 net contracts.
This week’s current strength score (the trader positioning range over the past three years, measured from 0 to 100) shows the speculators are currently Bearish-Extreme with a score of 5.0 percent. The commercials are Bullish-Extreme with a score of 96.3 percent and the small traders (not shown in chart) are Bullish with a score of 60.9 percent.
Price Trend-Following Model: Strong Downtrend
Our weekly trend-following model classifies the current market price position as: Strong Downtrend.
| SOYBEAN MEAL Futures Statistics | SPECULATORS | COMMERCIALS | SMALL TRADERS |
| – Percent of Open Interest Longs: | 18.7 | 49.8 | 8.4 |
| – Percent of Open Interest Shorts: | 29.5 | 42.1 | 5.3 |
| – Net Position: | -73,578 | 52,672 | 20,906 |
| – Gross Longs: | 127,091 | 339,118 | 57,005 |
| – Gross Shorts: | 200,669 | 286,446 | 36,099 |
| – Long to Short Ratio: | 0.6 to 1 | 1.2 to 1 | 1.6 to 1 |
| NET POSITION TREND: | |||
| – Strength Index Score (3 Year Range Pct): | 5.0 | 96.3 | 60.9 |
| – Strength Index Reading (3 Year Range): | Bearish-Extreme | Bullish-Extreme | Bullish |
| NET POSITION MOVEMENT INDEX: | |||
| – 6-Week Change in Strength Index: | -9.7 | 10.0 | -1.7 |
LIVE CATTLE Futures:
 The LIVE CATTLE large speculator standing this week totaled a net position of 108,858 contracts in the data reported through Tuesday. This was a weekly gain of 4,413 contracts from the previous week which had a total of 104,445 net contracts.
This week’s current strength score (the trader positioning range over the past three years, measured from 0 to 100) shows the speculators are currently Bullish-Extreme with a score of 85.3 percent. The commercials are Bearish-Extreme with a score of 17.5 percent and the small traders (not shown in chart) are Bearish-Extreme with a score of 17.0 percent.
Price Trend-Following Model: Strong Uptrend
Our weekly trend-following model classifies the current market price position as: Strong Uptrend.
| LIVE CATTLE Futures Statistics | SPECULATORS | COMMERCIALS | SMALL TRADERS |
| – Percent of Open Interest Longs: | 49.2 | 28.3 | 7.7 |
| – Percent of Open Interest Shorts: | 22.2 | 49.6 | 13.3 |
| – Net Position: | 108,858 | -86,017 | -22,841 |
| – Gross Longs: | 198,499 | 114,349 | 30,934 |
| – Gross Shorts: | 89,641 | 200,366 | 53,775 |
| – Long to Short Ratio: | 2.2 to 1 | 0.6 to 1 | 0.6 to 1 |
| NET POSITION TREND: | |||
| – Strength Index Score (3 Year Range Pct): | 85.3 | 17.5 | 17.0 |
| – Strength Index Reading (3 Year Range): | Bullish-Extreme | Bearish-Extreme | Bearish-Extreme |
| NET POSITION MOVEMENT INDEX: | |||
| – 6-Week Change in Strength Index: | -6.3 | 10.2 | -7.2 |
LEAN HOGS Futures:
 The LEAN HOGS large speculator standing this week totaled a net position of 75,180 contracts in the data reported through Tuesday. This was a weekly lowering of -7,623 contracts from the previous week which had a total of 82,803 net contracts.
This week’s current strength score (the trader positioning range over the past three years, measured from 0 to 100) shows the speculators are currently Bullish-Extreme with a score of 84.1 percent. The commercials are Bearish-Extreme with a score of 15.3 percent and the small traders (not shown in chart) are Bearish with a score of 48.4 percent.
Price Trend-Following Model: Uptrend
Our weekly trend-following model classifies the current market price position as: Uptrend.
| LEAN HOGS Futures Statistics | SPECULATORS | COMMERCIALS | SMALL TRADERS |
| – Percent of Open Interest Longs: | 44.8 | 29.3 | 6.2 |
| – Percent of Open Interest Shorts: | 22.3 | 50.4 | 7.7 |
| – Net Position: | 75,180 | -70,335 | -4,845 |
| – Gross Longs: | 149,577 | 97,909 | 20,708 |
| – Gross Shorts: | 74,397 | 168,244 | 25,553 |
| – Long to Short Ratio: | 2.0 to 1 | 0.6 to 1 | 0.8 to 1 |
| NET POSITION TREND: | |||
| – Strength Index Score (3 Year Range Pct): | 84.1 | 15.3 | 48.4 |
| – Strength Index Reading (3 Year Range): | Bullish-Extreme | Bearish-Extreme | Bearish |
| NET POSITION MOVEMENT INDEX: | |||
| – 6-Week Change in Strength Index: | -3.6 | 4.3 | -3.4 |
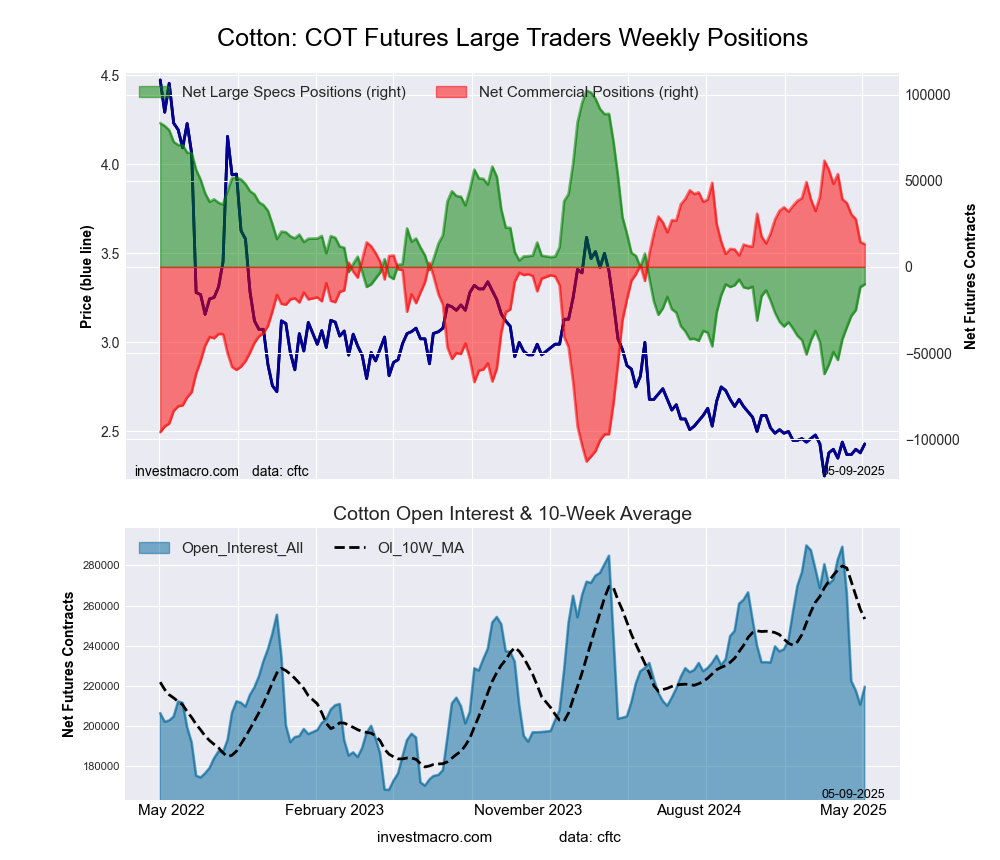
COTTON Futures:
 The COTTON large speculator standing this week totaled a net position of -27,250 contracts in the data reported through Tuesday. This was a weekly reduction of -2,167 contracts from the previous week which had a total of -25,083 net contracts.
This week’s current strength score (the trader positioning range over the past three years, measured from 0 to 100) shows the speculators are currently Bearish with a score of 21.2 percent. The commercials are Bullish-Extreme with a score of 80.1 percent and the small traders (not shown in chart) are Bearish with a score of 24.7 percent.
Price Trend-Following Model: Downtrend
Our weekly trend-following model classifies the current market price position as: Downtrend.
| COTTON Futures Statistics | SPECULATORS | COMMERCIALS | SMALL TRADERS |
| – Percent of Open Interest Longs: | 29.4 | 47.7 | 5.1 |
| – Percent of Open Interest Shorts: | 41.8 | 35.4 | 5.0 |
| – Net Position: | -27,250 | 26,936 | 314 |
| – Gross Longs: | 64,278 | 104,381 | 11,166 |
| – Gross Shorts: | 91,528 | 77,445 | 10,852 |
| – Long to Short Ratio: | 0.7 to 1 | 1.3 to 1 | 1.0 to 1 |
| NET POSITION TREND: | |||
| – Strength Index Score (3 Year Range Pct): | 21.2 | 80.1 | 24.7 |
| – Strength Index Reading (3 Year Range): | Bearish | Bullish-Extreme | Bearish |
| NET POSITION MOVEMENT INDEX: | |||
| – 6-Week Change in Strength Index: | 5.7 | -5.7 | 4.2 |
COCOA Futures:
 The COCOA large speculator standing this week totaled a net position of 8,332 contracts in the data reported through Tuesday. This was a weekly decrease of -3,491 contracts from the previous week which had a total of 11,823 net contracts.
This week’s current strength score (the trader positioning range over the past three years, measured from 0 to 100) shows the speculators are currently Bearish-Extreme with a score of 18.5 percent. The commercials are Bullish-Extreme with a score of 81.4 percent and the small traders (not shown in chart) are Bullish with a score of 59.3 percent.
Price Trend-Following Model: Strong Uptrend
Our weekly trend-following model classifies the current market price position as: Strong Uptrend.
| COCOA Futures Statistics | SPECULATORS | COMMERCIALS | SMALL TRADERS |
| – Percent of Open Interest Longs: | 25.4 | 42.4 | 11.1 |
| – Percent of Open Interest Shorts: | 16.4 | 55.5 | 6.9 |
| – Net Position: | 8,332 | -12,272 | 3,940 |
| – Gross Longs: | 23,631 | 39,492 | 10,378 |
| – Gross Shorts: | 15,299 | 51,764 | 6,438 |
| – Long to Short Ratio: | 1.5 to 1 | 0.8 to 1 | 1.6 to 1 |
| NET POSITION TREND: | |||
| – Strength Index Score (3 Year Range Pct): | 18.5 | 81.4 | 59.3 |
| – Strength Index Reading (3 Year Range): | Bearish-Extreme | Bullish-Extreme | Bullish |
| NET POSITION MOVEMENT INDEX: | |||
| – 6-Week Change in Strength Index: | -11.1 | 13.5 | -24.7 |
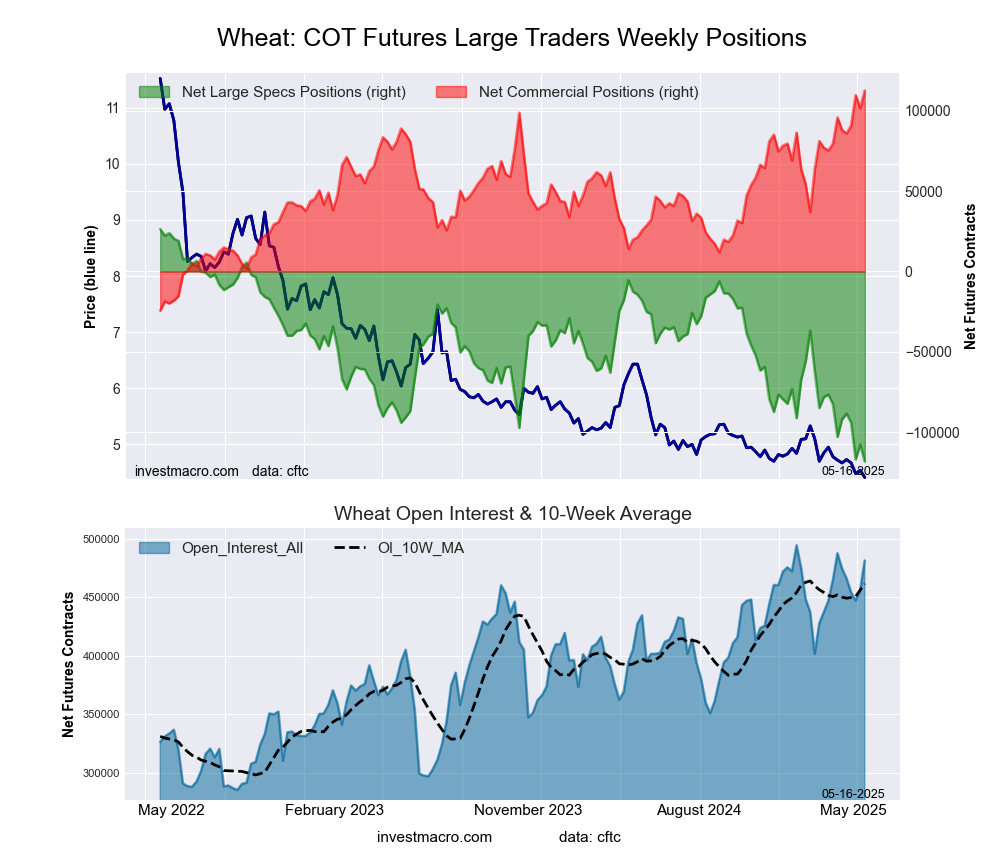
WHEAT Futures:
 The WHEAT large speculator standing this week totaled a net position of -53,909 contracts in the data reported through Tuesday. This was a weekly increase of 11,612 contracts from the previous week which had a total of -65,521 net contracts.
This week’s current strength score (the trader positioning range over the past three years, measured from 0 to 100) shows the speculators are currently Bullish with a score of 51.9 percent. The commercials are Bullish with a score of 52.8 percent and the small traders (not shown in chart) are Bearish with a score of 21.0 percent.
Price Trend-Following Model: Strong Downtrend
Our weekly trend-following model classifies the current market price position as: Strong Downtrend.
| WHEAT Futures Statistics | SPECULATORS | COMMERCIALS | SMALL TRADERS |
| – Percent of Open Interest Longs: | 29.4 | 35.6 | 7.0 |
| – Percent of Open Interest Shorts: | 41.8 | 21.8 | 8.4 |
| – Net Position: | -53,909 | 60,291 | -6,382 |
| – Gross Longs: | 128,140 | 155,132 | 30,392 |
| – Gross Shorts: | 182,049 | 94,841 | 36,774 |
| – Long to Short Ratio: | 0.7 to 1 | 1.6 to 1 | 0.8 to 1 |
| NET POSITION TREND: | |||
| – Strength Index Score (3 Year Range Pct): | 51.9 | 52.8 | 21.0 |
| – Strength Index Reading (3 Year Range): | Bullish | Bullish | Bearish |
| NET POSITION MOVEMENT INDEX: | |||
| – 6-Week Change in Strength Index: | 32.3 | -30.1 | -37.1 |
Article By InvestMacro – Receive our weekly COT Newsletter
*COT Report: The COT data, released weekly to the public each Friday, is updated through the most recent Tuesday (data is 3 days old) and shows a quick view of how large speculators or non-commercials (for-profit traders) were positioned in the futures markets.
The CFTC categorizes trader positions according to commercial hedgers (traders who use futures contracts for hedging as part of the business), non-commercials (large traders who speculate to realize trading profits) and nonreportable traders (usually small traders/speculators) as well as their open interest (contracts open in the market at time of reporting). See CFTC criteria here.