By InvestMacro

Here are the latest charts and statistics for the Commitment of Traders (COT) reports data published by the Commodities Futures Trading Commission (CFTC).
The latest COT data is updated through Tuesday April 22nd and shows a quick view of how large traders (for-profit speculators and commercial entities) were positioned in the futures markets.
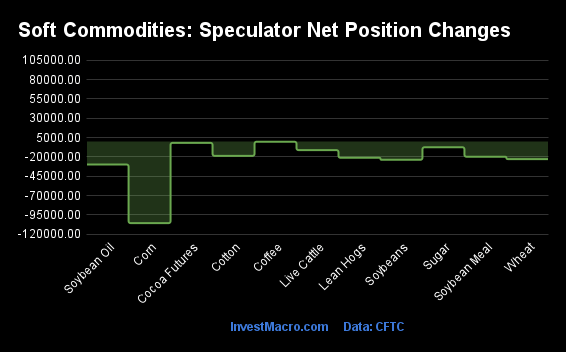
Weekly Speculator Changes led by Lean Hogs & Live Cattle

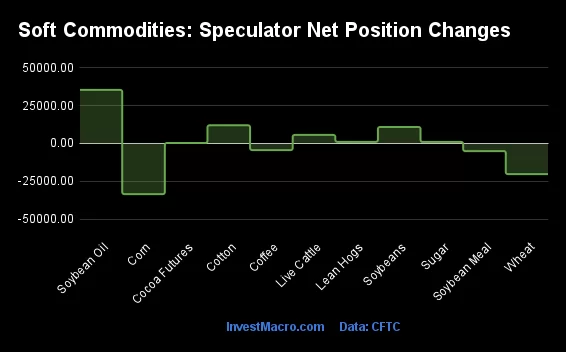
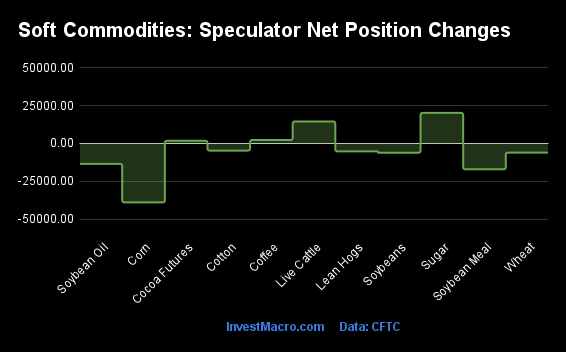
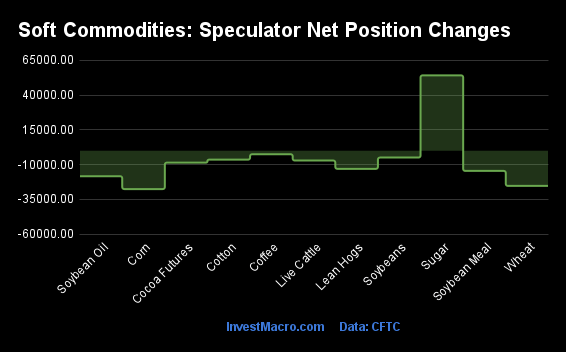
The COT soft commodities markets speculator bets were higher this week as eight out of the eleven softs markets we cover had higher positioning while the other three markets had lower speculator contracts.
Leading the gains for the softs markets was Lean Hogs (13,275 contracts) with Live Cattle (7,421 contracts), Soybeans (5,523 contracts), Soybean Oil (4,796 contracts), Sugar (3,421 contracts), Cotton (3,378 contracts), Coffee (1,122 contracts) and Cocoa (966 contracts) also showing positive weeks.
The markets with the declines in speculator bets this week were Corn (-14,339 contracts), Soybean Meal (-6,840 contracts) and with Wheat (-5,643 contracts) also registering lower bets on the week.
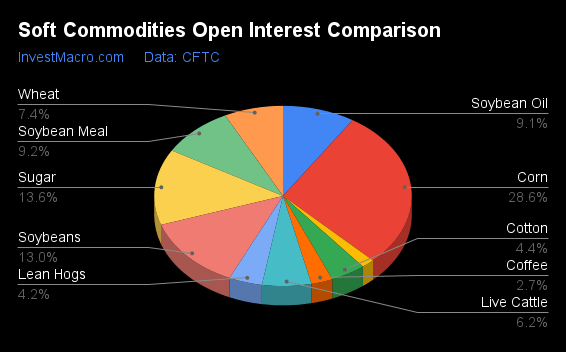
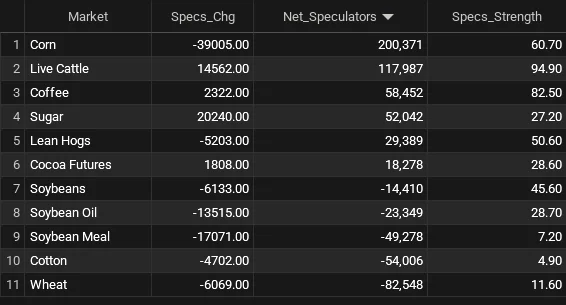
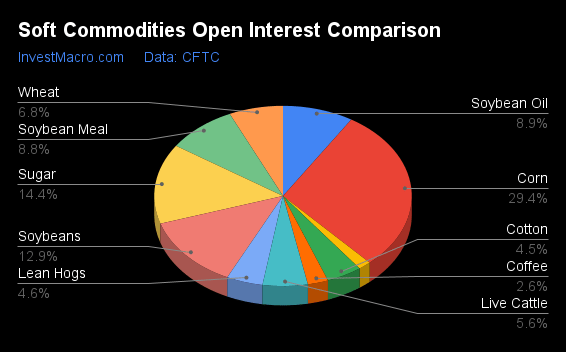
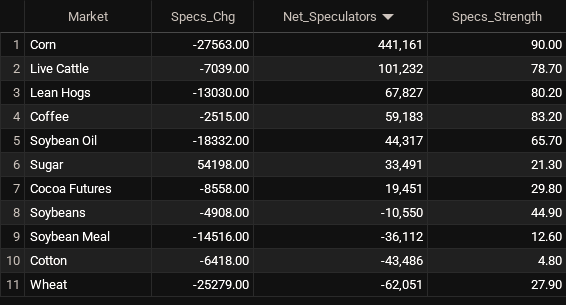
Soft Commodities Data:
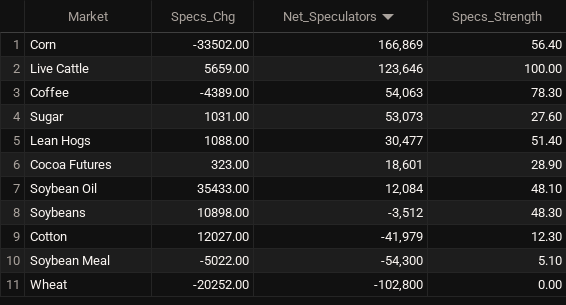
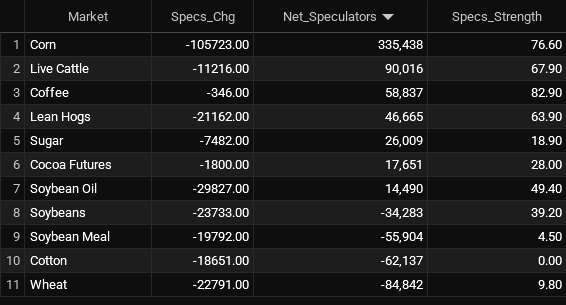
 Legend: Weekly Speculators Change | Speculators Current Net Position | Speculators Strength Score compared to last 3-Years (0-100 range)
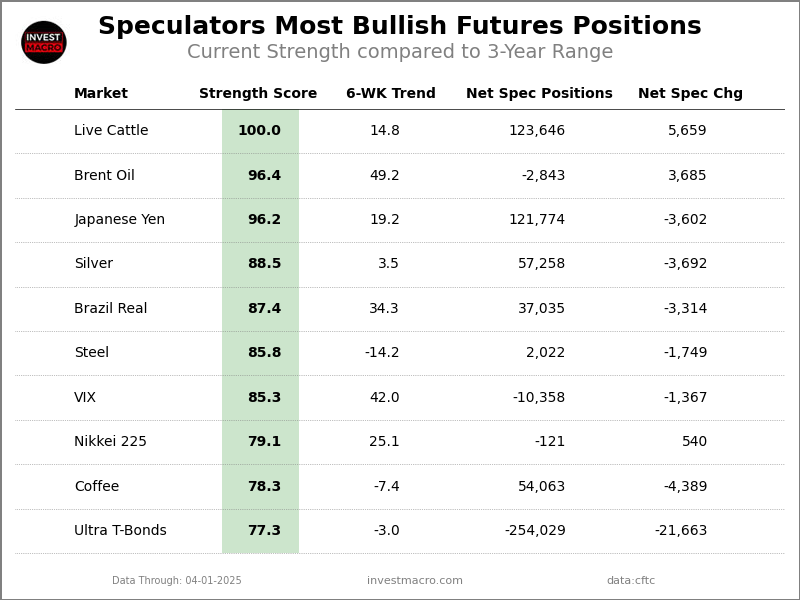
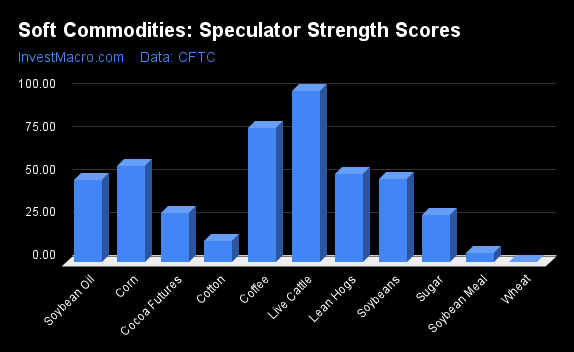
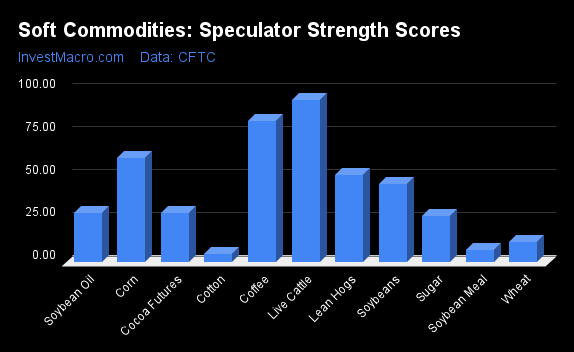
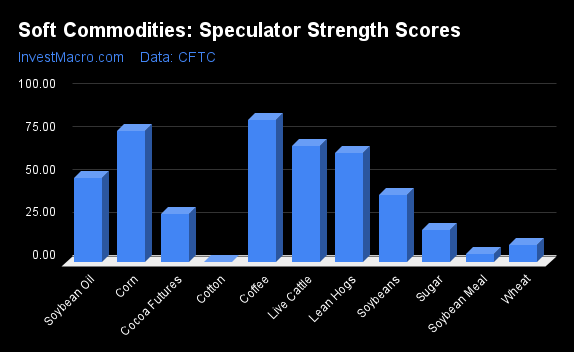
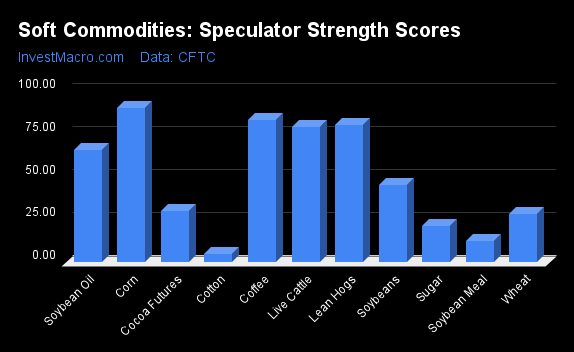
Strength Scores led by Live Cattle & Soybean Oil
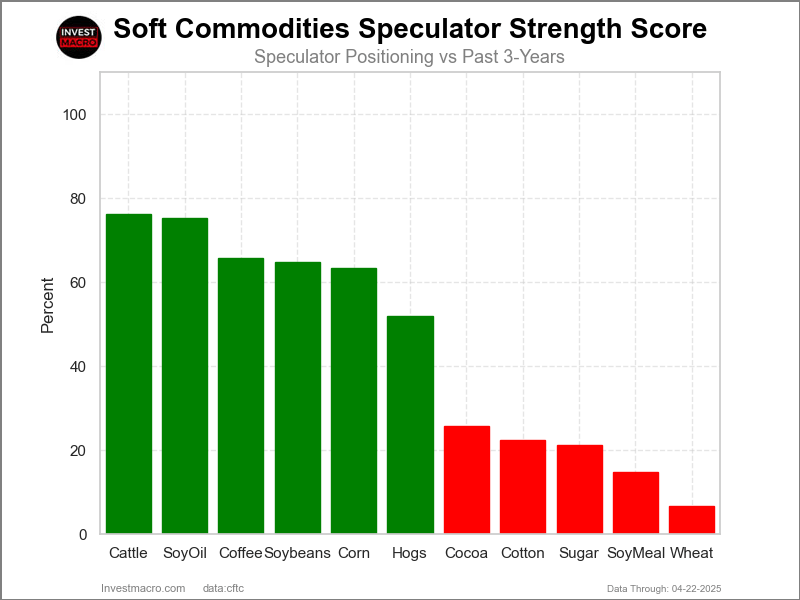
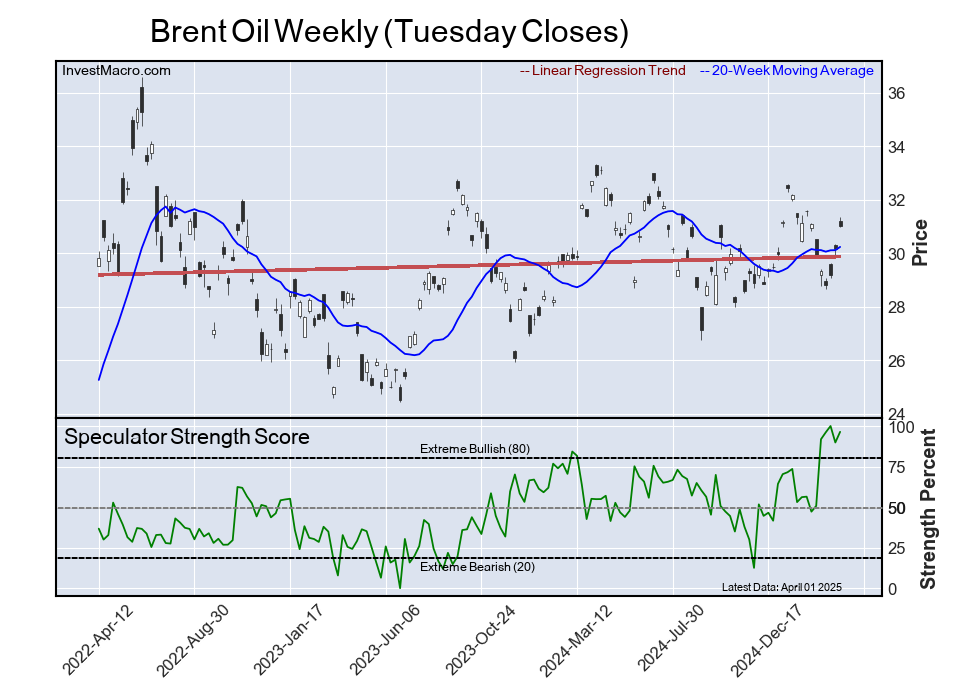
COT Strength Scores (a normalized measure of Speculator positions over a 3-Year range, from 0 to 100 where above 80 is Extreme-Bullish and below 20 is Extreme-Bearish) showed that Live Cattle (76 percent) and Soybean Oil (75 percent) lead the softs markets this week. Coffee (66 percent), Soybeans (65 percent) and Corn (63 percent) come in as the next highest in the weekly strength scores.
On the downside, Wheat (7 percent) and Soybean Meal (15 percent) come in at the lowest strength levels currently and are in Extreme-Bearish territory (below 20 percent). The next lowest strength scores were Sugar (21 percent) and Cotton (23 percent).
Strength Statistics:
Corn (63.3 percent) vs Corn previous week (65.1 percent)
Sugar (21.2 percent) vs Sugar previous week (20.1 percent)
Coffee (65.7 percent) vs Coffee previous week (64.6 percent)
Soybeans (64.8 percent) vs Soybeans previous week (63.4 percent)
Soybean Oil (75.2 percent) vs Soybean Oil previous week (72.6 percent)
Soybean Meal (14.7 percent) vs Soybean Meal previous week (17.5 percent)
Live Cattle (76.3 percent) vs Live Cattle previous week (69.2 percent)
Lean Hogs (52.0 percent) vs Lean Hogs previous week (41.8 percent)
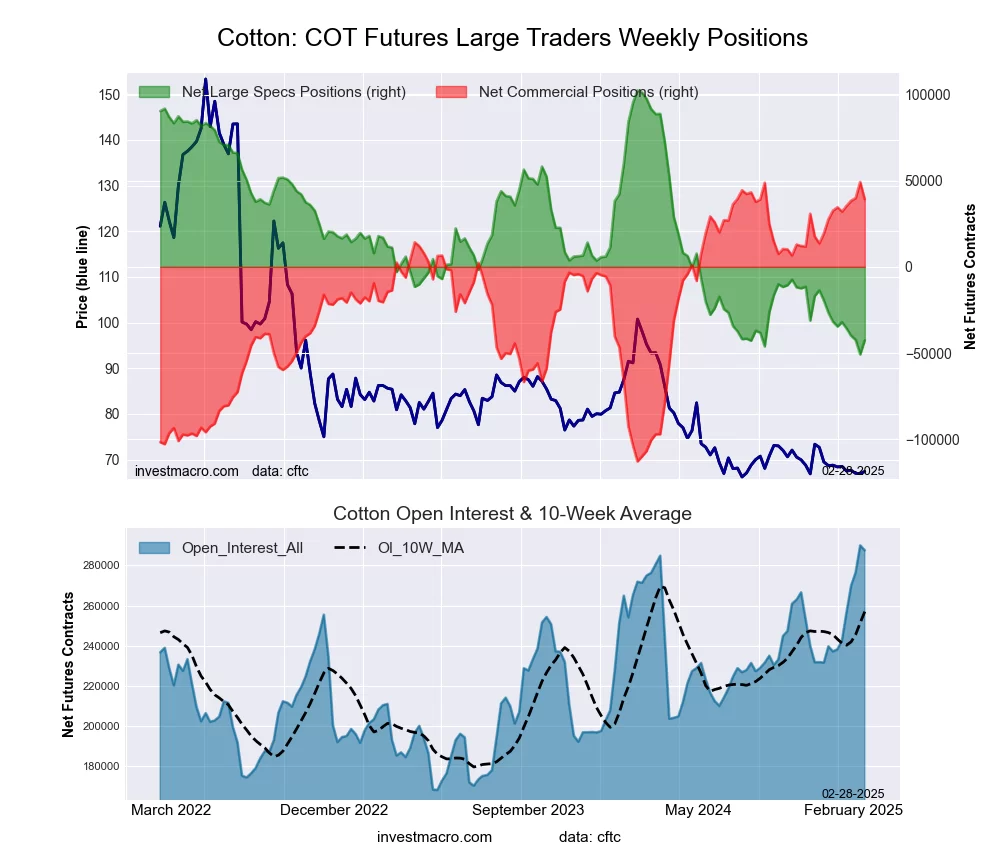
Cotton (22.5 percent) vs Cotton previous week (20.5 percent)
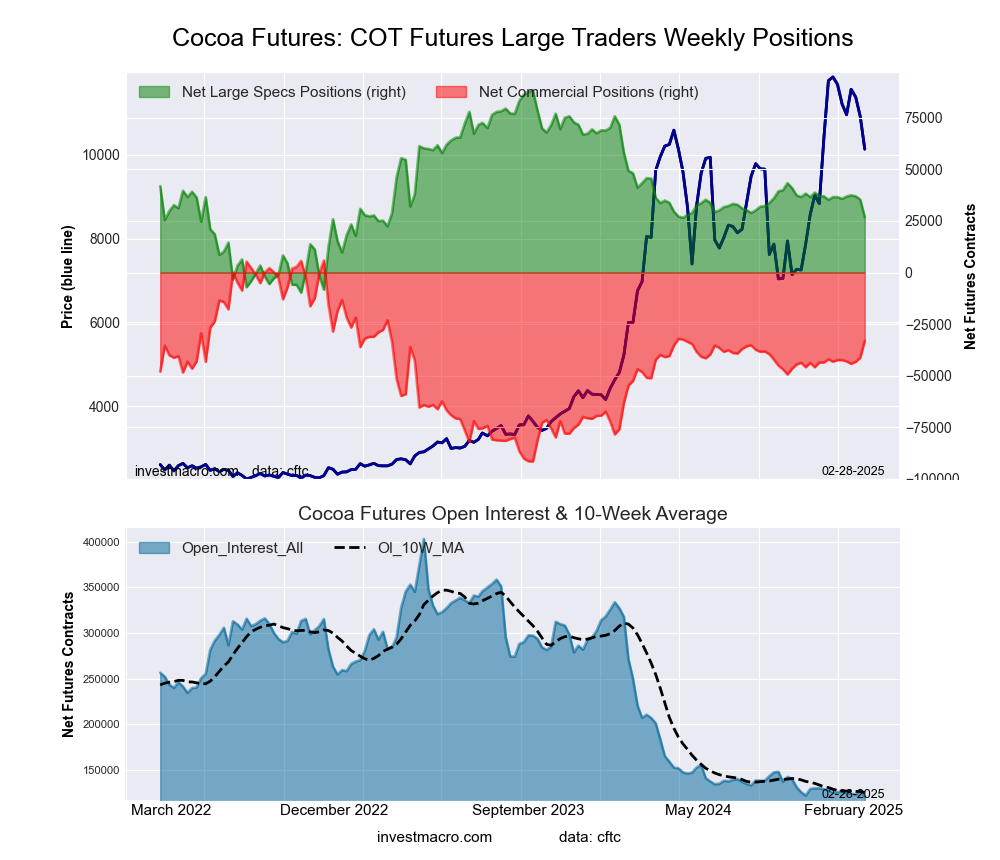
Cocoa (25.8 percent) vs Cocoa previous week (24.9 percent)
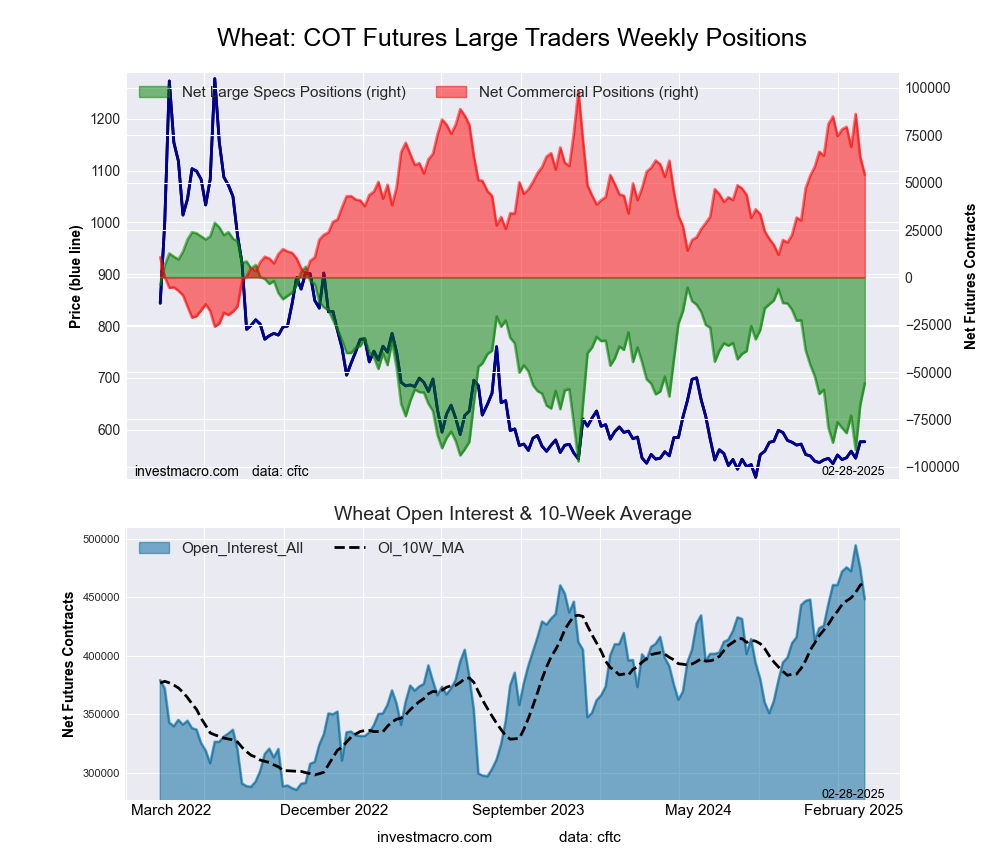
Wheat (6.7 percent) vs Wheat previous week (11.0 percent)
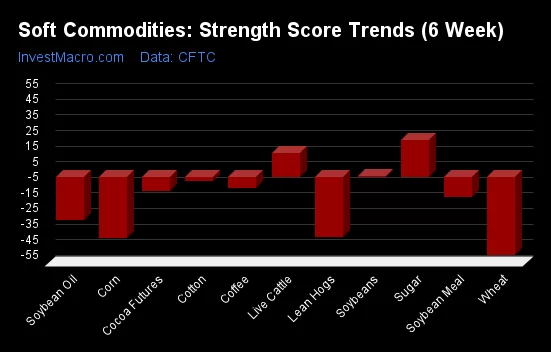
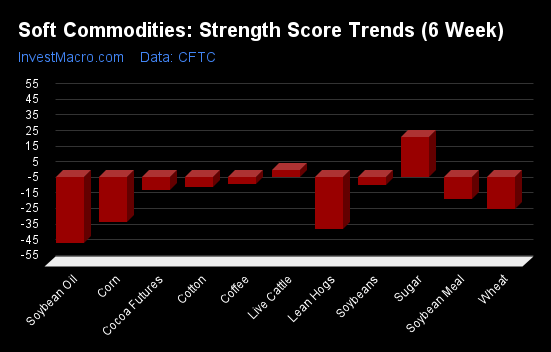
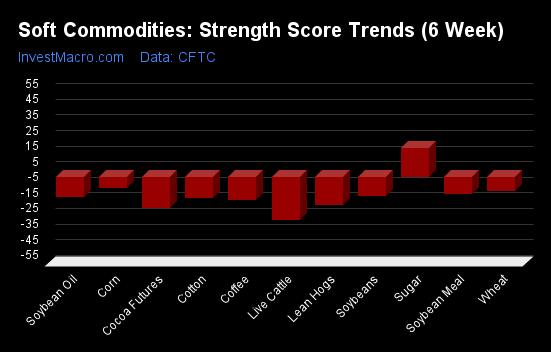
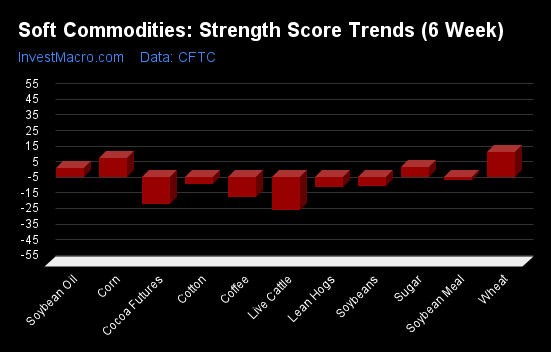
Soybean Oil & Cotton top the 6-Week Strength Trends
 COT Strength Score Trends (or move index, calculates the 6-week changes in strength scores) showed that Soybean Oil (34 percent) and Cotton (19 percent) lead the past six weeks trends for soft commodities. Soybeans (17 percent), Sugar (8 percent) and Soybean Meal (6 percent) are the next highest positive movers in the latest trends data.
Coffee (-15 percent) leads the downside trend scores currently with Wheat (-12 percent), Corn (-6 percent) and Lean Hogs (-5 percent) following next with lower trend scores.
Strength Trend Statistics:
Corn (-6.3 percent) vs Corn previous week (-13.2 percent)
Sugar (7.8 percent) vs Sugar previous week (1.2 percent)
Coffee (-14.9 percent) vs Coffee previous week (-18.3 percent)
Soybeans (17.4 percent) vs Soybeans previous week (21.6 percent)
Soybean Oil (34.2 percent) vs Soybean Oil previous week (22.7 percent)
Soybean Meal (5.8 percent) vs Soybean Meal previous week (13.0 percent)
Live Cattle (1.6 percent) vs Live Cattle previous week (1.5 percent)
Lean Hogs (-5.3 percent) vs Lean Hogs previous week (-22.1 percent)
Cotton (19.2 percent) vs Cotton previous week (20.5 percent)
Cocoa (-1.8 percent) vs Cocoa previous week (-3.1 percent)
Wheat (-12.1 percent) vs Wheat previous week (-2.6 percent)
Individual Soft Commodities Markets:
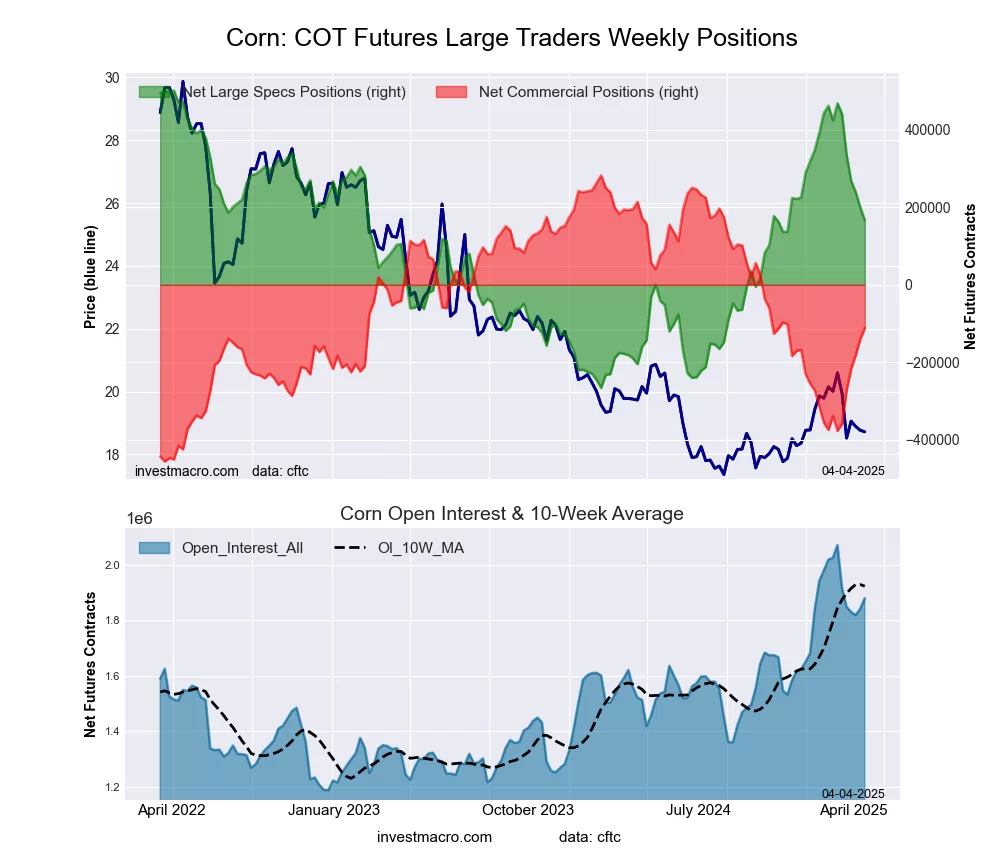
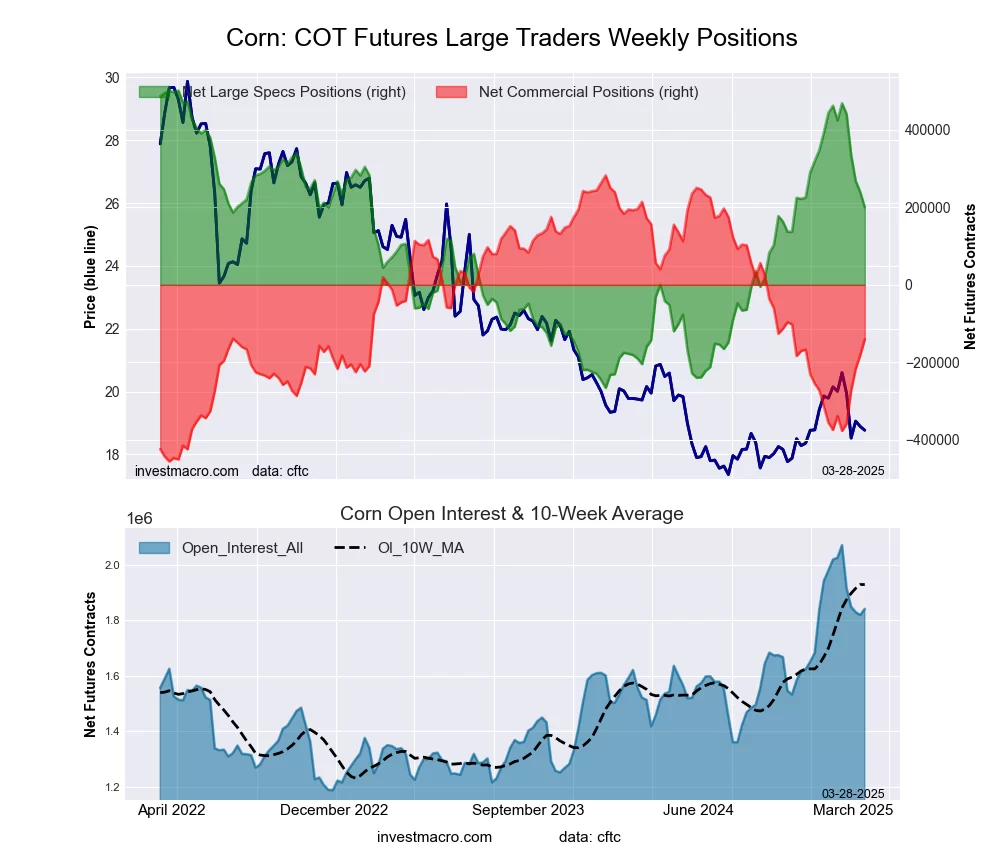
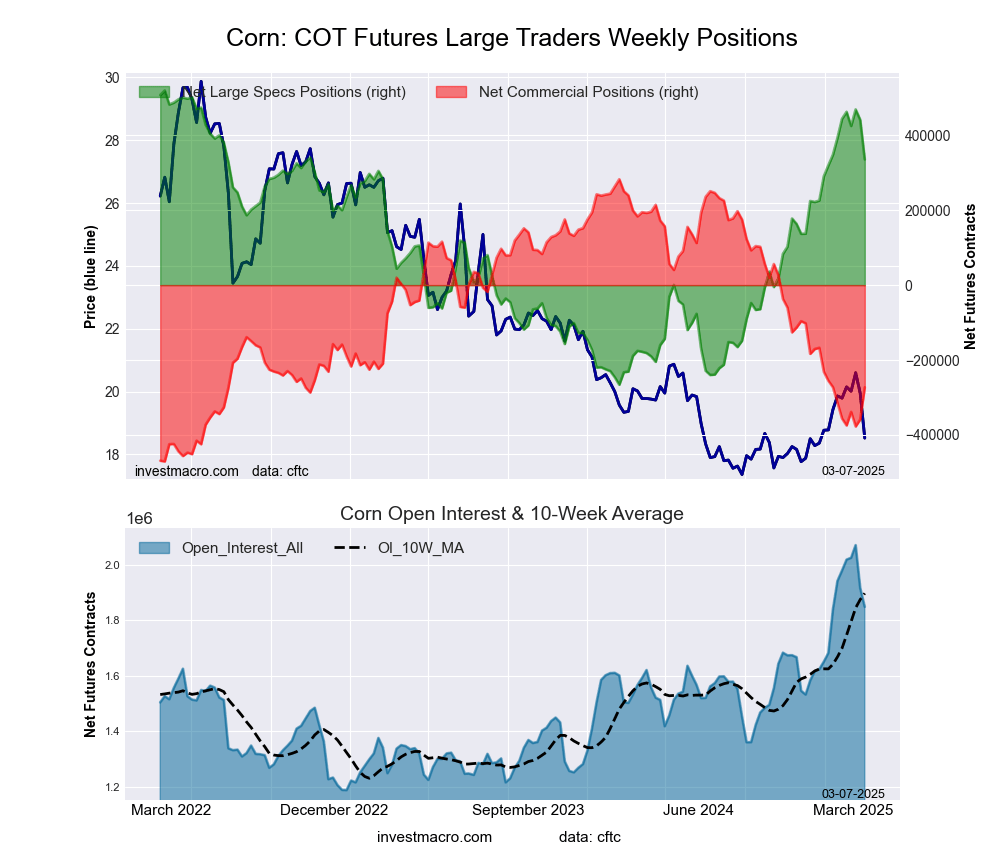
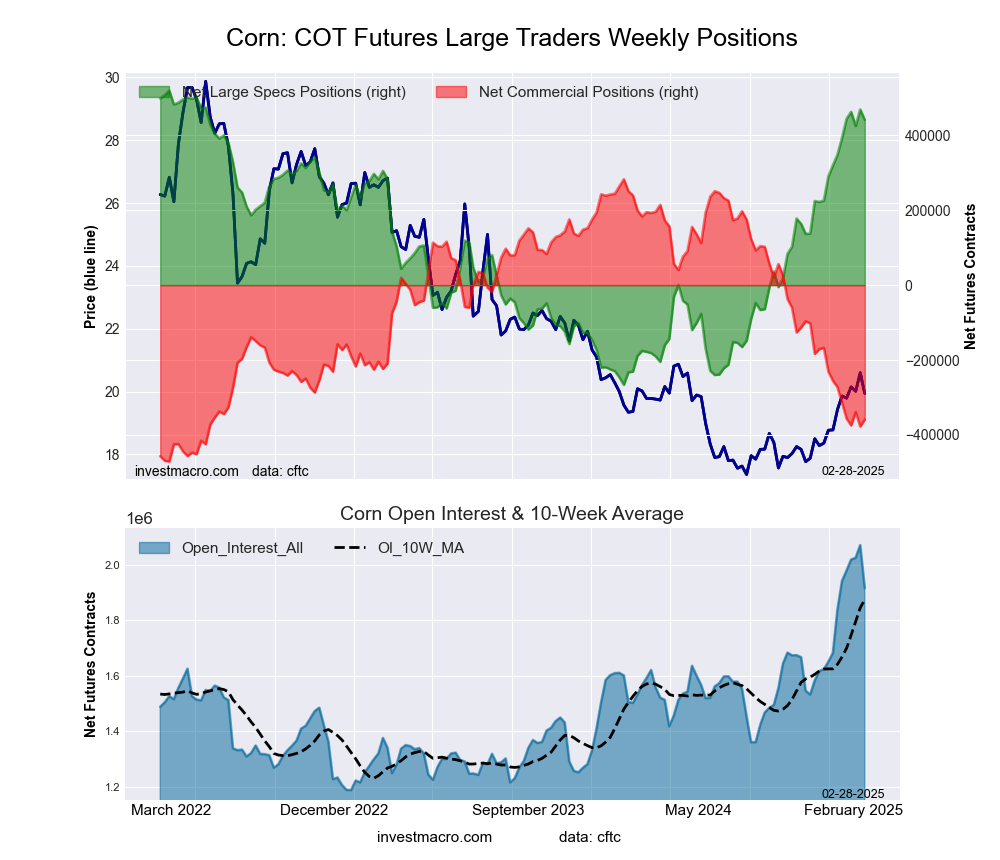
CORN Futures:
 The CORN large speculator standing this week was a net position of 219,843 contracts in the data reported through Tuesday. This was a weekly fall of -14,339 contracts from the previous week which had a total of 234,182 net contracts.
This week’s current strength score (the trader positioning range over the past three years, measured from 0 to 100) shows the speculators are currently Bullish with a score of 63.3 percent. The commercials are Bearish with a score of 39.5 percent and the small traders (not shown in chart) are Bearish with a score of 38.6 percent.
Price Trend-Following Model: Weak Uptrend
Our weekly trend-following model classifies the current market price position as: Weak Uptrend.
| CORN Futures Statistics | SPECULATORS | COMMERCIALS | SMALL TRADERS |
| – Percent of Open Interest Longs: | 26.4 | 45.3 | 7.1 |
| – Percent of Open Interest Shorts: | 13.5 | 54.8 | 10.5 |
| – Net Position: | 219,843 | -161,479 | -58,364 |
| – Gross Longs: | 450,712 | 773,840 | 121,656 |
| – Gross Shorts: | 230,869 | 935,319 | 180,020 |
| – Long to Short Ratio: | 2.0 to 1 | 0.8 to 1 | 0.7 to 1 |
| NET POSITION TREND: | |||
| – Strength Index Score (3 Year Range Pct): | 63.3 | 39.5 | 38.6 |
| – Strength Index Reading (3 Year Range): | Bullish | Bearish | Bearish |
| NET POSITION MOVEMENT INDEX: | |||
| – 6-Week Change in Strength Index: | -6.3 | 7.5 | -7.8 |
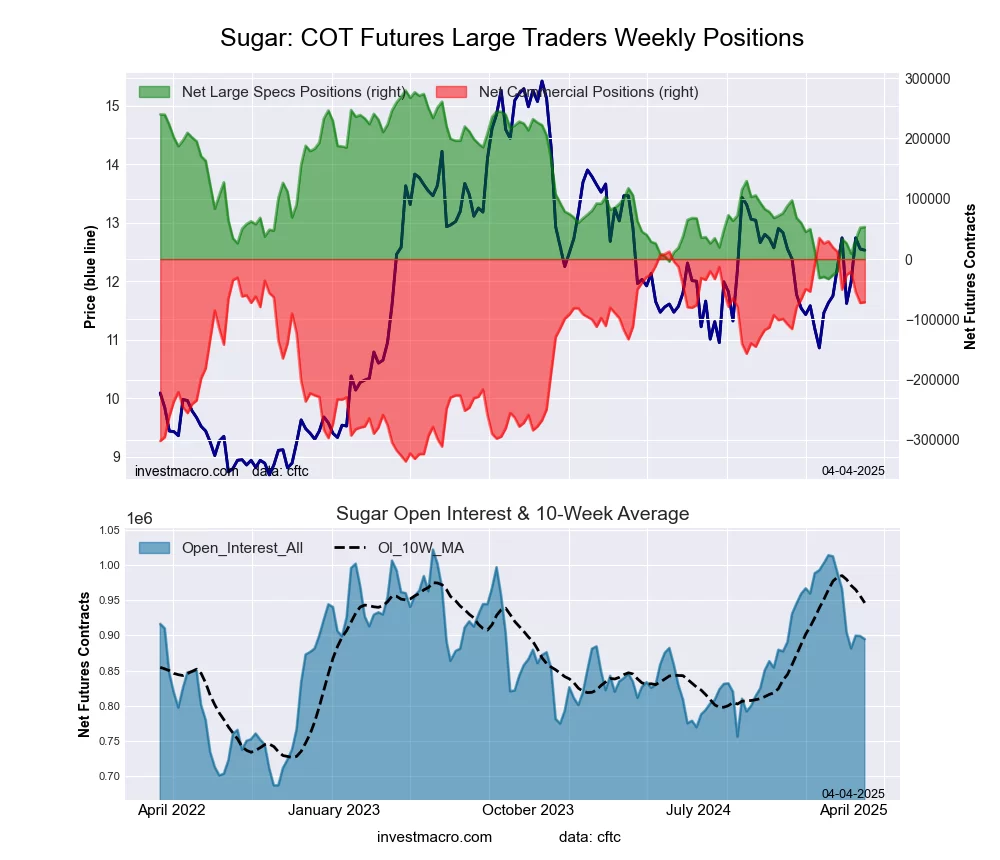
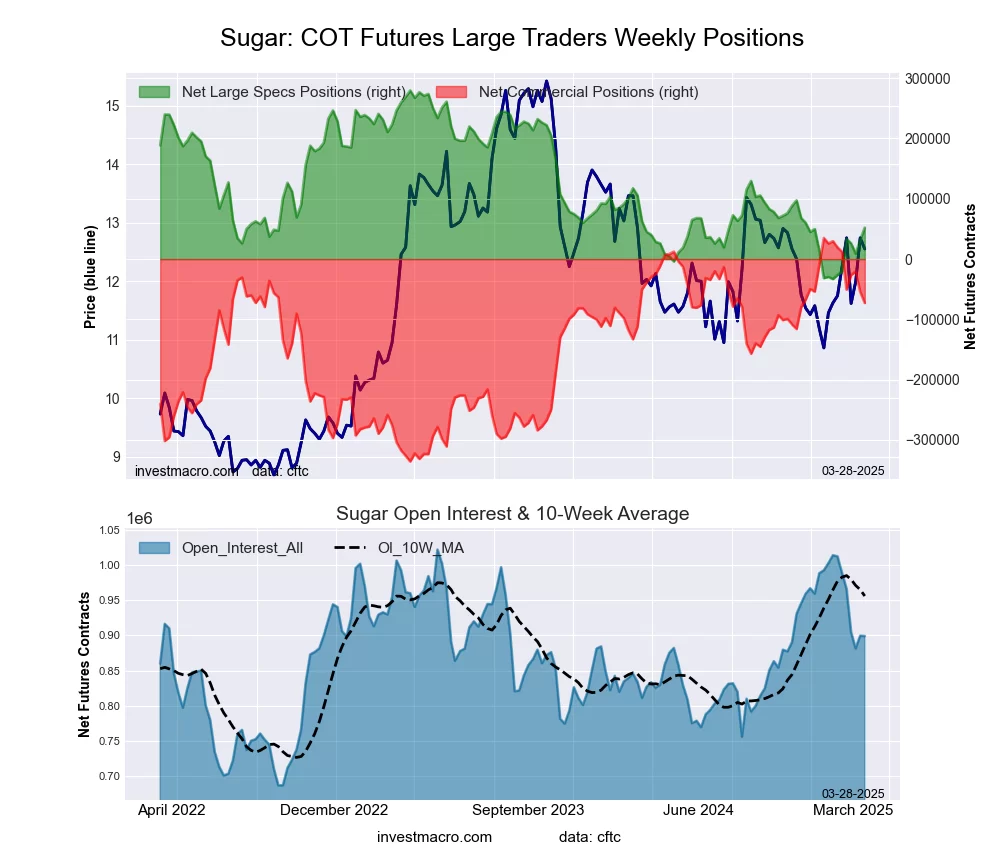
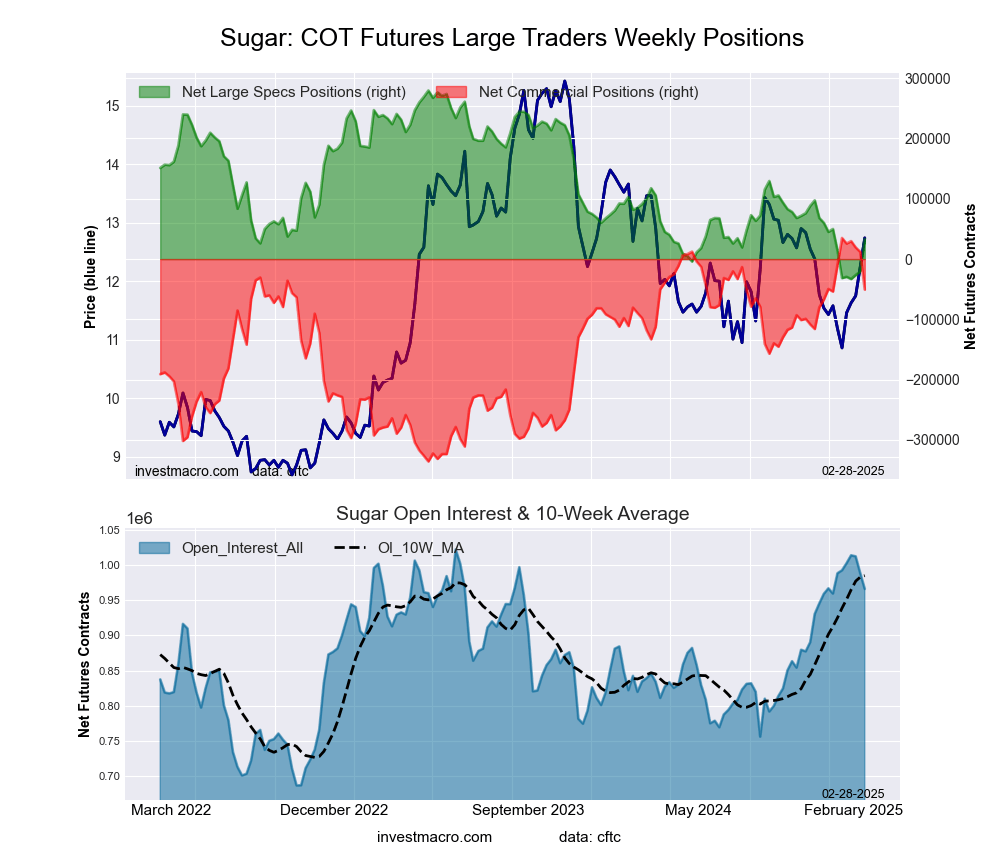
SUGAR Futures:
 The SUGAR large speculator standing this week was a net position of 33,235 contracts in the data reported through Tuesday. This was a weekly advance of 3,421 contracts from the previous week which had a total of 29,814 net contracts.
This week’s current strength score (the trader positioning range over the past three years, measured from 0 to 100) shows the speculators are currently Bearish with a score of 21.2 percent. The commercials are Bullish-Extreme with a score of 81.8 percent and the small traders (not shown in chart) are Bearish-Extreme with a score of 19.7 percent.
Price Trend-Following Model: Uptrend
Our weekly trend-following model classifies the current market price position as: Uptrend.
| SUGAR Futures Statistics | SPECULATORS | COMMERCIALS | SMALL TRADERS |
| – Percent of Open Interest Longs: | 23.3 | 55.8 | 6.9 |
| – Percent of Open Interest Shorts: | 19.3 | 59.7 | 7.0 |
| – Net Position: | 33,235 | -32,502 | -733 |
| – Gross Longs: | 193,078 | 463,598 | 57,180 |
| – Gross Shorts: | 159,843 | 496,100 | 57,913 |
| – Long to Short Ratio: | 1.2 to 1 | 0.9 to 1 | 1.0 to 1 |
| NET POSITION TREND: | |||
| – Strength Index Score (3 Year Range Pct): | 21.2 | 81.8 | 19.7 |
| – Strength Index Reading (3 Year Range): | Bearish | Bullish-Extreme | Bearish-Extreme |
| NET POSITION MOVEMENT INDEX: | |||
| – 6-Week Change in Strength Index: | 7.8 | -3.1 | -17.9 |
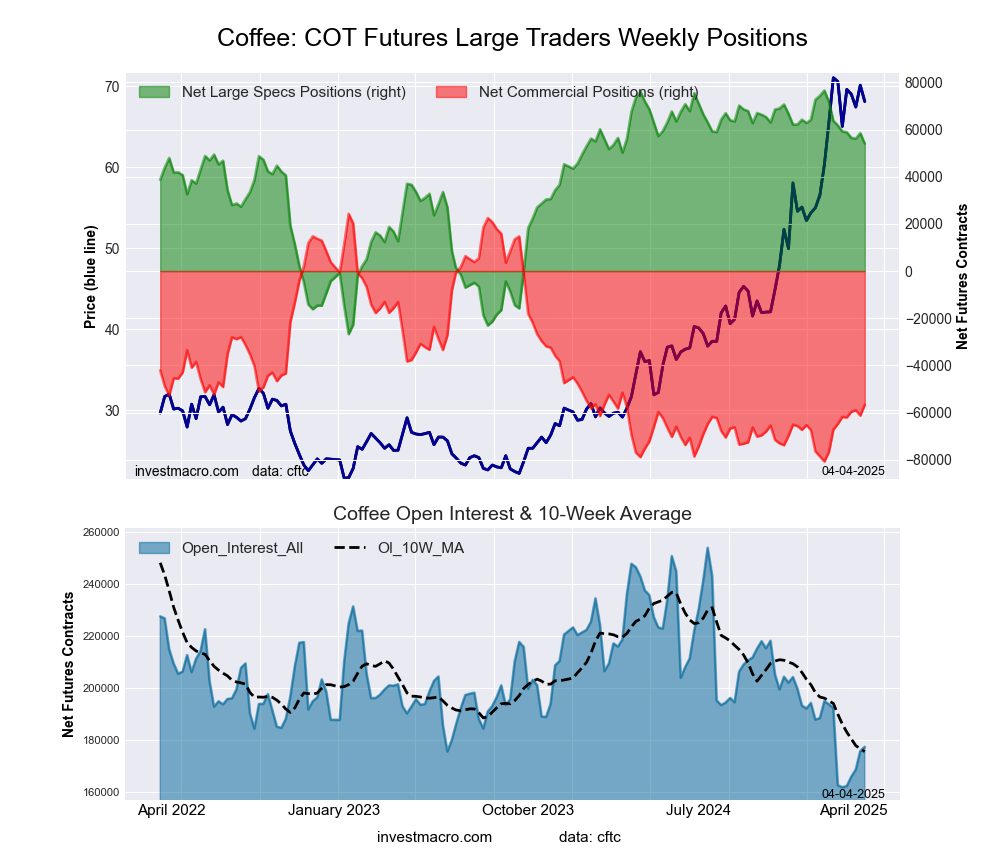
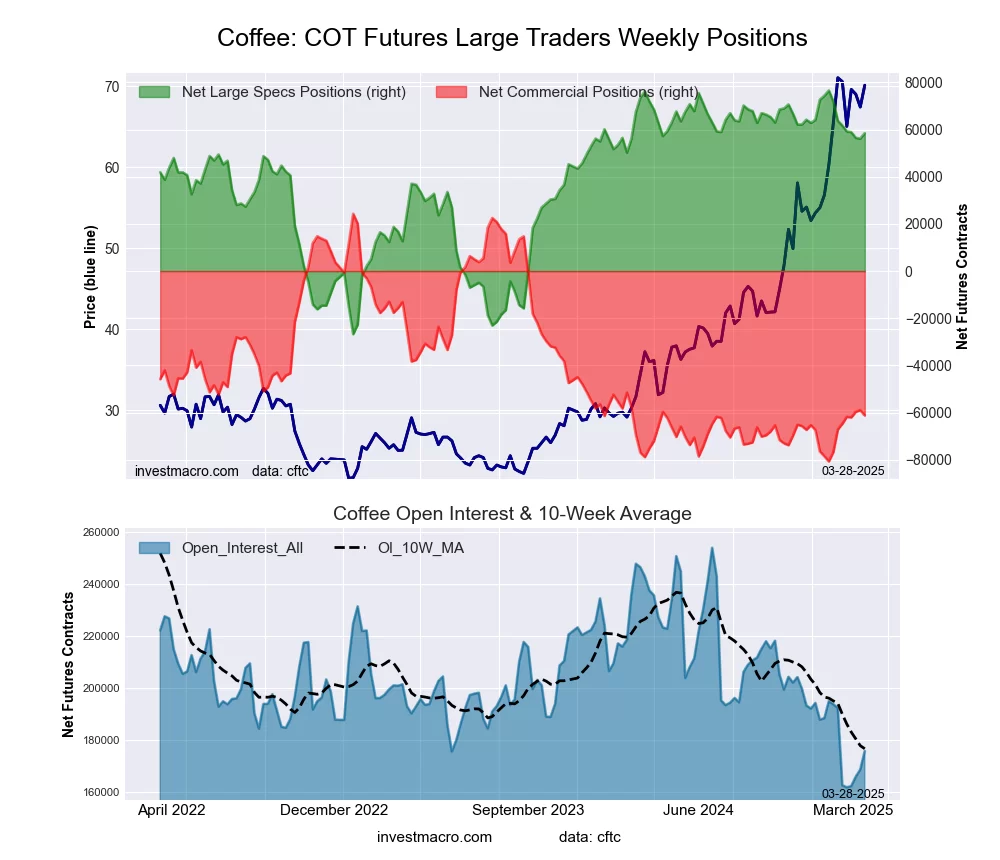
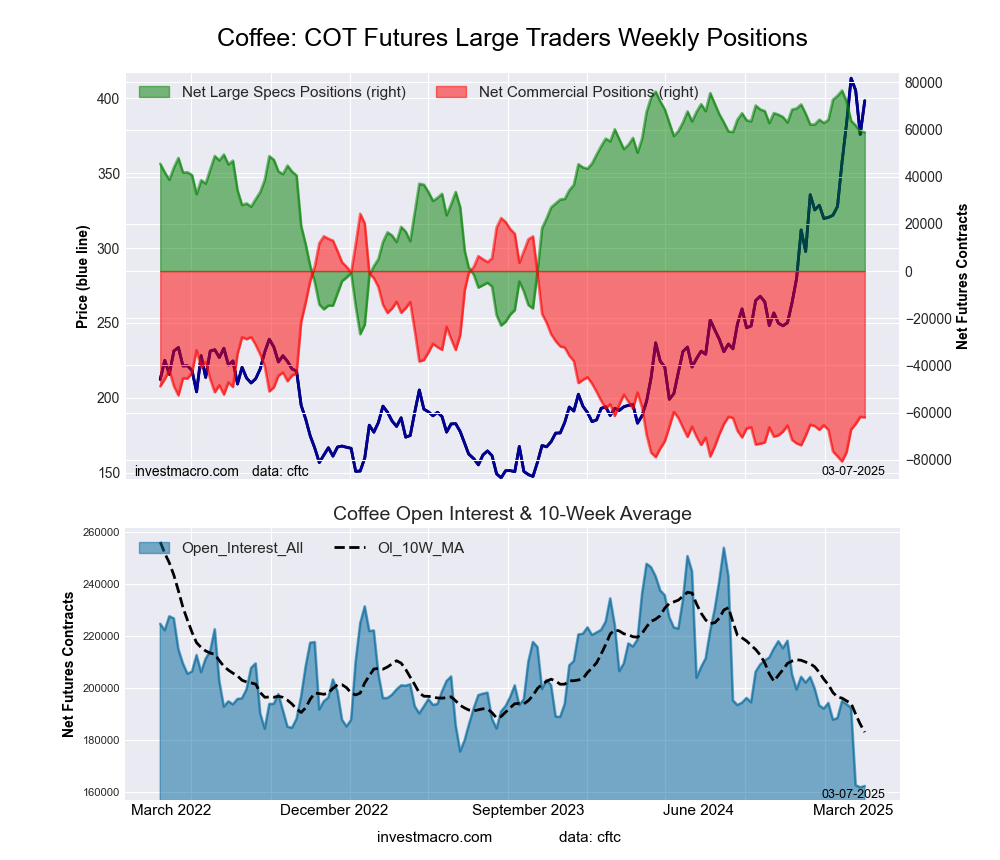
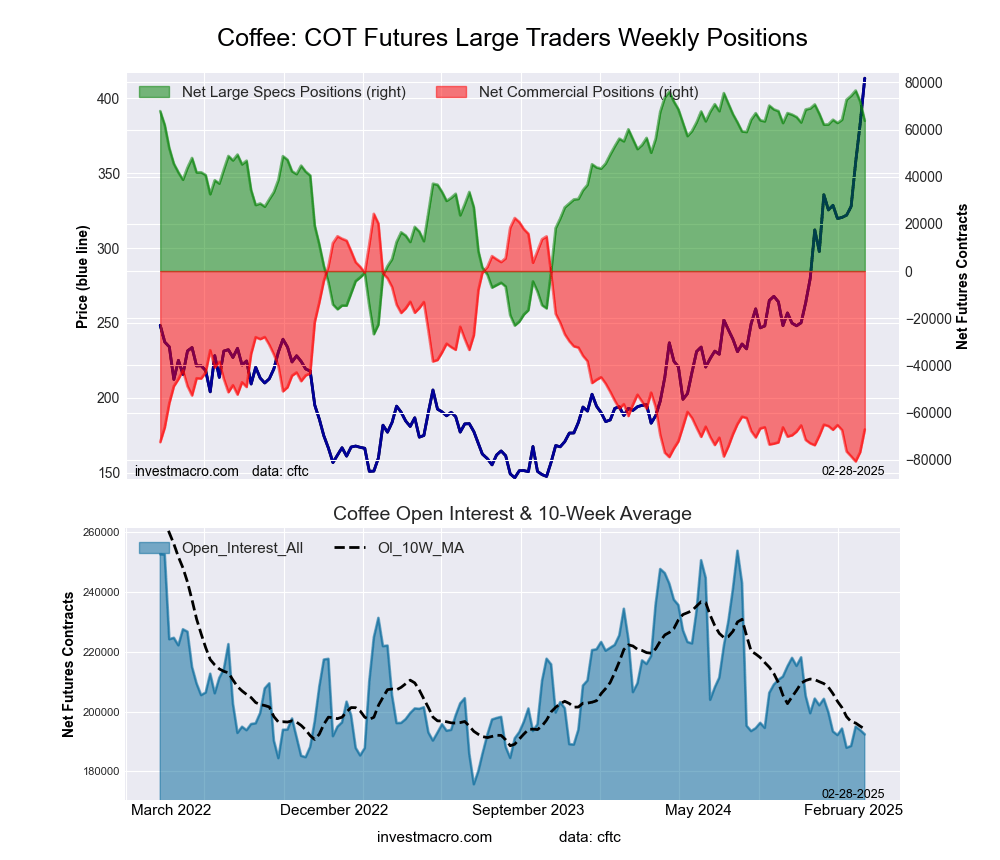
COFFEE Futures:
 The COFFEE large speculator standing this week was a net position of 41,056 contracts in the data reported through Tuesday. This was a weekly boost of 1,122 contracts from the previous week which had a total of 39,934 net contracts.
This week’s current strength score (the trader positioning range over the past three years, measured from 0 to 100) shows the speculators are currently Bullish with a score of 65.7 percent. The commercials are Bearish with a score of 35.6 percent and the small traders (not shown in chart) are Bullish with a score of 56.3 percent.
Price Trend-Following Model: Strong Uptrend
Our weekly trend-following model classifies the current market price position as: Strong Uptrend.
| COFFEE Futures Statistics | SPECULATORS | COMMERCIALS | SMALL TRADERS |
| – Percent of Open Interest Longs: | 35.1 | 41.9 | 5.5 |
| – Percent of Open Interest Shorts: | 7.0 | 71.5 | 3.9 |
| – Net Position: | 41,056 | -43,332 | 2,276 |
| – Gross Longs: | 51,215 | 61,110 | 8,005 |
| – Gross Shorts: | 10,159 | 104,442 | 5,729 |
| – Long to Short Ratio: | 5.0 to 1 | 0.6 to 1 | 1.4 to 1 |
| NET POSITION TREND: | |||
| – Strength Index Score (3 Year Range Pct): | 65.7 | 35.6 | 56.3 |
| – Strength Index Reading (3 Year Range): | Bullish | Bearish | Bullish |
| NET POSITION MOVEMENT INDEX: | |||
| – 6-Week Change in Strength Index: | -14.9 | 15.6 | -15.9 |
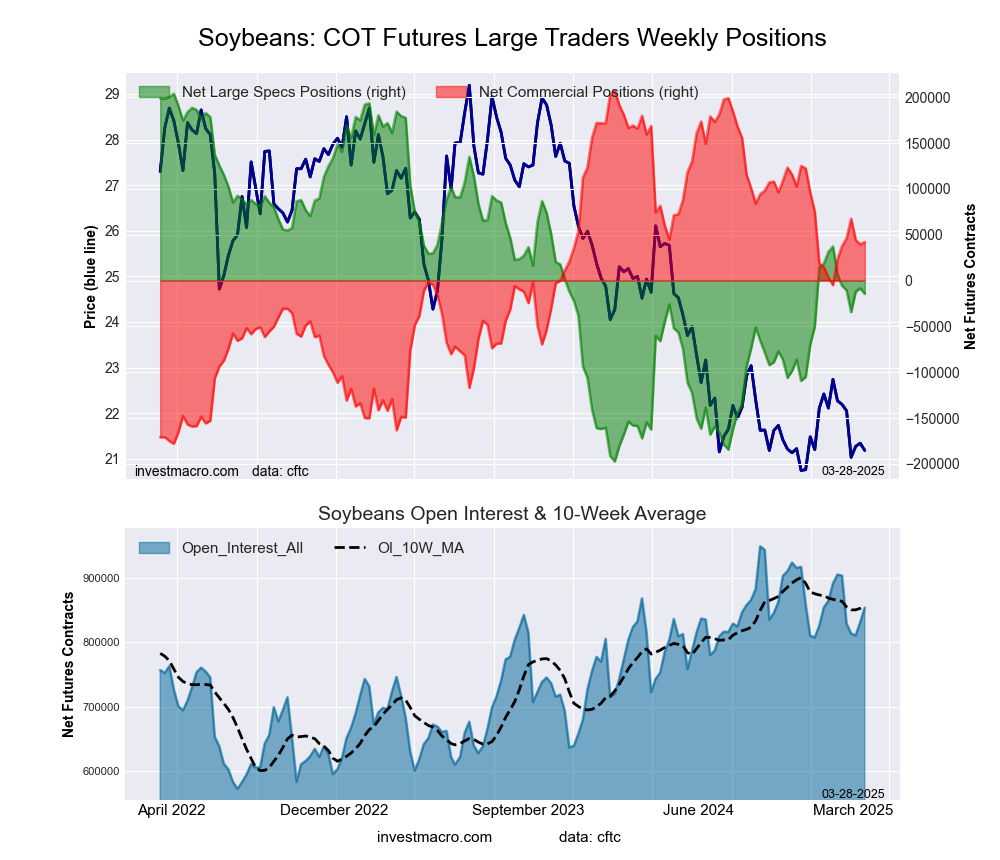
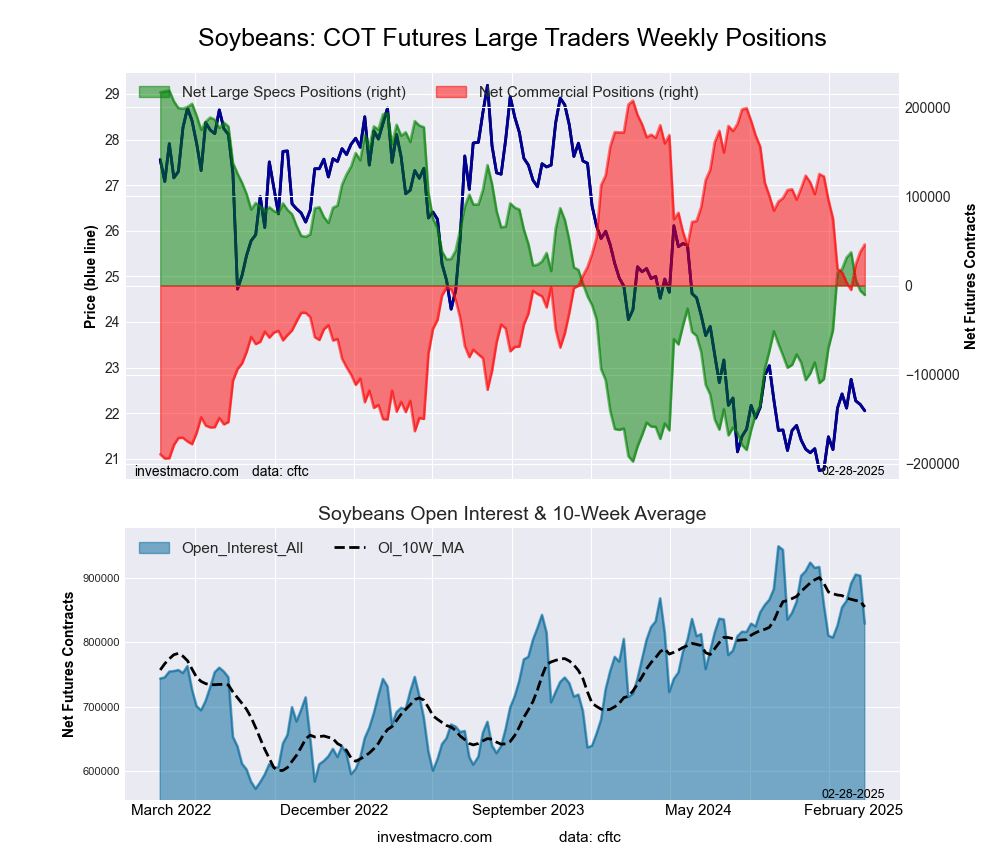
SOYBEANS Futures:
 The SOYBEANS large speculator standing this week was a net position of 55,684 contracts in the data reported through Tuesday. This was a weekly boost of 5,523 contracts from the previous week which had a total of 50,161 net contracts.
This week’s current strength score (the trader positioning range over the past three years, measured from 0 to 100) shows the speculators are currently Bullish with a score of 64.8 percent. The commercials are Bearish with a score of 35.9 percent and the small traders (not shown in chart) are Bearish with a score of 49.2 percent.
Price Trend-Following Model: Uptrend
Our weekly trend-following model classifies the current market price position as: Uptrend.
| SOYBEANS Futures Statistics | SPECULATORS | COMMERCIALS | SMALL TRADERS |
| – Percent of Open Interest Longs: | 23.6 | 52.0 | 5.3 |
| – Percent of Open Interest Shorts: | 16.7 | 55.8 | 8.2 |
| – Net Position: | 55,684 | -31,452 | -24,232 |
| – Gross Longs: | 191,535 | 422,467 | 42,698 |
| – Gross Shorts: | 135,851 | 453,919 | 66,930 |
| – Long to Short Ratio: | 1.4 to 1 | 0.9 to 1 | 0.6 to 1 |
| NET POSITION TREND: | |||
| – Strength Index Score (3 Year Range Pct): | 64.8 | 35.9 | 49.2 |
| – Strength Index Reading (3 Year Range): | Bullish | Bearish | Bearish |
| NET POSITION MOVEMENT INDEX: | |||
| – 6-Week Change in Strength Index: | 17.4 | -20.3 | 20.7 |
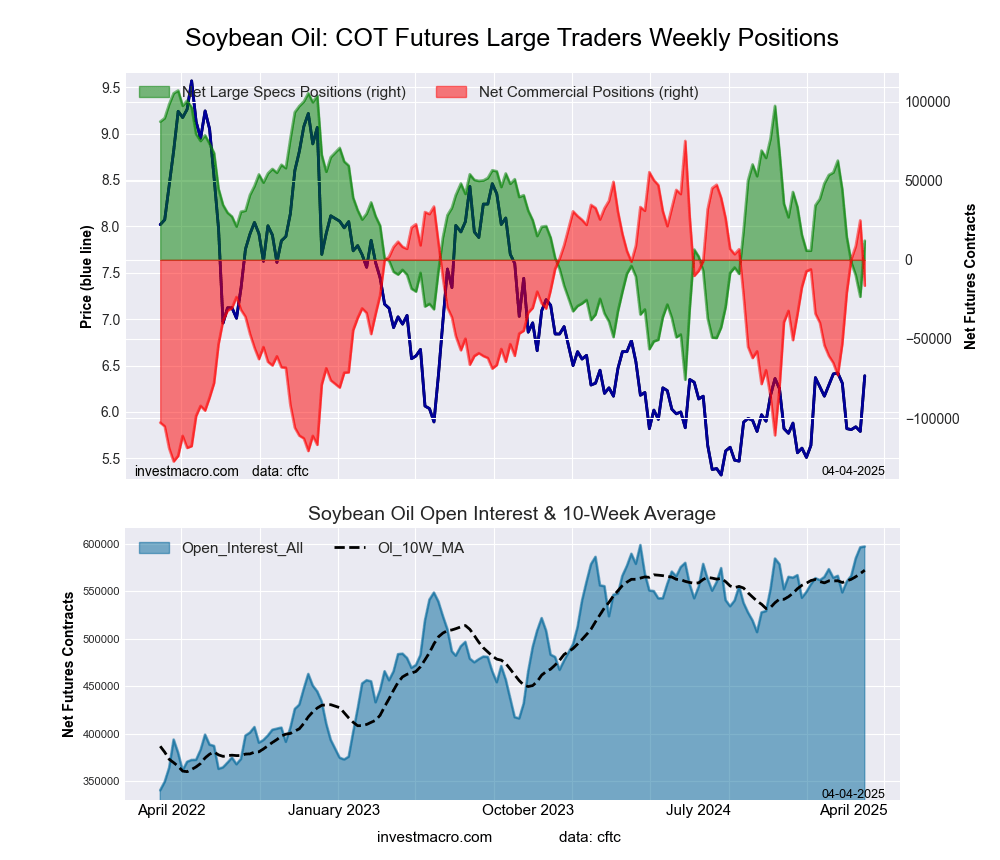
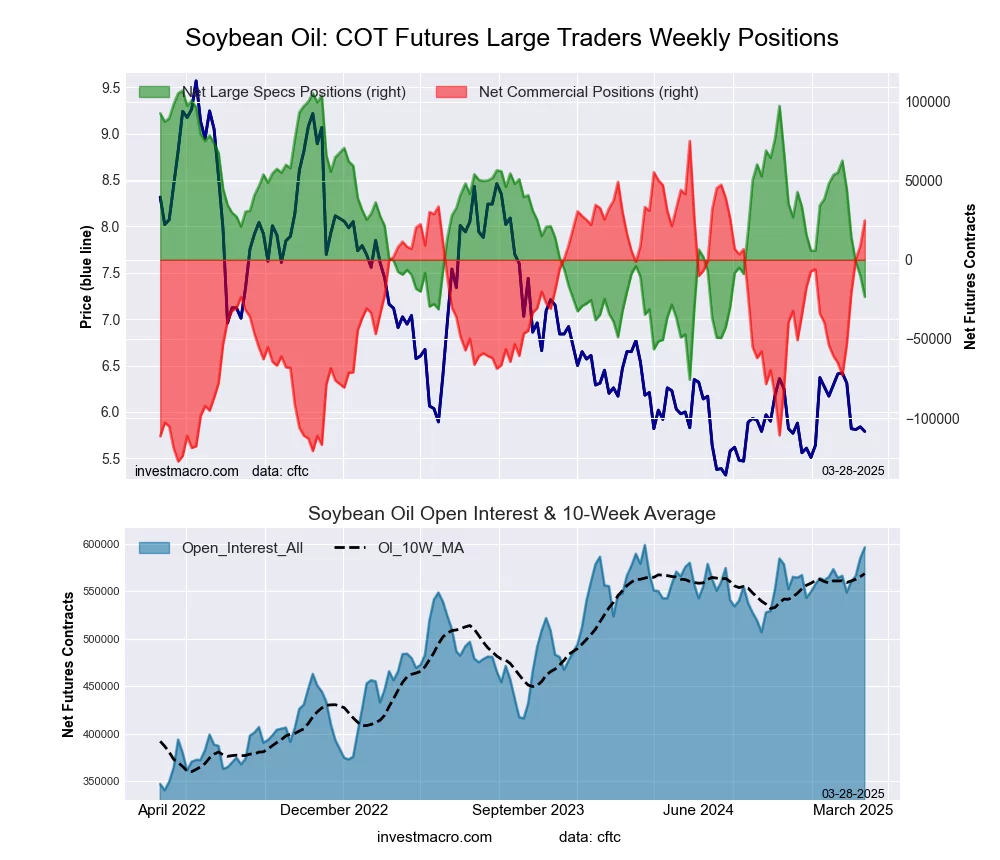
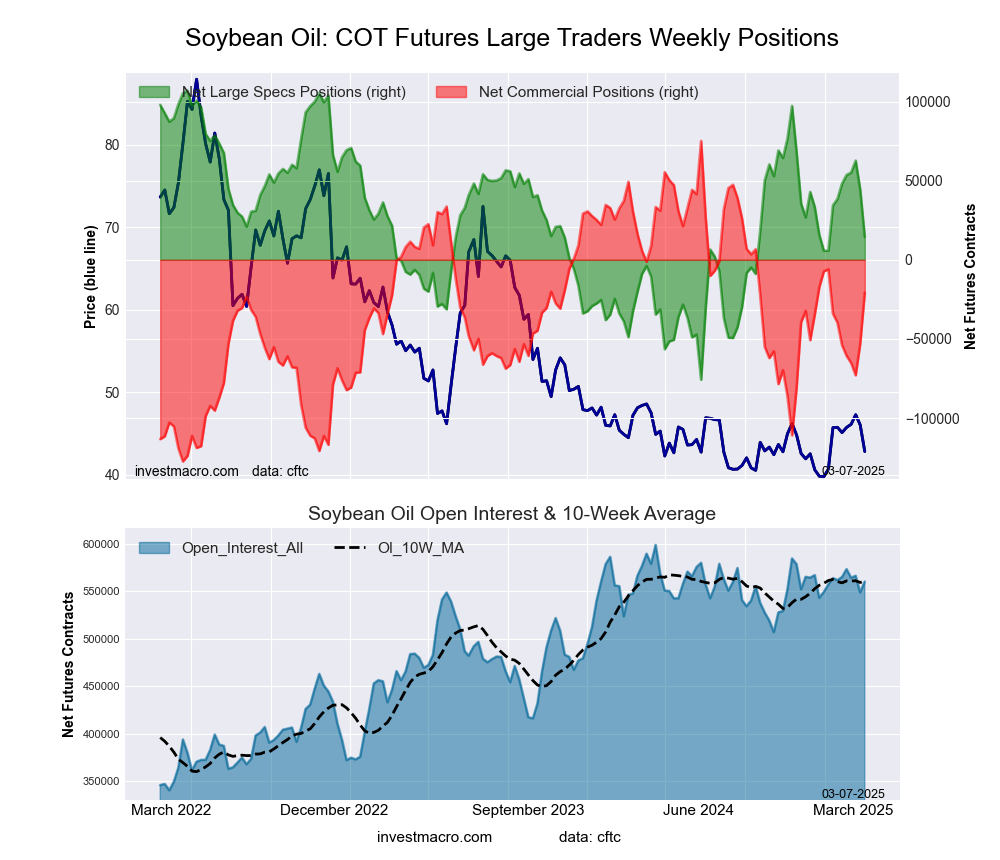
SOYBEAN OIL Futures:
 The SOYBEAN OIL large speculator standing this week was a net position of 60,391 contracts in the data reported through Tuesday. This was a weekly boost of 4,796 contracts from the previous week which had a total of 55,595 net contracts.
This week’s current strength score (the trader positioning range over the past three years, measured from 0 to 100) shows the speculators are currently Bullish with a score of 75.2 percent. The commercials are Bearish with a score of 27.5 percent and the small traders (not shown in chart) are Bearish with a score of 40.5 percent.
Price Trend-Following Model: Strong Uptrend
Our weekly trend-following model classifies the current market price position as: Strong Uptrend.
| SOYBEAN OIL Futures Statistics | SPECULATORS | COMMERCIALS | SMALL TRADERS |
| – Percent of Open Interest Longs: | 23.8 | 48.8 | 5.7 |
| – Percent of Open Interest Shorts: | 13.0 | 60.7 | 4.5 |
| – Net Position: | 60,391 | -66,889 | 6,498 |
| – Gross Longs: | 133,444 | 273,789 | 31,901 |
| – Gross Shorts: | 73,053 | 340,678 | 25,403 |
| – Long to Short Ratio: | 1.8 to 1 | 0.8 to 1 | 1.3 to 1 |
| NET POSITION TREND: | |||
| – Strength Index Score (3 Year Range Pct): | 75.2 | 27.5 | 40.5 |
| – Strength Index Reading (3 Year Range): | Bullish | Bearish | Bearish |
| NET POSITION MOVEMENT INDEX: | |||
| – 6-Week Change in Strength Index: | 34.2 | -34.3 | 21.3 |
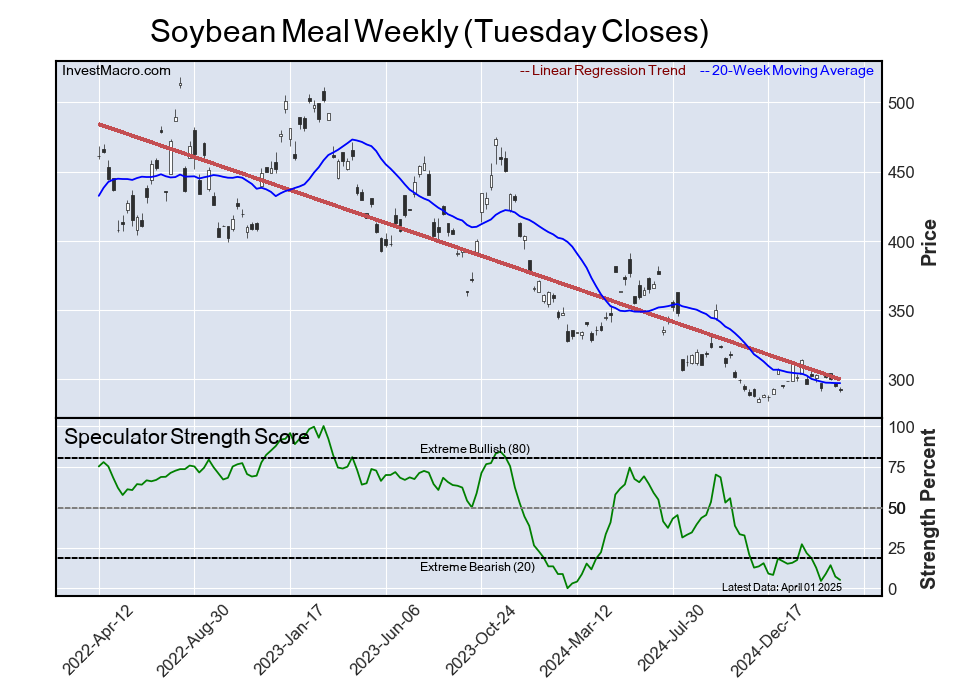
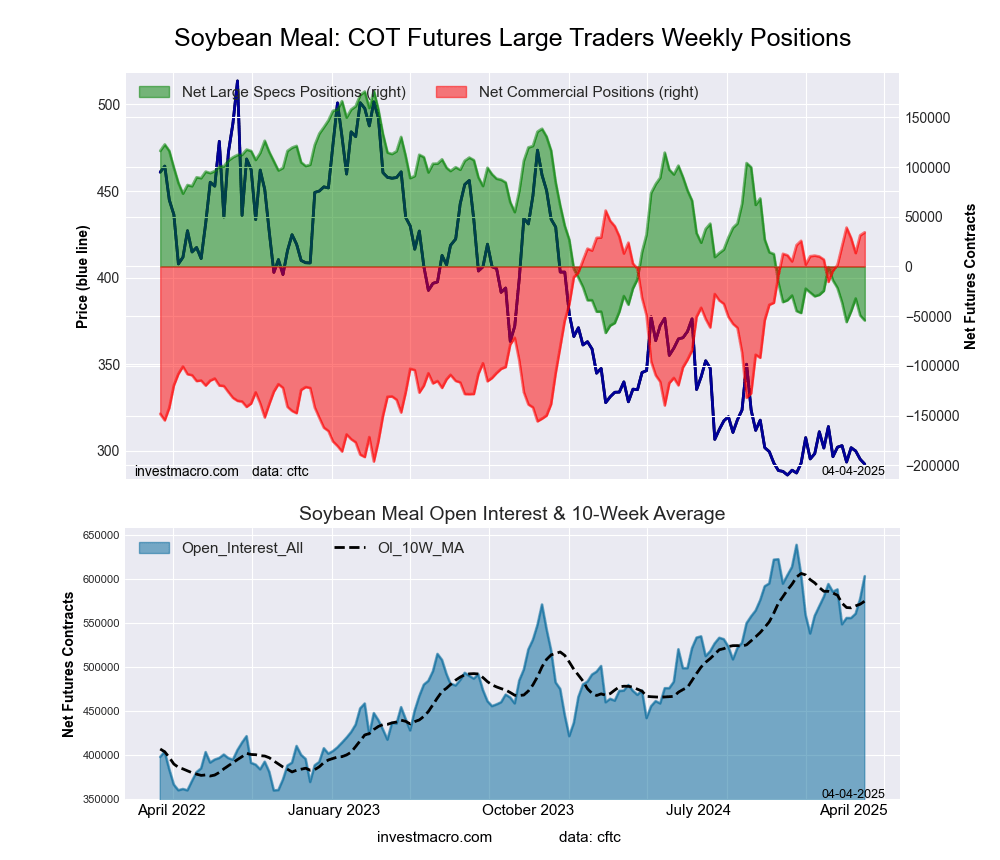
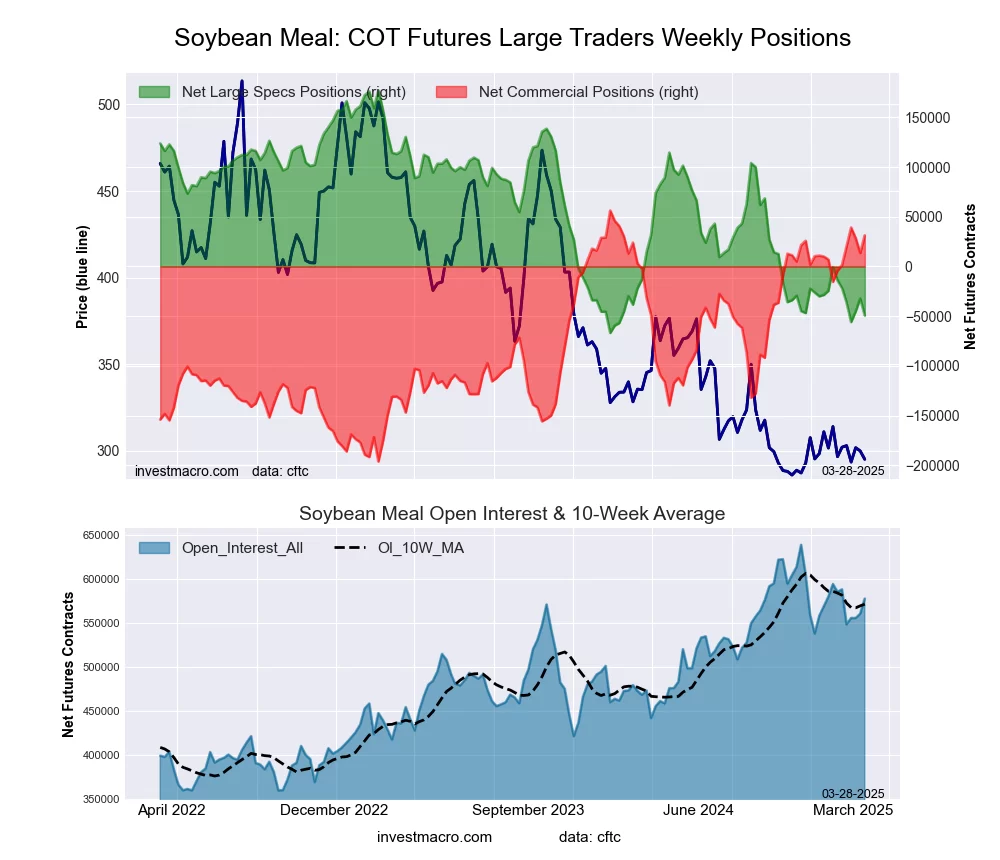
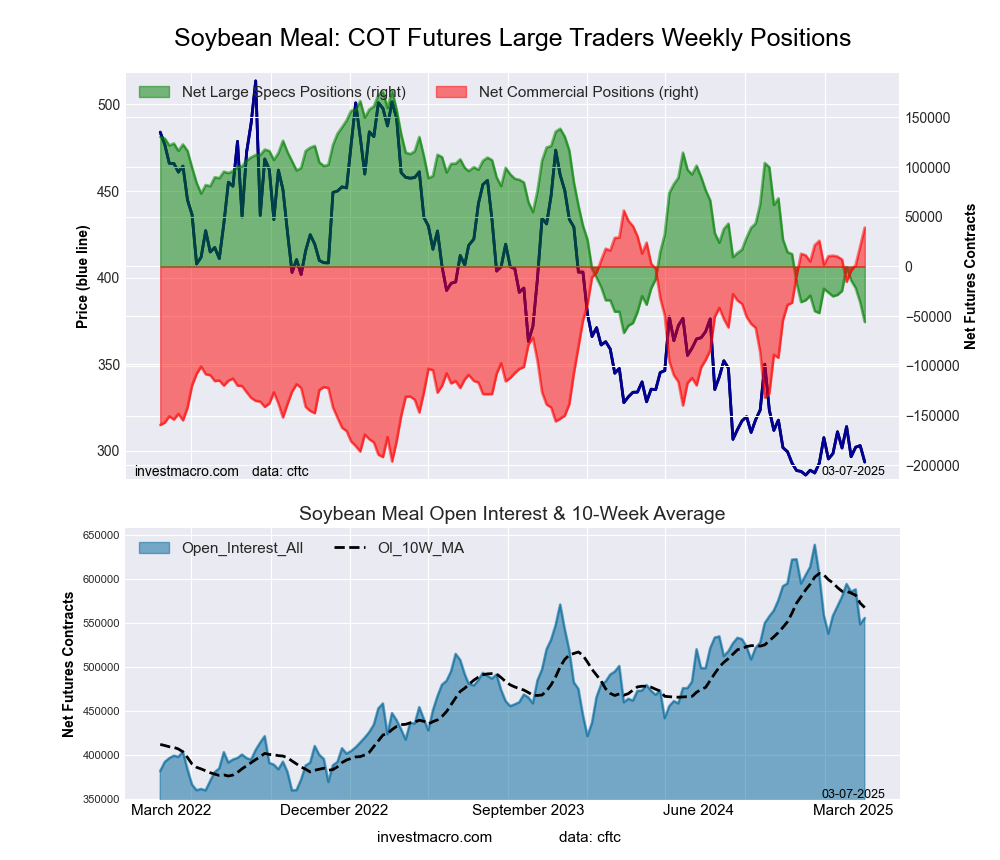
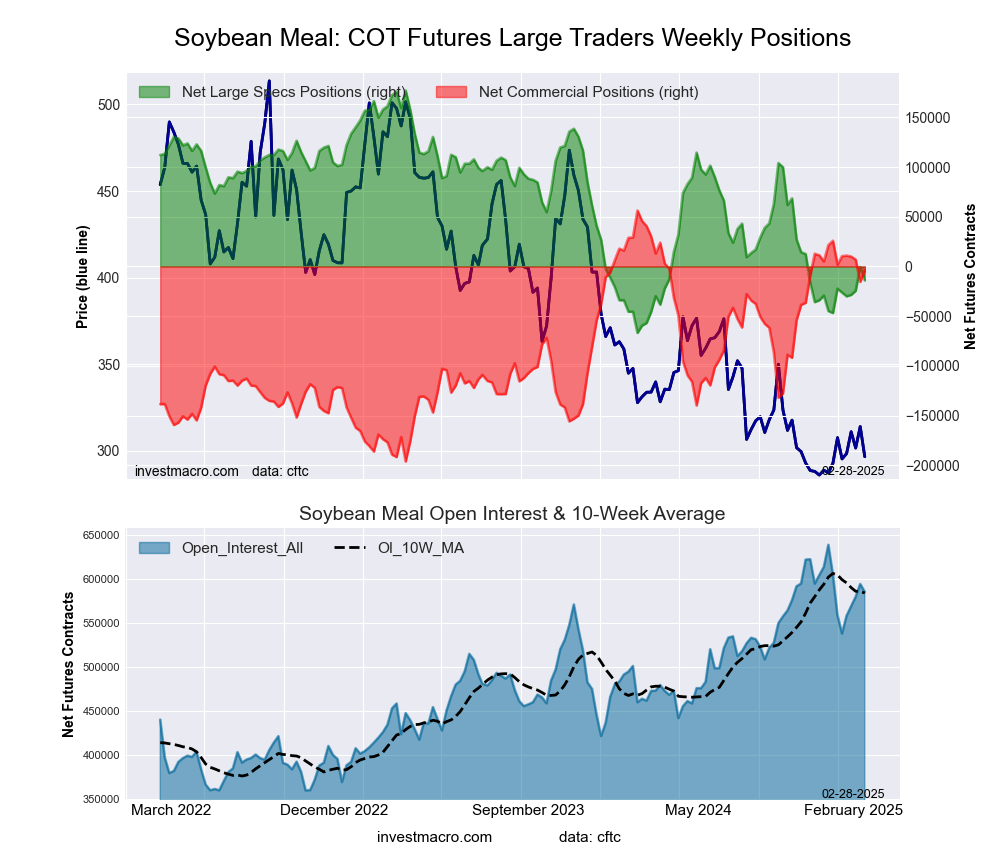
SOYBEAN MEAL Futures:
 The SOYBEAN MEAL large speculator standing this week was a net position of -30,976 contracts in the data reported through Tuesday. This was a weekly fall of -6,840 contracts from the previous week which had a total of -24,136 net contracts.
This week’s current strength score (the trader positioning range over the past three years, measured from 0 to 100) shows the speculators are currently Bearish-Extreme with a score of 14.7 percent. The commercials are Bullish-Extreme with a score of 83.1 percent and the small traders (not shown in chart) are Bearish with a score of 40.1 percent.
Price Trend-Following Model: Uptrend
Our weekly trend-following model classifies the current market price position as: Uptrend.
| SOYBEAN MEAL Futures Statistics | SPECULATORS | COMMERCIALS | SMALL TRADERS |
| – Percent of Open Interest Longs: | 19.0 | 48.9 | 8.0 |
| – Percent of Open Interest Shorts: | 24.1 | 46.7 | 5.1 |
| – Net Position: | -30,976 | 13,581 | 17,395 |
| – Gross Longs: | 114,769 | 295,935 | 48,216 |
| – Gross Shorts: | 145,745 | 282,354 | 30,821 |
| – Long to Short Ratio: | 0.8 to 1 | 1.0 to 1 | 1.6 to 1 |
| NET POSITION TREND: | |||
| – Strength Index Score (3 Year Range Pct): | 14.7 | 83.1 | 40.1 |
| – Strength Index Reading (3 Year Range): | Bearish-Extreme | Bullish-Extreme | Bearish |
| NET POSITION MOVEMENT INDEX: | |||
| – 6-Week Change in Strength Index: | 5.8 | -5.9 | 3.9 |
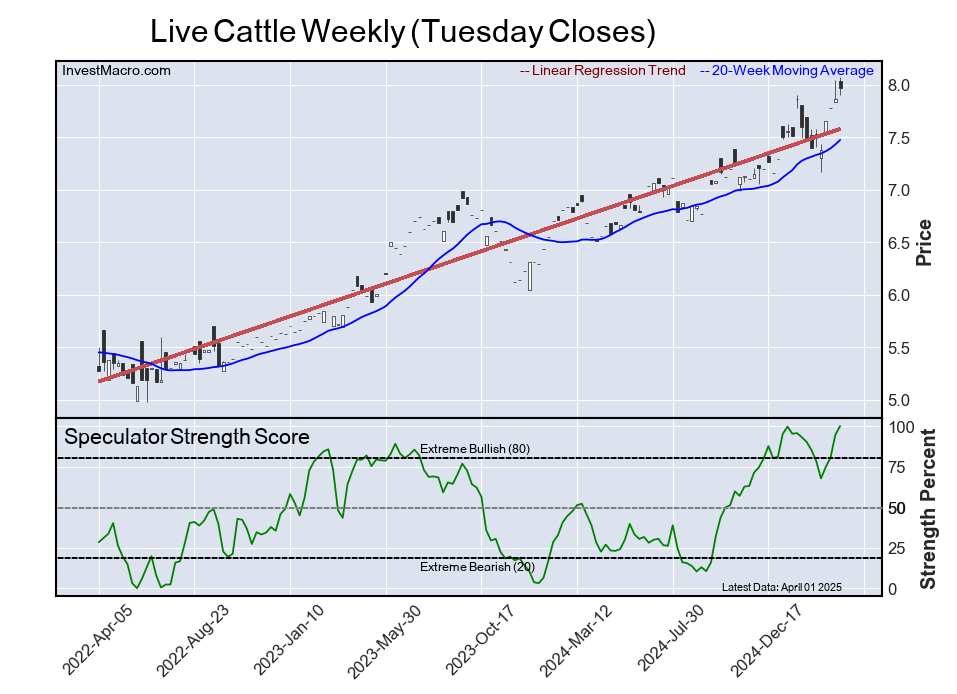
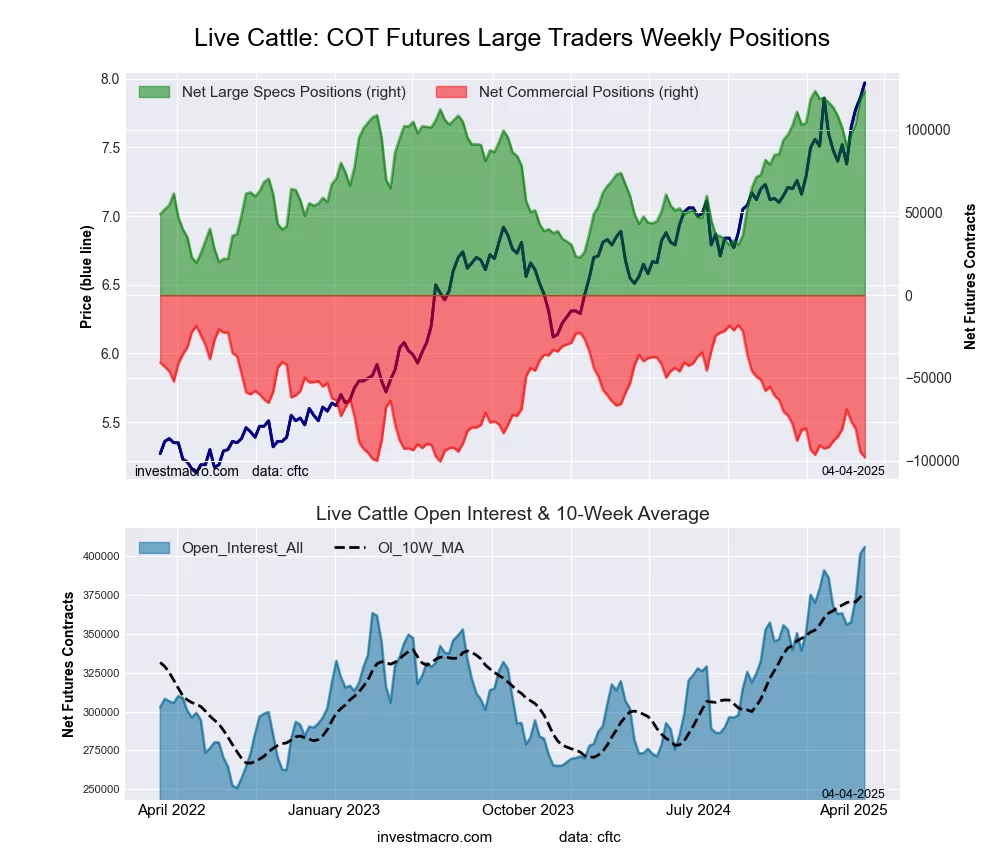
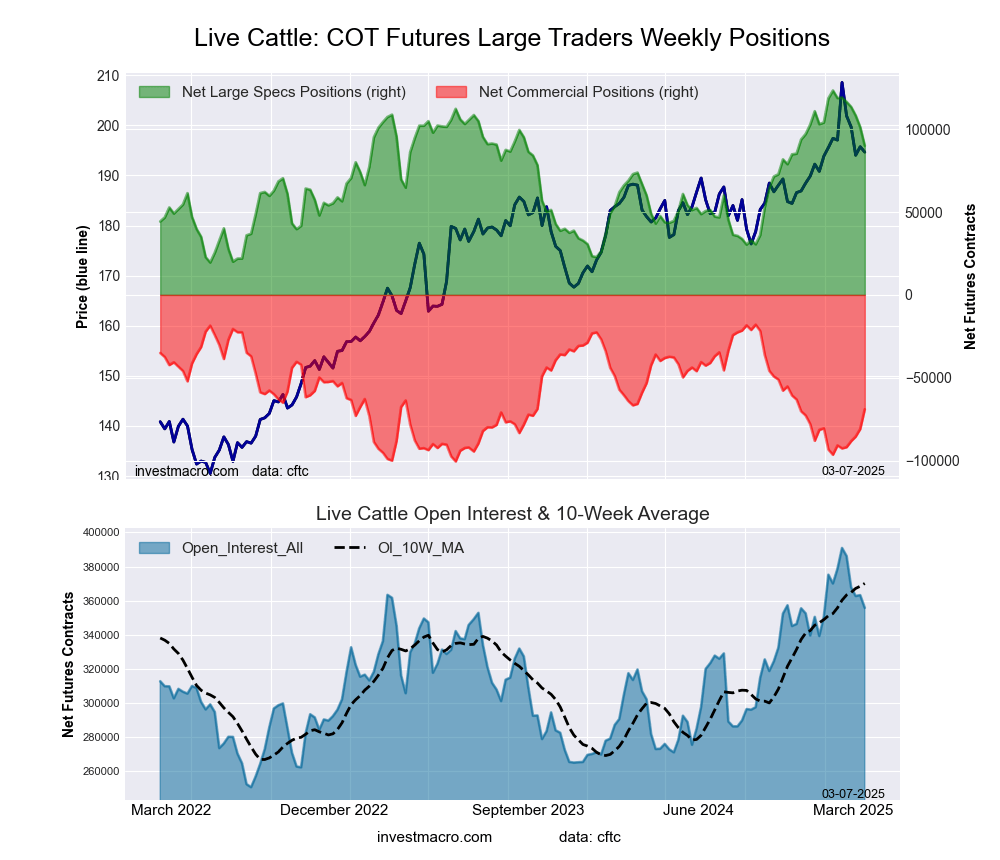
LIVE CATTLE Futures:
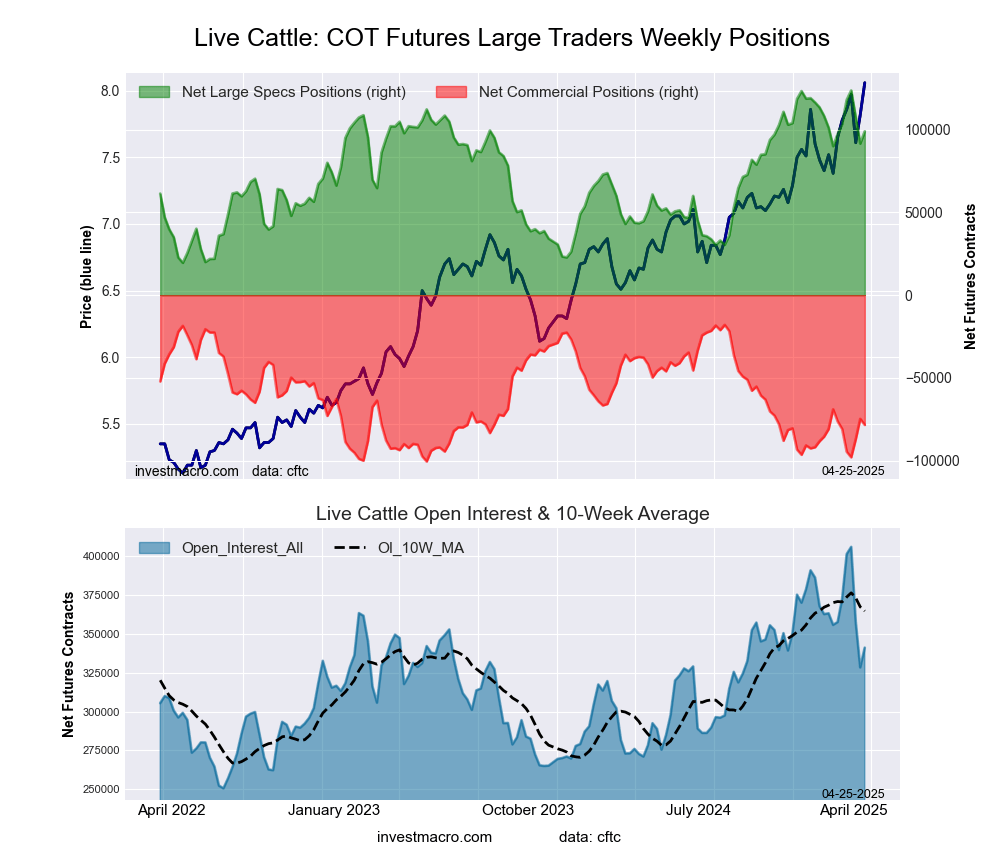 The LIVE CATTLE large speculator standing this week was a net position of 99,006 contracts in the data reported through Tuesday. This was a weekly rise of 7,421 contracts from the previous week which had a total of 91,585 net contracts.
This week’s current strength score (the trader positioning range over the past three years, measured from 0 to 100) shows the speculators are currently Bullish with a score of 76.3 percent. The commercials are Bearish with a score of 26.7 percent and the small traders (not shown in chart) are Bearish with a score of 24.6 percent.
Price Trend-Following Model: Strong Uptrend
Our weekly trend-following model classifies the current market price position as: Strong Uptrend.
| LIVE CATTLE Futures Statistics | SPECULATORS | COMMERCIALS | SMALL TRADERS |
| – Percent of Open Interest Longs: | 46.8 | 30.2 | 8.1 |
| – Percent of Open Interest Shorts: | 17.8 | 53.2 | 14.1 |
| – Net Position: | 99,006 | -78,413 | -20,593 |
| – Gross Longs: | 159,752 | 103,109 | 27,583 |
| – Gross Shorts: | 60,746 | 181,522 | 48,176 |
| – Long to Short Ratio: | 2.6 to 1 | 0.6 to 1 | 0.6 to 1 |
| NET POSITION TREND: | |||
| – Strength Index Score (3 Year Range Pct): | 76.3 | 26.7 | 24.6 |
| – Strength Index Reading (3 Year Range): | Bullish | Bearish | Bearish |
| NET POSITION MOVEMENT INDEX: | |||
| – 6-Week Change in Strength Index: | 1.6 | -2.6 | 1.7 |
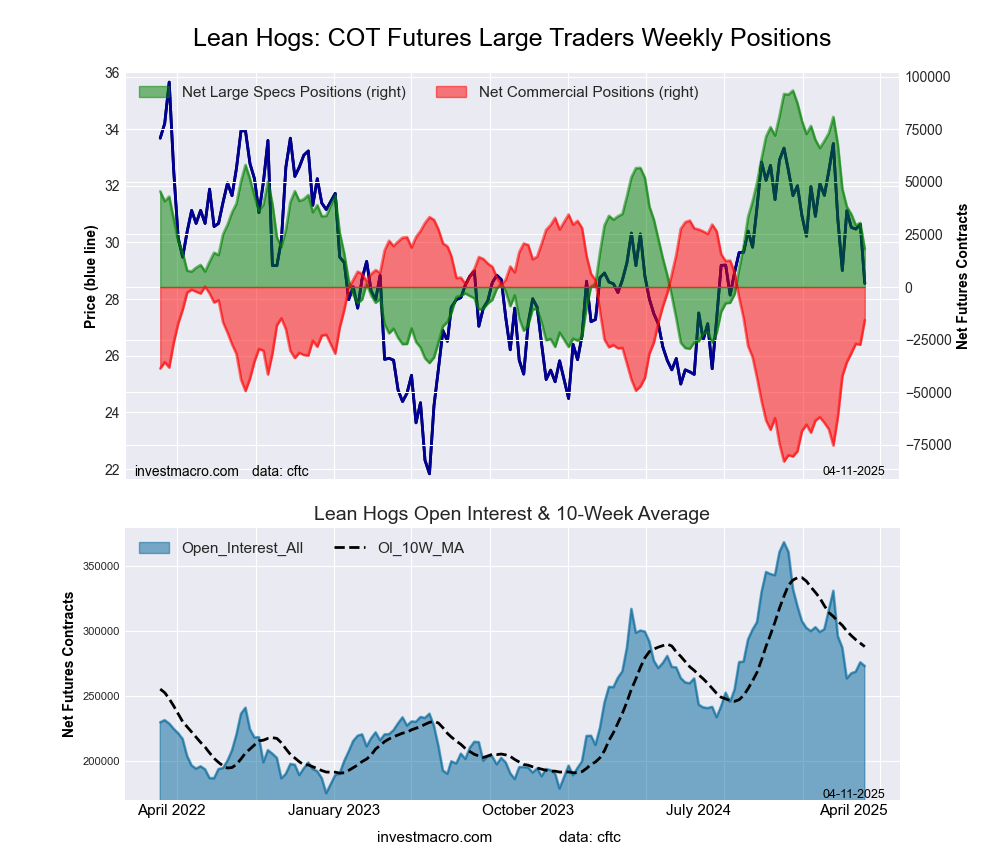
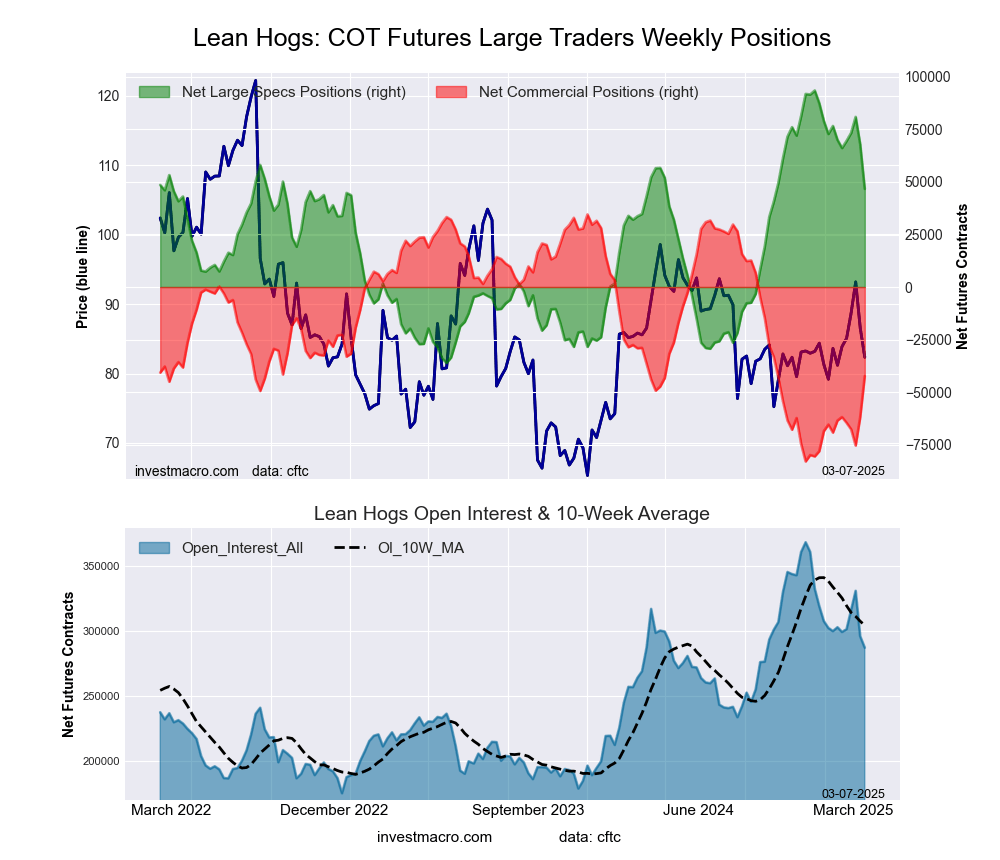
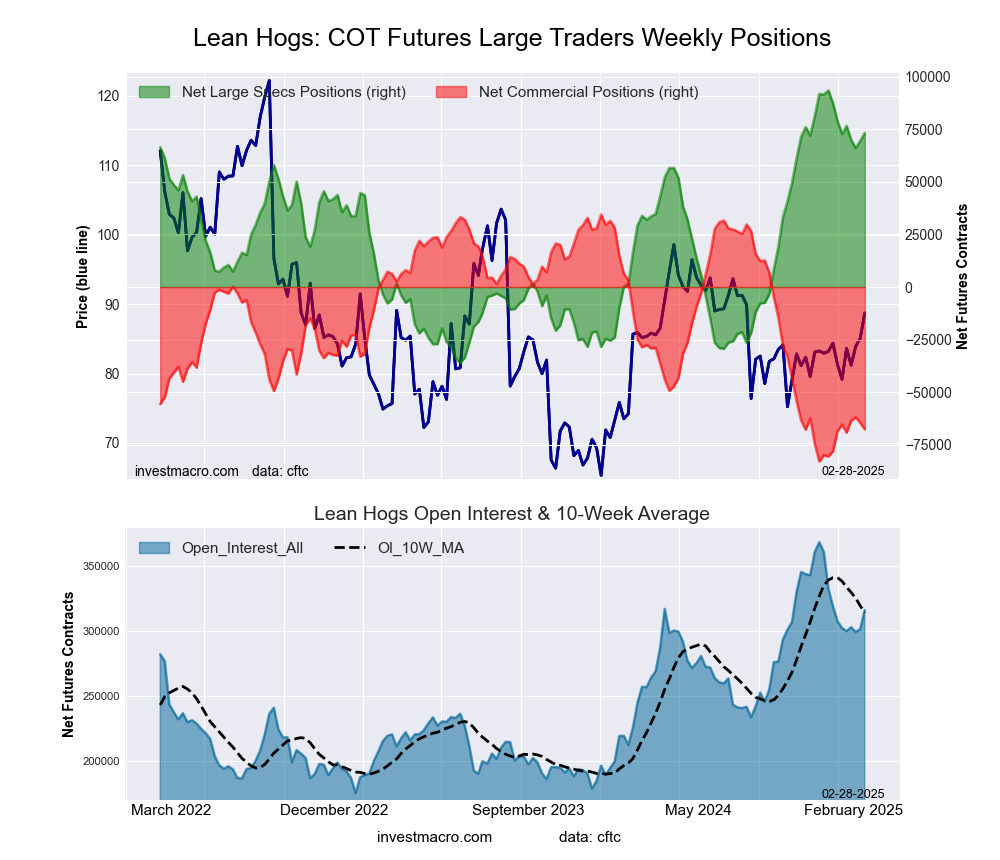
LEAN HOGS Futures:
 The LEAN HOGS large speculator standing this week was a net position of 31,296 contracts in the data reported through Tuesday. This was a weekly lift of 13,275 contracts from the previous week which had a total of 18,021 net contracts.
This week’s current strength score (the trader positioning range over the past three years, measured from 0 to 100) shows the speculators are currently Bullish with a score of 52.0 percent. The commercials are Bearish with a score of 45.4 percent and the small traders (not shown in chart) are Bullish with a score of 67.4 percent.
Price Trend-Following Model: Weak Downtrend
Our weekly trend-following model classifies the current market price position as: Weak Downtrend.
| LEAN HOGS Futures Statistics | SPECULATORS | COMMERCIALS | SMALL TRADERS |
| – Percent of Open Interest Longs: | 35.6 | 35.7 | 7.7 |
| – Percent of Open Interest Shorts: | 23.6 | 47.0 | 8.4 |
| – Net Position: | 31,296 | -29,609 | -1,687 |
| – Gross Longs: | 93,049 | 93,132 | 20,201 |
| – Gross Shorts: | 61,753 | 122,741 | 21,888 |
| – Long to Short Ratio: | 1.5 to 1 | 0.8 to 1 | 0.9 to 1 |
| NET POSITION TREND: | |||
| – Strength Index Score (3 Year Range Pct): | 52.0 | 45.4 | 67.4 |
| – Strength Index Reading (3 Year Range): | Bullish | Bearish | Bullish |
| NET POSITION MOVEMENT INDEX: | |||
| – 6-Week Change in Strength Index: | -5.3 | 5.2 | 4.8 |
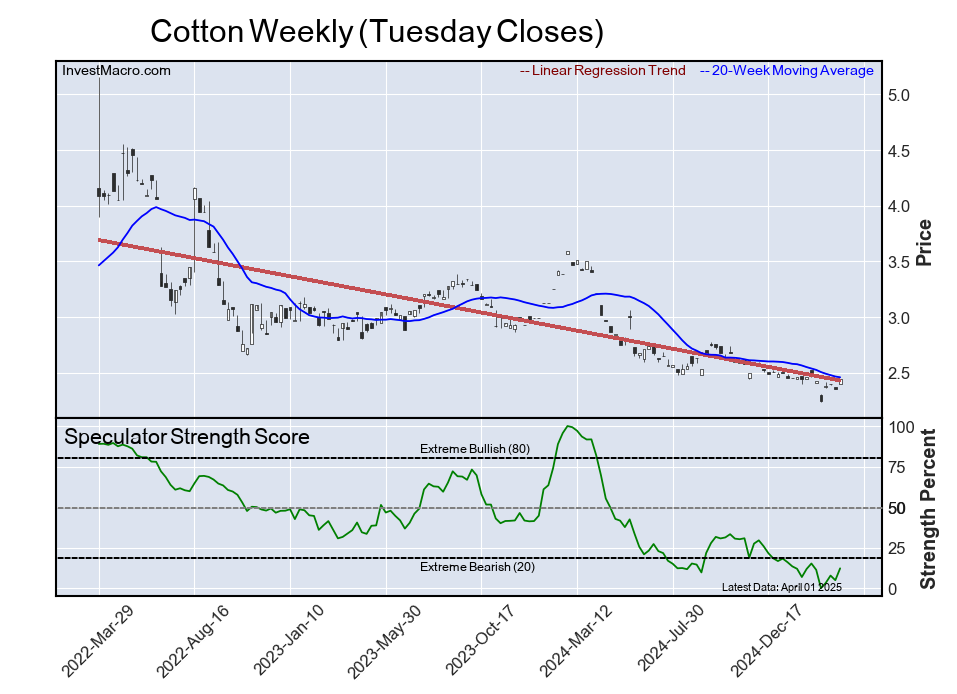
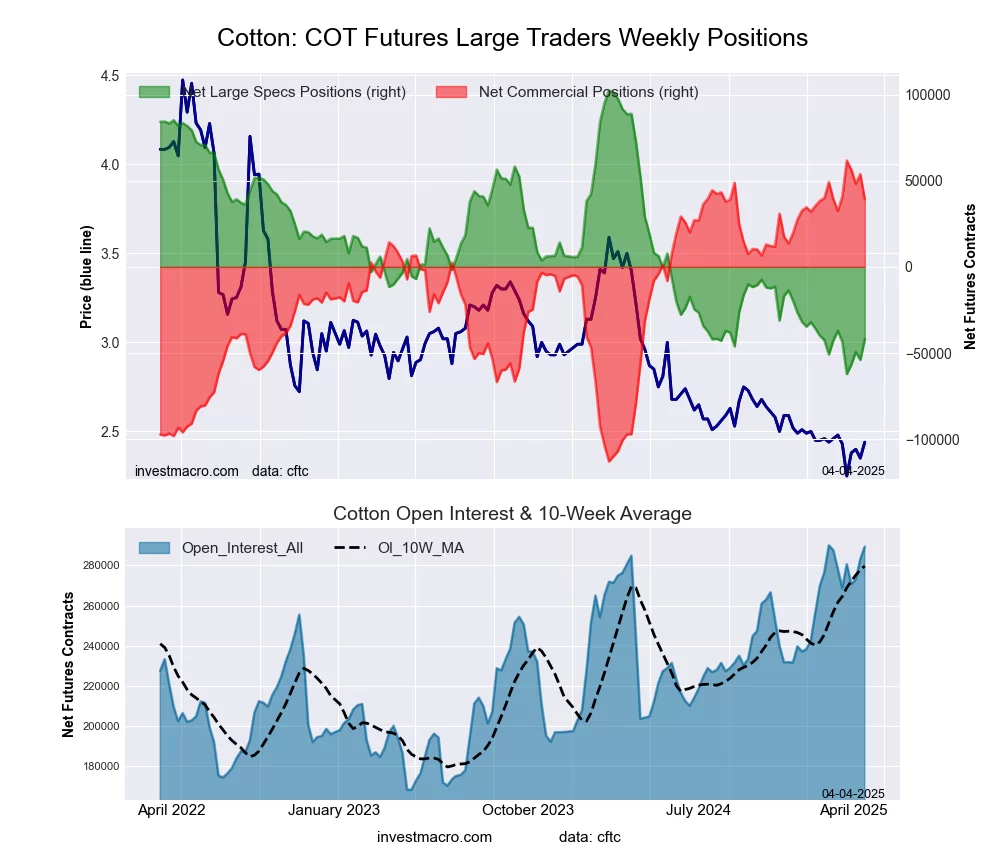
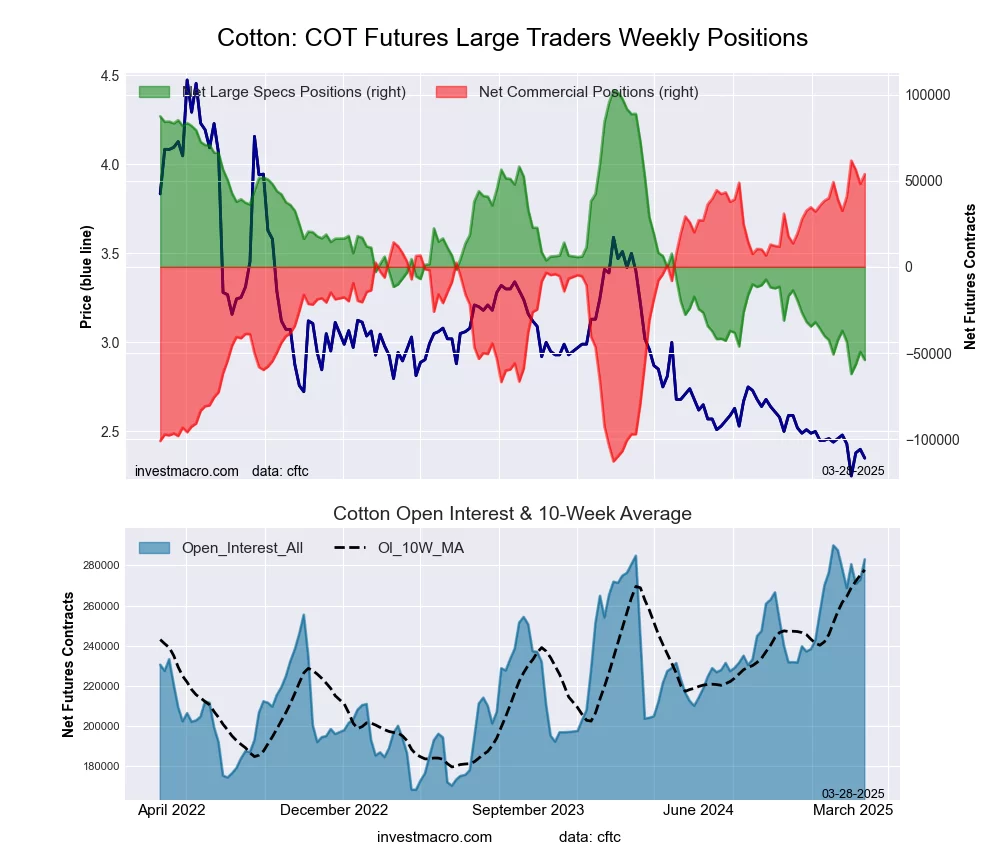
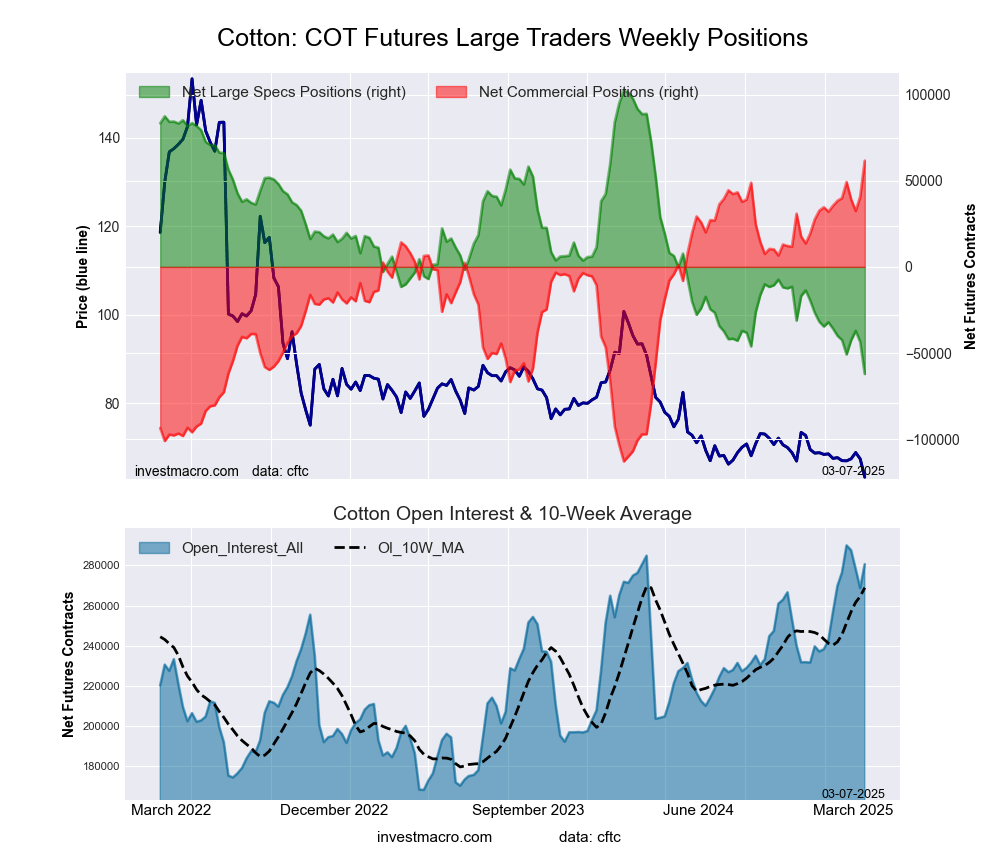
COTTON Futures:
 The COTTON large speculator standing this week was a net position of -25,078 contracts in the data reported through Tuesday. This was a weekly boost of 3,378 contracts from the previous week which had a total of -28,456 net contracts.
This week’s current strength score (the trader positioning range over the past three years, measured from 0 to 100) shows the speculators are currently Bearish with a score of 22.5 percent. The commercials are Bullish-Extreme with a score of 80.5 percent and the small traders (not shown in chart) are Bearish-Extreme with a score of 1.0 percent.
Price Trend-Following Model: Weak Downtrend
Our weekly trend-following model classifies the current market price position as: Weak Downtrend.
| COTTON Futures Statistics | SPECULATORS | COMMERCIALS | SMALL TRADERS |
| – Percent of Open Interest Longs: | 27.9 | 49.7 | 4.8 |
| – Percent of Open Interest Shorts: | 39.4 | 37.0 | 6.0 |
| – Net Position: | -25,078 | 27,632 | -2,554 |
| – Gross Longs: | 60,797 | 108,112 | 10,492 |
| – Gross Shorts: | 85,875 | 80,480 | 13,046 |
| – Long to Short Ratio: | 0.7 to 1 | 1.3 to 1 | 0.8 to 1 |
| NET POSITION TREND: | |||
| – Strength Index Score (3 Year Range Pct): | 22.5 | 80.5 | 1.0 |
| – Strength Index Reading (3 Year Range): | Bearish | Bullish-Extreme | Bearish-Extreme |
| NET POSITION MOVEMENT INDEX: | |||
| – 6-Week Change in Strength Index: | 19.2 | -16.4 | -19.7 |
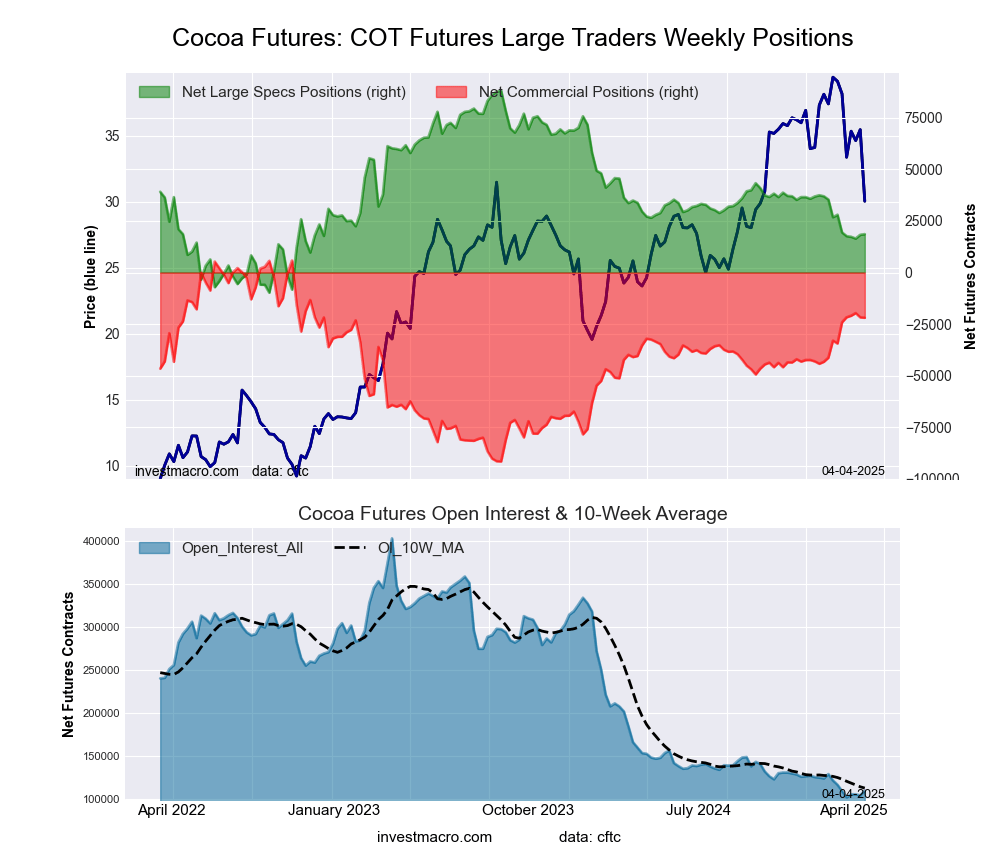
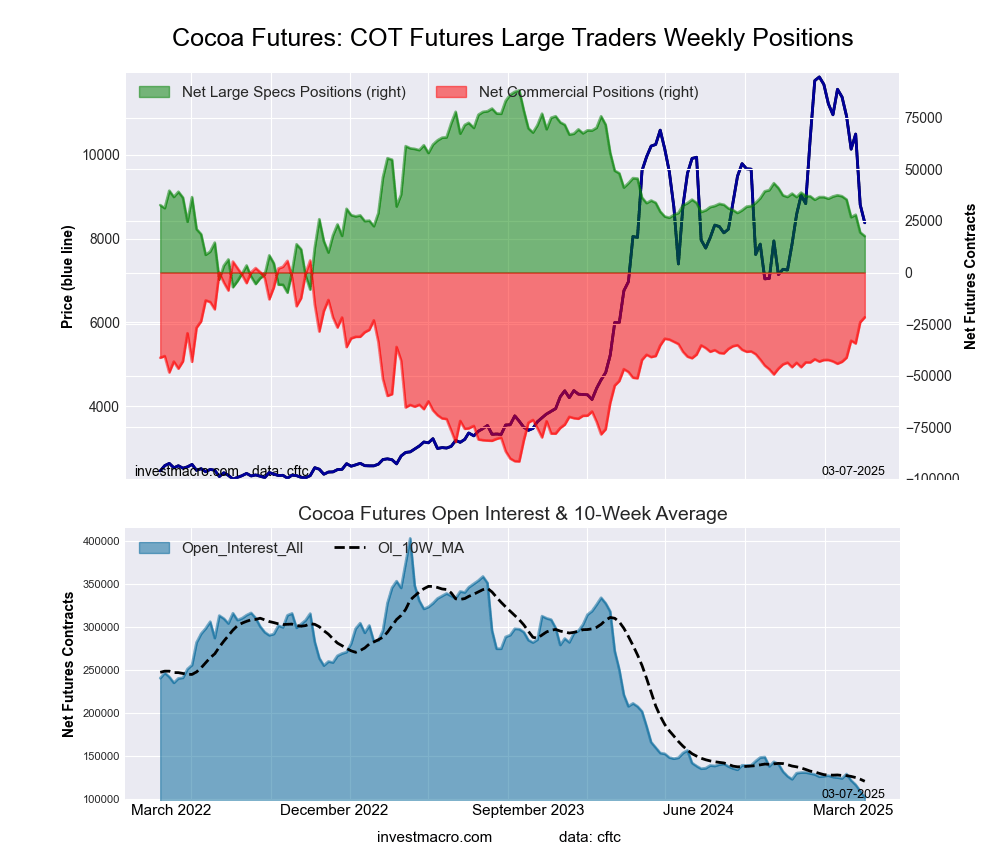
COCOA Futures:
 The COCOA large speculator standing this week was a net position of 15,577 contracts in the data reported through Tuesday. This was a weekly gain of 966 contracts from the previous week which had a total of 14,611 net contracts.
This week’s current strength score (the trader positioning range over the past three years, measured from 0 to 100) shows the speculators are currently Bearish with a score of 25.8 percent. The commercials are Bullish with a score of 74.6 percent and the small traders (not shown in chart) are Bullish with a score of 53.3 percent.
Price Trend-Following Model: Strong Downtrend
Our weekly trend-following model classifies the current market price position as: Strong Downtrend.
| COCOA Futures Statistics | SPECULATORS | COMMERCIALS | SMALL TRADERS |
| – Percent of Open Interest Longs: | 28.9 | 41.3 | 10.5 |
| – Percent of Open Interest Shorts: | 11.0 | 63.1 | 6.6 |
| – Net Position: | 15,577 | -18,970 | 3,393 |
| – Gross Longs: | 25,112 | 35,919 | 9,148 |
| – Gross Shorts: | 9,535 | 54,889 | 5,755 |
| – Long to Short Ratio: | 2.6 to 1 | 0.7 to 1 | 1.6 to 1 |
| NET POSITION TREND: | |||
| – Strength Index Score (3 Year Range Pct): | 25.8 | 74.6 | 53.3 |
| – Strength Index Reading (3 Year Range): | Bearish | Bullish | Bullish |
| NET POSITION MOVEMENT INDEX: | |||
| – 6-Week Change in Strength Index: | -1.8 | 2.0 | -3.0 |
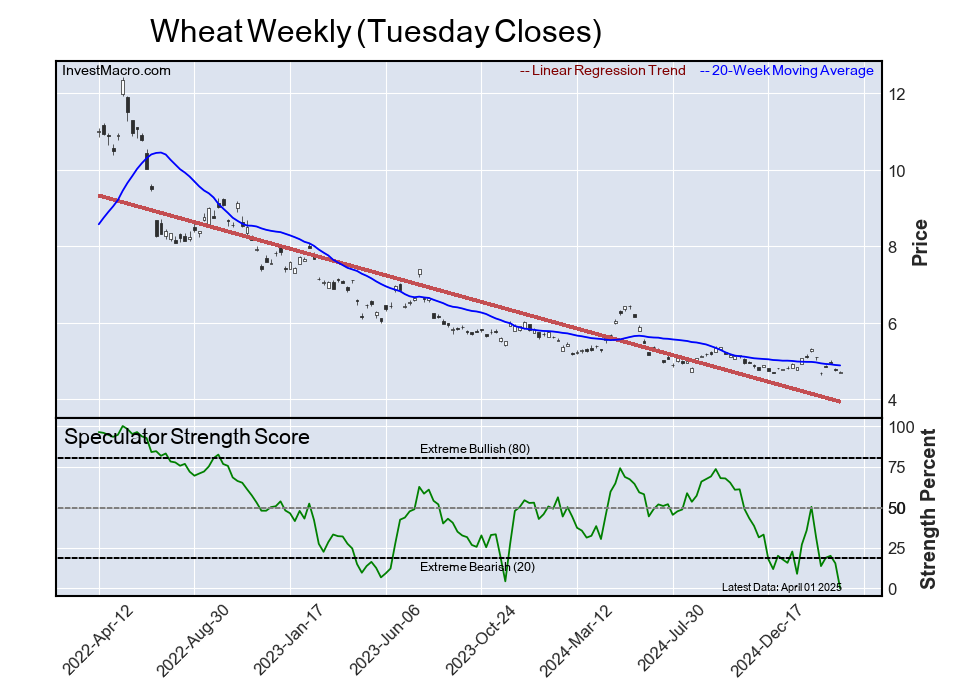
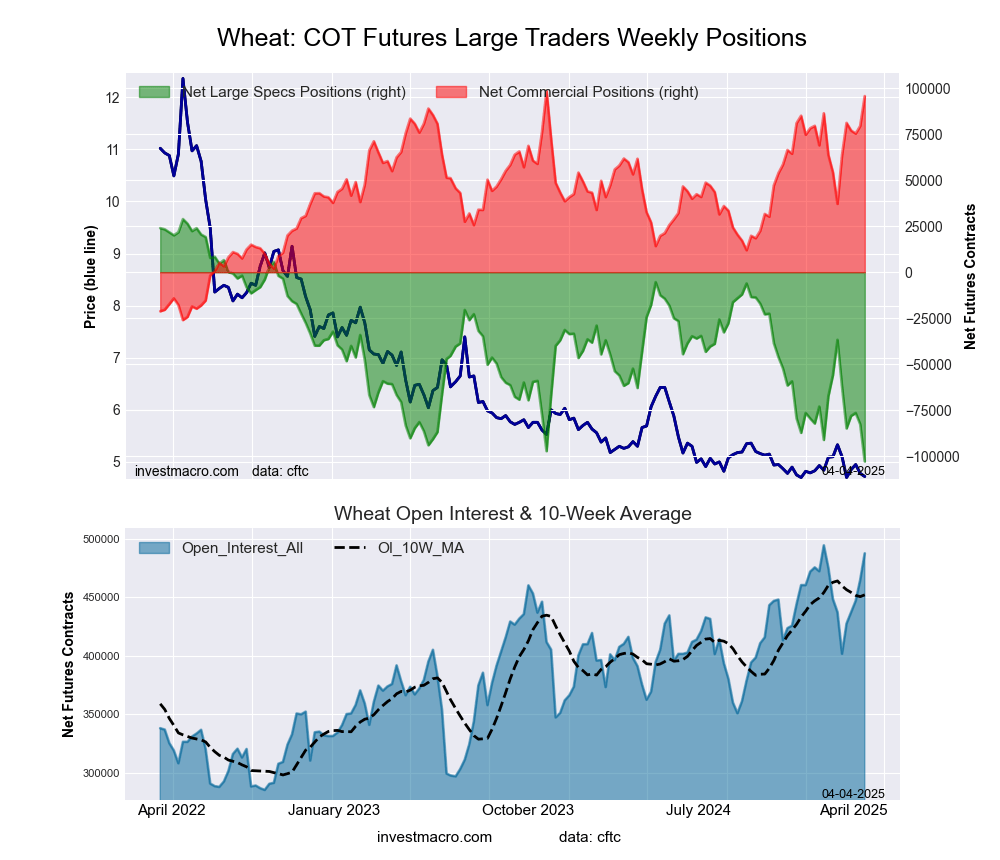
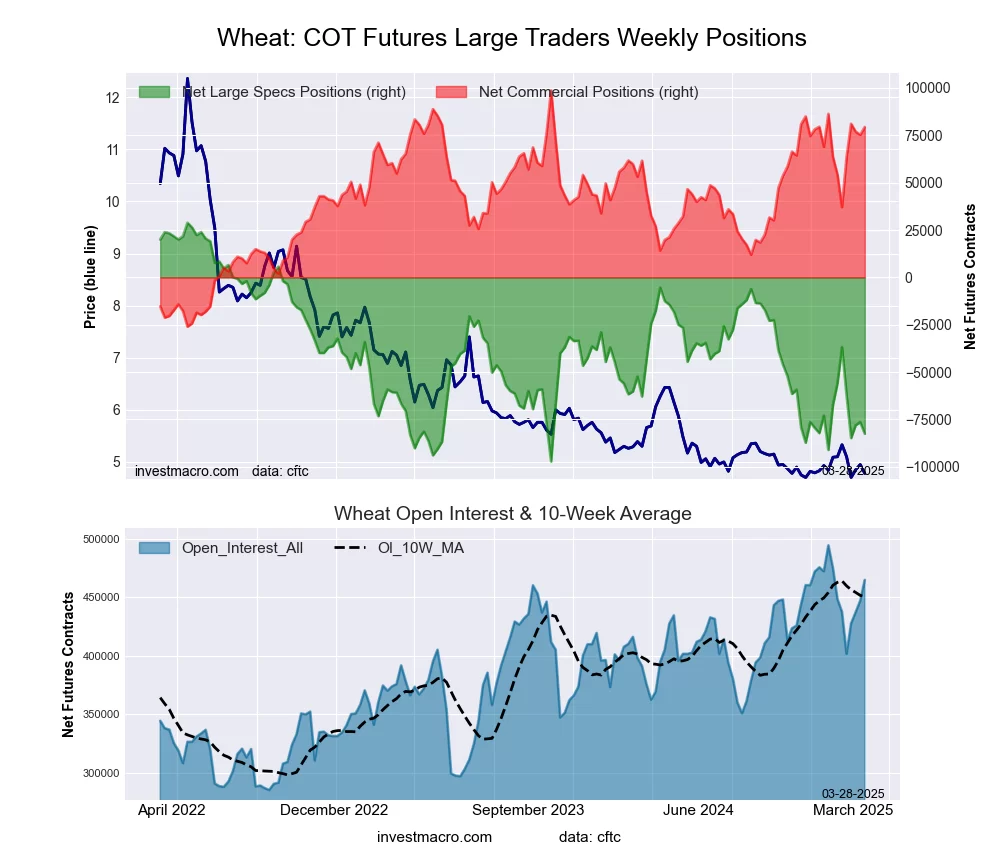
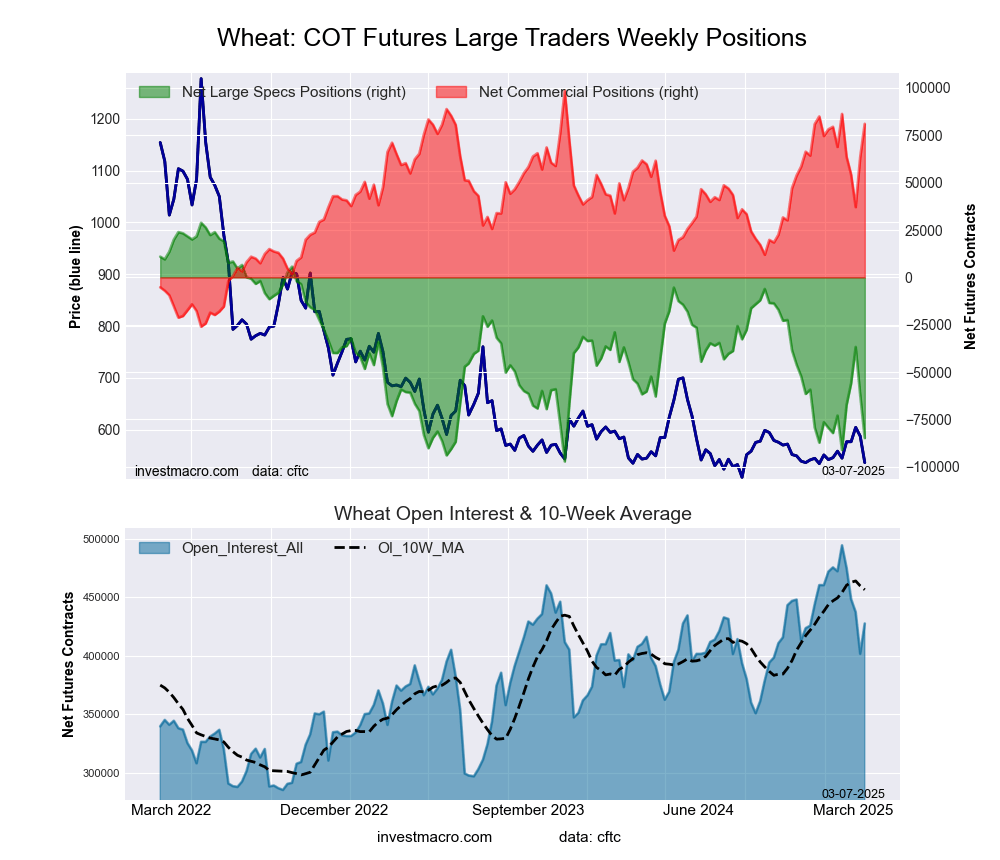
WHEAT Futures:
 The WHEAT large speculator standing this week was a net position of -93,969 contracts in the data reported through Tuesday. This was a weekly lowering of -5,643 contracts from the previous week which had a total of -88,326 net contracts.
This week’s current strength score (the trader positioning range over the past three years, measured from 0 to 100) shows the speculators are currently Bearish-Extreme with a score of 6.7 percent. The commercials are Bullish-Extreme with a score of 93.7 percent and the small traders (not shown in chart) are Bullish with a score of 74.4 percent.
Price Trend-Following Model: Strong Downtrend
Our weekly trend-following model classifies the current market price position as: Strong Downtrend.
| WHEAT Futures Statistics | SPECULATORS | COMMERCIALS | SMALL TRADERS |
| – Percent of Open Interest Longs: | 25.2 | 38.1 | 7.8 |
| – Percent of Open Interest Shorts: | 45.9 | 18.1 | 7.1 |
| – Net Position: | -93,969 | 90,745 | 3,224 |
| – Gross Longs: | 114,514 | 173,053 | 35,271 |
| – Gross Shorts: | 208,483 | 82,308 | 32,047 |
| – Long to Short Ratio: | 0.5 to 1 | 2.1 to 1 | 1.1 to 1 |
| NET POSITION TREND: | |||
| – Strength Index Score (3 Year Range Pct): | 6.7 | 93.7 | 74.4 |
| – Strength Index Reading (3 Year Range): | Bearish-Extreme | Bullish-Extreme | Bullish |
| NET POSITION MOVEMENT INDEX: | |||
| – 6-Week Change in Strength Index: | -12.1 | 11.1 | 11.6 |
Article By InvestMacro – Receive our weekly COT Newsletter
*COT Report: The COT data, released weekly to the public each Friday, is updated through the most recent Tuesday (data is 3 days old) and shows a quick view of how large speculators or non-commercials (for-profit traders) were positioned in the futures markets.
The CFTC categorizes trader positions according to commercial hedgers (traders who use futures contracts for hedging as part of the business), non-commercials (large traders who speculate to realize trading profits) and nonreportable traders (usually small traders/speculators) as well as their open interest (contracts open in the market at time of reporting). See CFTC criteria here.