Auguste Rodin (1840-1917) was a famous French sculptor that chiseled out “The Thinker” shown above and featured in the highly-popular television series “The Many Loves of Dobie Gillis” as a background set piece.
It is the likeness of a man immersed in “rumination” as if obsessed with a conundrum such that when I was conjuring up a theme for this weekend’s weekly missive, had a mirror been close by, I may have observed Rodin’s masterpiece in lieu of my pitiable visage.
It was John Maynard Keynes that once remarked that “When the facts change, I change my mind.” And it was only after decades of stubborn resistance to any new information challenging my original investment thesis that I learned to embrace it.
That is one of the many cognitive biases that plague investors with this one known as confirmation bias. You seek out only the research and related articles that confirm your original premise for owning something.
The reason I mention this is that the current set of conditions that surround equity markets are sending off conflicting signals.
They say that “beauty is in the eye of the beholder,” but that also applies to “ugliness.” And this market is both.
The last barrage of fundamental data was about as ugly as it comes but when it comes to the technical picture, not so much. Just as “The Thinker” sits mesmerized as he stares down at the floor, many of us are also perplexed, although I do remain a cautious, short-term bull on stocks as well as a pound-the-table bull on gold.
Positive also on the electrification metals and on nuclear energy, I also see selected lithium names with near-term proximity to production at the forefront.
However, as these are amongst the most difficult markets I can ever recall, I empathize with Rodin’s sculpture.
S&P
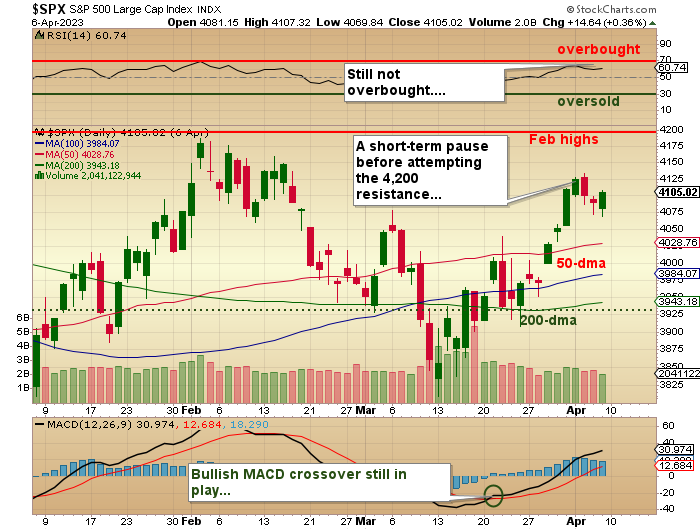
The chart of the S&P 500 (“SPX”) is about as inoffensive as one could expect after stocks shrugged off several bank “runs” in March and more than a few mini-panics in North America and Europe. Goldman Sachs believes that the lows reached in October of 2022 may have been “THE” lows for the correction and that all-time highs will soon arrive, bypassing the most-heavily predicted recession in world history.
Three weeks ago, Morgan Stanley’s Michael Wilson was warning people of a “20% downside” for the markets before the bear market is over but now says (in very fine print) “for some stocks” as bearish rhetoric eases and forecasts are delivered in increasingly “couched” manners.
I felt like I was doing my rendition of a toilet seat lid at a frat house “kegger” all through March, as the vagary of direction had me wanting to chase breakouts one day and then selling breakdowns the next. Up, down, bullish, bearish – these are the types of choppy markets that drive trend traders crazy. What I am forced to do is refer back to four and half decades of built-up scar tissue to attempt to glean some distant recognition of a pattern or series of patterns that rings a bell, and it was just last evening as I scanned the stock index section of my chart book did I find myself in the agony of self-doubt.
As you will recall, I said one week ago that I thought that “The Bull is Back” with the SPX finally achieving escape velocity above that narrow band where 50, 100, and 200-DMA lines were all clustered together.
Last week, however, the JOLTS and ADP reports threw cold water on the technical heat resulting in a stall of sorts, and if there is anything more doubt-instilling after dodging the jaws of the meat grinder trading range, it is the dreaded stall.
At times like these, I pour myself a cup of Chai tea and gaze out over the lovely swamp called “Lake” Scugog, now devoid of ice after all the wind and rain of yesterday’s tempest, at which point I am reminded of a lecture once administered by a mentor back in the 1980s in which he swore black-and-blue that no bull market could endure without the cooperation and participation of the banks.
Mind you, the banks of the 1980s are mere shadows of the banks of the 2020s as they refrained back then from any of those “shenanigans of speculation” so commonplace today. Nevertheless, banks are banks, and they are important from a technical perspective, acting as a confirming indicator of the health (or fragility) of any market advance.
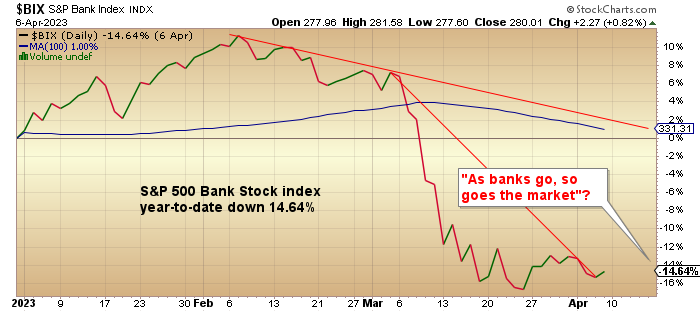
Despite a 4.5% rebound, the S&P Bank Index is still off 14.64% year-to-date, which really throws a technical damper over the set-up for stocks, albeit nothing as of yet terminal.
I draw this to your attention because whether you are trading tech or crypto or metals or energy, those sub-sectors are all heavily correlated to the SPX, and as we witnessed in 2008, 2020, and 2022, when they take the broad markets down, everything goes with it — or as that mentor of mine used to say, “When they raid the wh*** house, they take all the ladies, even the piano player.” (Please forgive the rather crass analogy.)
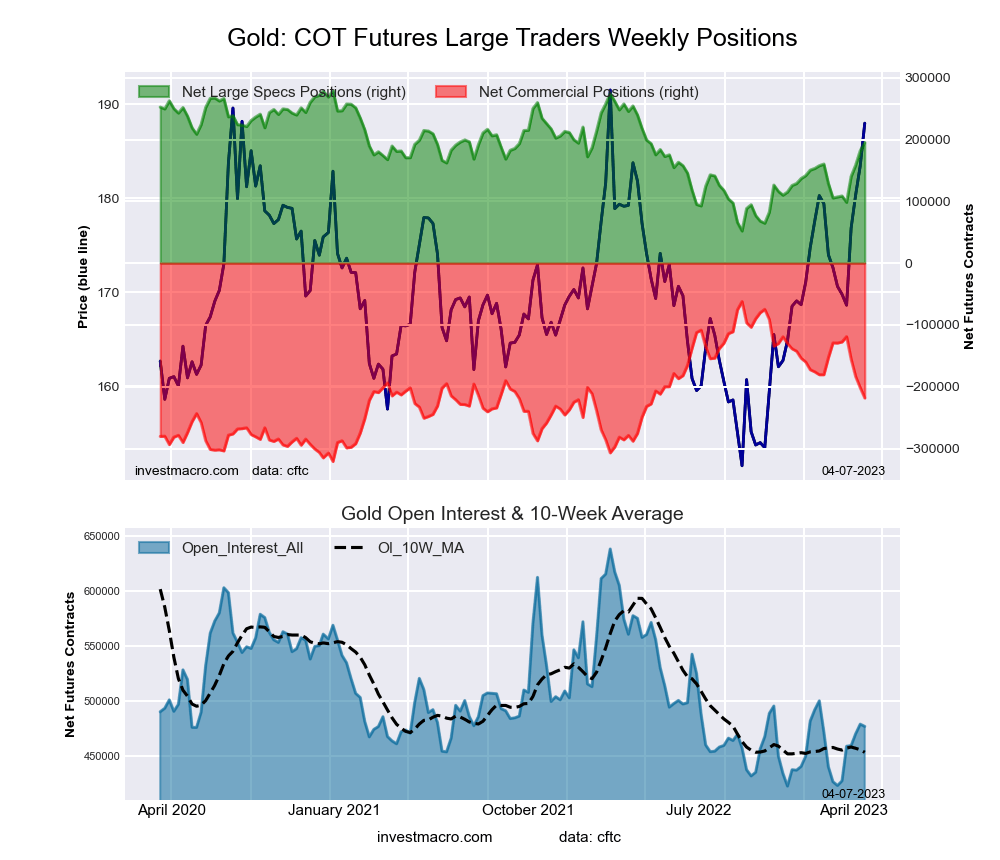
Gold
In keeping with the theme of “unavoidable correlation,” while it is important to remember that gold did not go unaffected by the events of 2008 and 2020, there have been two memorable stock market corrections in my recollective wheelhouse that stand out.
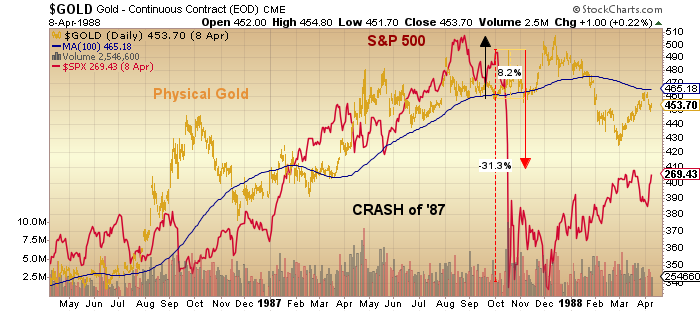
The first was October 19 to October 26th, 1987 — the Crash of ’87 — when I was 100%-invested in the senior and junior gold miners as a means of protecting my clients from a serious correction in stock prices which had advanced from Dow Jones 865 to 2,720 in five years sporting an average P/E of over 30 just before the Crash.
That year, there was an inverse correlation between the stock market and gold bullion prices, but it was a very sneaky affair, where the miners related to gold bullion decided to run for the exits along with the panicked equity bulls while physical gold bullion rallied from around US$425 to US$505. Where the lesson of 1987 was absolutely seared into my synapses was watching the TSE Gold and Silver Index ignore physical bullion’s 8% advance over the next four days and get cut in half – 10,300 to under 5,000 despite an US$80/ounce jump in spot gold.
Not only was it shocking, it was cruel.
The other time there was a departure from the correlation with equities was in the past fifteen months.
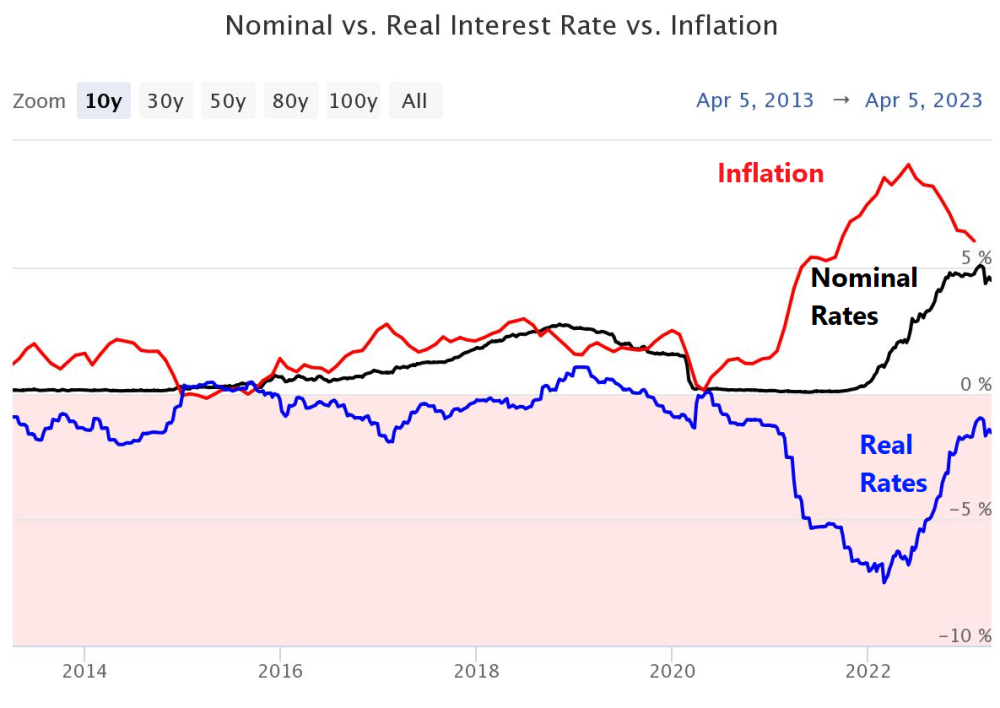
Since the date the SPX topped on January 7, 2022, gold is up 11.68% versus the 10.8% drop in the SPX, and while both 2008 and 2020 were liquidity-starved crashes, 2022 was an orderly decline which speaks even more loudly for gold’s performance.
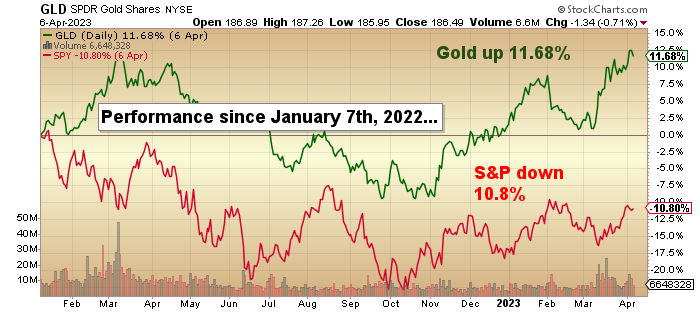
Because rising real interest rates are the mortal enemy of the gold bug, that real rates have actually been moving in that very time frame from deeply negative (- 7.51%) to mildly negative (- 1.56%) while gold moves to within 3% of (USD) all-time high prices is amazing.
There is a really fascinating interview with geopolitical analyst Peter Zeihan, one of my favorite research sources, and in the interest of giving full credit to where it absolutely deserves to be, his assessment of the inflationary outlook here in 2023 is brilliant and one to which I fully subscribe.
You see, from 1990 until March 2020 (the arrival of the pandemic), the world enjoyed three decades of cheap Asian labor, cheap energy, and cheap capital. The forces of disinflation could not have been scripted any better than in an era in which major improvements in access to the global supply chain were made. By 2020, the trade routes of the seas were like the L.A. Expressway, with the oversupply of dollar store electronics and obsolete air conditioners sitting idle in offshore queues in major western ports.
However, with the shutdown in the global economy by dim-sighted politicians and underqualified medical hacks, the supply chain was irreversibly altered. With the playing field no longer favoring cheap Chinese labor and open-armed American markets, things are simply going to cost more.
Zeihan thinks we will run a 9% CPI for the next fifteen years providing that North America moves quickly to repatriate its once-formidable, post-WWII manufacturing juggernaut as the required resources tilt hard at commodity supplies (and therefore prices). Without this rebuild of the American Middle Class, he sees 15% CPI because, as Zeihan says with such masterful bluntness, “the supply chain is screwed, and stuff will be harder to get.”
As I am watching the carp already starting to flop around the shoreline of the Scugog Swamp in a grotesque mating ritual too bizarre for words, I ruminate on the role of gold given the global outlook described by Zeihan.
Absent any of the counterparty risks associated with virtually every other asset class, physical metals do not need any permissions in order for the owner to transact. I think that when the world suddenly wakes up to the reality of what actually happened at FTX or Silicon Valley Bank (and what was about to happen at Credit Suisse), they will opt for the unimpaired status of owning gold bullion over everything else.
Furthermore, when the generalist money managers decide to shift 1% of their AUM into gold, the impact upon such a comparatively minuscule market cap will be gargantuan in scale. As one walks down the aisle of valuation analysis, the “perfect storm” for gold miners is rising gold prices, declining energy prices, and negative real interest rates.
With the major cost input being diesel fuel for producers as well as timber and concrete for developers, profit margins are widening rapidly while, for the first time since the 1930s, liberal dividend policies are attracting a different breed of investor to an asset class current under-loved and under-owned, an ideal prerequisite for opportune accumulation.
Michael Ballanger Disclaimer:
This letter makes no guarantee or warranty on the accuracy or completeness of the data provided. Nothing contained herein is intended or shall be deemed to be investment advice, implied or otherwise. This letter represents my views and replicates trades that I am making but nothing more than that. Always consult your registered advisor to assist you with your investments. I accept no liability for any loss arising from the use of the data contained on this letter. Options and junior mining stocks contain a high level of risk that may result in the loss of part or all invested capital and therefore are suitable for experienced and professional investors and traders only. One should be familiar with the risks involved in junior mining and options trading and we recommend consulting a financial adviser if you feel you do not understand the risks involved.
Disclosures:
1) Michael J. Ballanger: I, or members of my immediate household or family, own securities of the following companies mentioned in this article: None. I personally am, or members of my immediate household or family are, paid by the following companies mentioned in this article: None.
2) The following companies mentioned in this article are billboard sponsors of Streetwise Reports: None. Click here for important disclosures about sponsor fees. As of the date of this article, an affiliate of Streetwise Reports has a consulting relationship with: None. Please click here for more information.
3) Statements and opinions expressed are the opinions of the author and not of Streetwise Reports or its officers. The author is wholly responsible for the validity of the statements. The author was not paid by Streetwise Reports for this article. Streetwise Reports was not paid by the author to publish or syndicate this article. Streetwise Reports requires contributing authors to disclose any shareholdings in, or economic relationships with, companies that they write about. Streetwise Reports relies upon the authors to accurately provide this information and Streetwise Reports has no means of verifying its accuracy.
4) This article does not constitute investment advice. Each reader is encouraged to consult with his or her individual financial professional and any action a reader takes as a result of information presented here is his or her own responsibility. By opening this page, each reader accepts and agrees to Streetwise Reports’ terms of use and full legal disclaimer. This article is not a solicitation for investment. Streetwise Reports does not render general or specific investment advice and the information on Streetwise Reports should not be considered a recommendation to buy or sell any security. Streetwise Reports does not endorse or recommend the business, products, services or securities of any company mentioned on Streetwise Reports.
5) From time to time, Streetwise Reports LLC and its directors, officers, employees or members of their families, as well as persons interviewed for articles and interviews on the site, may have a long or short position in securities mentioned. Directors, officers, employees or members of their immediate families are prohibited from making purchases and/or sales of those securities in the open market or otherwise from the time of the decision to publish an article until three business days after the publication of the article. The foregoing prohibition does not apply to articles that in substance only restate previously published company releases.


