
By InvestMacro
Here are the latest charts and statistics for the Commitment of Traders (COT) reports data published by the Commodities Futures Trading Commission (CFTC).
The latest COT data is updated through Tuesday March 21st and shows a quick view of how large traders (for-profit speculators and commercial hedgers) were positioned in the futures markets.
* This COT data is fully up-to-date after weeks of delays due to a cybersecurity event that happened in early February to ION Cleared Derivatives (a subsidiary of ION Markets). The hacking incident had disrupted the ability for the CFTC to report large trader positions.
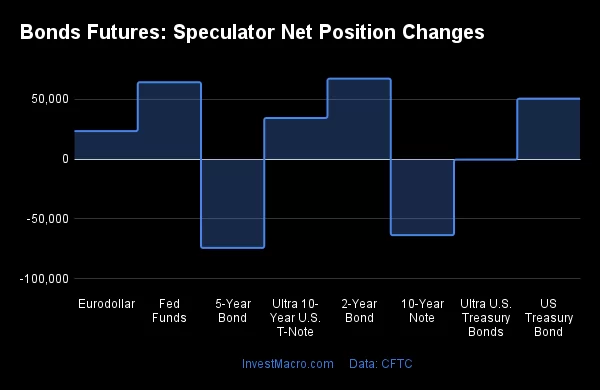
Weekly Speculator Changes led by 2-Year Bonds & Fed Funds
Free Reports:
 Sign Up for Our Stock Market Newsletter – Get updated on News, Charts & Rankings of Public Companies when you join our Stocks Newsletter
 Get our Weekly Commitment of Traders Reports - See where the biggest traders (Hedge Funds and Commercial Hedgers) are positioned in the futures markets on a weekly basis.
The COT bond market speculator bets were higher this week as five out of the eight bond markets we cover had higher positioning while the other three markets had lower speculator contracts.
Leading the gains for the bond markets was the 2-Year Bonds (67,316 contracts) with the Fed Funds (64,355 contracts), US Treasury Bonds (50,579 contracts), the Ultra 10-Year Bonds (34,396 contracts) and the Eurodollar (23,399 contracts) also showing positive weeks.
The bond markets with declines in speculator bets for the week were the 5-Year Bonds (-74,356 contracts), the 10-Year Bonds (-63,663 contracts) and the Ultra Treasury Bonds (-436 contracts) also registering lower bets on the week.
2-Year Bonds bets rising after record low
Highlighting the COT bond’s data this week is the rapid improvement of the speculator positioning in the 2-Year Bonds. Large speculative positions for the 2-Year Bond rose this week for a fifth consecutive week and by a total of 232,489 contracts in just the past five weeks. The 2-Year Bond speculator positions hit an all-time record low of -696,686 net contracts on February 14th before starting this recent five-week positive streak that has taken the current net position down to -464,197 contracts. This week’s net position marks the least bearish level of the past nine weeks.
The 2-Year Bond futures price have rebounded sharply over the past month due to a combination of a banking crisis and the sentiment that the Federal Reserve will slow or pause the pace of interest rate increases. According to the CME FedWatch Tool at the current time, traders expect the Fed to raise interest rates by 25 basis points in May but as the calendar progresses, traders are starting to forecast that the Fed will be cutting rates before the end of this year. Rate cuts would positively effect the bonds markets and especially the 2-Year as it is heavily influenced by Fed policy on the shorter end of the yield curve. This week the 2-Year Bond futures price closed near 103.29 and at the highest close since September.
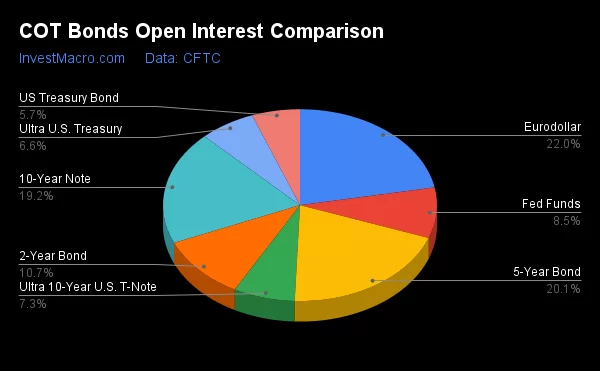
| Mar-21-2023 | OI | OI-Index | Spec-Net | Spec-Index | Com-Net | COM-Index | Smalls-Net | Smalls-Index |
|---|---|---|---|---|---|---|---|---|
| Eurodollar | 4,779,104 | 0 | -637,971 | 58 | 833,869 | 42 | -195,898 | 61 |
| FedFunds | 1,847,792 | 76 | -24,352 | 37 | 30,578 | 64 | -6,226 | 79 |
| 2-Year | 2,314,664 | 49 | -464,197 | 30 | 444,096 | 70 | 20,101 | 65 |
| Long T-Bond | 1,235,097 | 67 | -99,413 | 52 | 43,617 | 26 | 55,796 | 100 |
| 10-Year | 4,155,764 | 76 | -571,029 | 7 | 540,067 | 79 | 30,962 | 91 |
| 5-Year | 4,350,302 | 97 | -631,568 | 12 | 626,445 | 83 | 5,123 | 82 |
Strength Scores led by Eurodollar & US Treasury Bonds
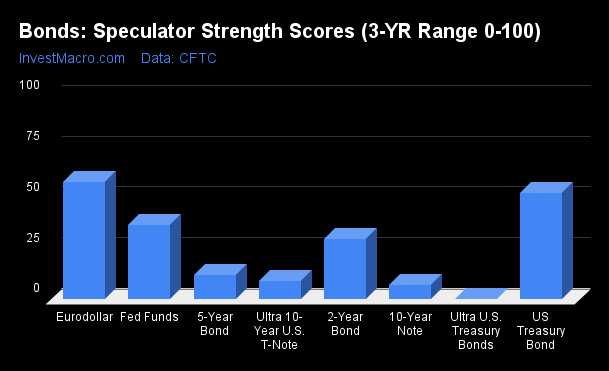
COT Strength Scores (a normalized measure of Speculator positions over a 3-Year range, from 0 to 100 where above 80 is Extreme-Bullish and below 20 is Extreme-Bearish) showed that the Eurodollar (58 percent) and the US Treasury Bonds (52 percent) lead the bond markets this week. The Fed Funds (37 percent) comes in as the next highest in the weekly strength scores.
On the downside, the Ultra Treasury Bonds (0 percent), the 10-Year Bonds (7 percent) and the Ultra 10-Year Bonds (9 percent) come in at the lowest strength level currently and are all in Extreme-Bearish territory (below 20 percent).
Strength Statistics:
Fed Funds (36.6 percent) vs Fed Funds previous week (28.7 percent)
2-Year Bond (29.6 percent) vs 2-Year Bond previous week (21.1 percent)
5-Year Bond (12.2 percent) vs 5-Year Bond previous week (21.2 percent)
10-Year Bond (7.0 percent) vs 10-Year Bond previous week (14.9 percent)
Ultra 10-Year Bond (9.3 percent) vs Ultra 10-Year Bond previous week (2.1 percent)
US Treasury Bond (52.2 percent) vs US Treasury Bond previous week (35.8 percent)
Ultra US Treasury Bond (0.0 percent) vs Ultra US Treasury Bond previous week (0.2 percent)
Eurodollar (57.7 percent) vs Eurodollar previous week (57.1 percent)
US Treasury Bonds & 2-Year Bonds top the 6-Week Strength Trends
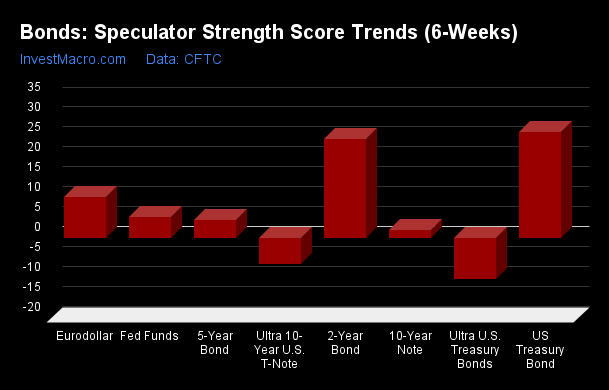
COT Strength Score Trends (or move index, calculates the 6-week changes in strength scores) showed that the US Treasury Bonds (27 percent) and the 2-Year Bonds (25 percent) lead the past six weeks trends for bonds. The Eurodollar (10 percent) is the next highest positive movers in the latest trends data.
The Ultra Treasury Bonds (-10 percent) leads the downside trend scores currently with the Ultra 10-Year Bonds (-7 percent) following next with a lower trend score.
Strength Trend Statistics:
Fed Funds (5.2 percent) vs Fed Funds previous week (-8.5 percent)
2-Year Bond (24.8 percent) vs 2-Year Bond previous week (5.8 percent)
5-Year Bond (4.5 percent) vs 5-Year Bond previous week (21.2 percent)
10-Year Bond (1.8 percent) vs 10-Year Bond previous week (5.9 percent)
Ultra 10-Year Bond (-6.7 percent) vs Ultra 10-Year Bond previous week (-12.5 percent)
US Treasury Bond (26.5 percent) vs US Treasury Bond previous week (16.0 percent)
Ultra US Treasury Bond (-10.3 percent) vs Ultra US Treasury Bond previous week (-4.3 percent)
Eurodollar (10.2 percent) vs Eurodollar previous week (9.4 percent)
Individual Bond Markets:
3-Month Eurodollars Futures:
 The 3-Month Eurodollars large speculator standing this week was a net position of -637,971 contracts in the data reported through Tuesday. This was a weekly lift of 23,399 contracts from the previous week which had a total of -661,370 net contracts.
This week’s current strength score (the trader positioning range over the past three years, measured from 0 to 100) shows the speculators are currently Bullish with a score of 57.7 percent. The commercials are Bearish with a score of 41.5 percent and the small traders (not shown in chart) are Bullish with a score of 61.3 percent.
| 3-Month Eurodollars Statistics | SPECULATORS | COMMERCIALS | SMALL TRADERS |
| – Percent of Open Interest Longs: | 7.0 | 66.8 | 5.3 |
| – Percent of Open Interest Shorts: | 20.4 | 49.4 | 9.4 |
| – Net Position: | -637,971 | 833,869 | -195,898 |
| – Gross Longs: | 334,819 | 3,193,023 | 251,700 |
| – Gross Shorts: | 972,790 | 2,359,154 | 447,598 |
| – Long to Short Ratio: | 0.3 to 1 | 1.4 to 1 | 0.6 to 1 |
| NET POSITION TREND: | |||
| – Strength Index Score (3 Year Range Pct): | 57.7 | 41.5 | 61.3 |
| – Strength Index Reading (3 Year Range): | Bullish | Bearish | Bullish |
| NET POSITION MOVEMENT INDEX: | |||
| – 6-Week Change in Strength Index: | 10.2 | -10.5 | 9.9 |
30-Day Federal Funds Futures:
 The 30-Day Federal Funds large speculator standing this week was a net position of -24,352 contracts in the data reported through Tuesday. This was a weekly gain of 64,355 contracts from the previous week which had a total of -88,707 net contracts.
This week’s current strength score (the trader positioning range over the past three years, measured from 0 to 100) shows the speculators are currently Bearish with a score of 36.6 percent. The commercials are Bullish with a score of 63.6 percent and the small traders (not shown in chart) are Bullish with a score of 78.8 percent.
| 30-Day Federal Funds Statistics | SPECULATORS | COMMERCIALS | SMALL TRADERS |
| – Percent of Open Interest Longs: | 8.8 | 76.6 | 2.2 |
| – Percent of Open Interest Shorts: | 10.1 | 74.9 | 2.6 |
| – Net Position: | -24,352 | 30,578 | -6,226 |
| – Gross Longs: | 161,900 | 1,414,738 | 41,466 |
| – Gross Shorts: | 186,252 | 1,384,160 | 47,692 |
| – Long to Short Ratio: | 0.9 to 1 | 1.0 to 1 | 0.9 to 1 |
| NET POSITION TREND: | |||
| – Strength Index Score (3 Year Range Pct): | 36.6 | 63.6 | 78.8 |
| – Strength Index Reading (3 Year Range): | Bearish | Bullish | Bullish |
| NET POSITION MOVEMENT INDEX: | |||
| – 6-Week Change in Strength Index: | 5.2 | -5.7 | 8.5 |
2-Year Treasury Note Futures:
 The 2-Year Treasury Note large speculator standing this week was a net position of -464,197 contracts in the data reported through Tuesday. This was a weekly advance of 67,316 contracts from the previous week which had a total of -531,513 net contracts.
This week’s current strength score (the trader positioning range over the past three years, measured from 0 to 100) shows the speculators are currently Bearish with a score of 29.6 percent. The commercials are Bullish with a score of 69.7 percent and the small traders (not shown in chart) are Bullish with a score of 65.4 percent.
| 2-Year Treasury Note Statistics | SPECULATORS | COMMERCIALS | SMALL TRADERS |
| – Percent of Open Interest Longs: | 6.3 | 84.6 | 8.1 |
| – Percent of Open Interest Shorts: | 26.4 | 65.5 | 7.3 |
| – Net Position: | -464,197 | 444,096 | 20,101 |
| – Gross Longs: | 146,530 | 1,959,237 | 188,296 |
| – Gross Shorts: | 610,727 | 1,515,141 | 168,195 |
| – Long to Short Ratio: | 0.2 to 1 | 1.3 to 1 | 1.1 to 1 |
| NET POSITION TREND: | |||
| – Strength Index Score (3 Year Range Pct): | 29.6 | 69.7 | 65.4 |
| – Strength Index Reading (3 Year Range): | Bearish | Bullish | Bullish |
| NET POSITION MOVEMENT INDEX: | |||
| – 6-Week Change in Strength Index: | 24.8 | -24.0 | -12.2 |
5-Year Treasury Note Futures:
 The 5-Year Treasury Note large speculator standing this week was a net position of -631,568 contracts in the data reported through Tuesday. This was a weekly lowering of -74,356 contracts from the previous week which had a total of -557,212 net contracts.
This week’s current strength score (the trader positioning range over the past three years, measured from 0 to 100) shows the speculators are currently Bearish-Extreme with a score of 12.2 percent. The commercials are Bullish-Extreme with a score of 82.7 percent and the small traders (not shown in chart) are Bullish-Extreme with a score of 82.4 percent.
| 5-Year Treasury Note Statistics | SPECULATORS | COMMERCIALS | SMALL TRADERS |
| – Percent of Open Interest Longs: | 8.9 | 82.4 | 7.7 |
| – Percent of Open Interest Shorts: | 23.5 | 68.0 | 7.6 |
| – Net Position: | -631,568 | 626,445 | 5,123 |
| – Gross Longs: | 389,000 | 3,586,593 | 335,724 |
| – Gross Shorts: | 1,020,568 | 2,960,148 | 330,601 |
| – Long to Short Ratio: | 0.4 to 1 | 1.2 to 1 | 1.0 to 1 |
| NET POSITION TREND: | |||
| – Strength Index Score (3 Year Range Pct): | 12.2 | 82.7 | 82.4 |
| – Strength Index Reading (3 Year Range): | Bearish-Extreme | Bullish-Extreme | Bullish-Extreme |
| NET POSITION MOVEMENT INDEX: | |||
| – 6-Week Change in Strength Index: | 4.5 | -1.4 | -6.8 |
10-Year Treasury Note Futures:
 The 10-Year Treasury Note large speculator standing this week was a net position of -571,029 contracts in the data reported through Tuesday. This was a weekly reduction of -63,663 contracts from the previous week which had a total of -507,366 net contracts.
This week’s current strength score (the trader positioning range over the past three years, measured from 0 to 100) shows the speculators are currently Bearish-Extreme with a score of 7.0 percent. The commercials are Bullish with a score of 79.3 percent and the small traders (not shown in chart) are Bullish-Extreme with a score of 91.0 percent.
| 10-Year Treasury Note Statistics | SPECULATORS | COMMERCIALS | SMALL TRADERS |
| – Percent of Open Interest Longs: | 9.1 | 80.1 | 9.0 |
| – Percent of Open Interest Shorts: | 22.9 | 67.1 | 8.2 |
| – Net Position: | -571,029 | 540,067 | 30,962 |
| – Gross Longs: | 379,104 | 3,329,656 | 372,551 |
| – Gross Shorts: | 950,133 | 2,789,589 | 341,589 |
| – Long to Short Ratio: | 0.4 to 1 | 1.2 to 1 | 1.1 to 1 |
| NET POSITION TREND: | |||
| – Strength Index Score (3 Year Range Pct): | 7.0 | 79.3 | 91.0 |
| – Strength Index Reading (3 Year Range): | Bearish-Extreme | Bullish | Bullish-Extreme |
| NET POSITION MOVEMENT INDEX: | |||
| – 6-Week Change in Strength Index: | 1.8 | -12.7 | 24.9 |
Ultra 10-Year Notes Futures:
 The Ultra 10-Year Notes large speculator standing this week was a net position of -158,126 contracts in the data reported through Tuesday. This was a weekly boost of 34,396 contracts from the previous week which had a total of -192,522 net contracts.
This week’s current strength score (the trader positioning range over the past three years, measured from 0 to 100) shows the speculators are currently Bearish-Extreme with a score of 9.3 percent. The commercials are Bullish-Extreme with a score of 81.0 percent and the small traders (not shown in chart) are Bullish with a score of 78.1 percent.
| Ultra 10-Year Notes Statistics | SPECULATORS | COMMERCIALS | SMALL TRADERS |
| – Percent of Open Interest Longs: | 9.8 | 77.7 | 11.2 |
| – Percent of Open Interest Shorts: | 19.8 | 63.8 | 15.0 |
| – Net Position: | -158,126 | 218,538 | -60,412 |
| – Gross Longs: | 153,805 | 1,224,366 | 176,050 |
| – Gross Shorts: | 311,931 | 1,005,828 | 236,462 |
| – Long to Short Ratio: | 0.5 to 1 | 1.2 to 1 | 0.7 to 1 |
| NET POSITION TREND: | |||
| – Strength Index Score (3 Year Range Pct): | 9.3 | 81.0 | 78.1 |
| – Strength Index Reading (3 Year Range): | Bearish-Extreme | Bullish-Extreme | Bullish |
| NET POSITION MOVEMENT INDEX: | |||
| – 6-Week Change in Strength Index: | -6.7 | -3.9 | 29.6 |
US Treasury Bonds Futures:
 The US Treasury Bonds large speculator standing this week was a net position of -99,413 contracts in the data reported through Tuesday. This was a weekly gain of 50,579 contracts from the previous week which had a total of -149,992 net contracts.
This week’s current strength score (the trader positioning range over the past three years, measured from 0 to 100) shows the speculators are currently Bullish with a score of 52.2 percent. The commercials are Bearish with a score of 26.2 percent and the small traders (not shown in chart) are Bullish-Extreme with a score of 100.0 percent.
| US Treasury Bonds Statistics | SPECULATORS | COMMERCIALS | SMALL TRADERS |
| – Percent of Open Interest Longs: | 8.3 | 77.7 | 13.7 |
| – Percent of Open Interest Shorts: | 16.4 | 74.2 | 9.2 |
| – Net Position: | -99,413 | 43,617 | 55,796 |
| – Gross Longs: | 102,678 | 959,632 | 169,332 |
| – Gross Shorts: | 202,091 | 916,015 | 113,536 |
| – Long to Short Ratio: | 0.5 to 1 | 1.0 to 1 | 1.5 to 1 |
| NET POSITION TREND: | |||
| – Strength Index Score (3 Year Range Pct): | 52.2 | 26.2 | 100.0 |
| – Strength Index Reading (3 Year Range): | Bullish | Bearish | Bullish-Extreme |
| NET POSITION MOVEMENT INDEX: | |||
| – 6-Week Change in Strength Index: | 26.5 | -36.2 | 16.3 |
Ultra US Treasury Bonds Futures:
 The Ultra US Treasury Bonds large speculator standing this week was a net position of -443,962 contracts in the data reported through Tuesday. This was a weekly fall of -436 contracts from the previous week which had a total of -443,526 net contracts.
This week’s current strength score (the trader positioning range over the past three years, measured from 0 to 100) shows the speculators are currently Bearish-Extreme with a score of 0.0 percent. The commercials are Bullish-Extreme with a score of 98.1 percent and the small traders (not shown in chart) are Bullish-Extreme with a score of 91.8 percent.
| Ultra US Treasury Bonds Statistics | SPECULATORS | COMMERCIALS | SMALL TRADERS |
| – Percent of Open Interest Longs: | 4.4 | 84.6 | 11.0 |
| – Percent of Open Interest Shorts: | 35.5 | 57.1 | 7.4 |
| – Net Position: | -443,962 | 391,927 | 52,035 |
| – Gross Longs: | 62,308 | 1,206,968 | 157,069 |
| – Gross Shorts: | 506,270 | 815,041 | 105,034 |
| – Long to Short Ratio: | 0.1 to 1 | 1.5 to 1 | 1.5 to 1 |
| NET POSITION TREND: | |||
| – Strength Index Score (3 Year Range Pct): | 0.0 | 98.1 | 91.8 |
| – Strength Index Reading (3 Year Range): | Bearish-Extreme | Bullish-Extreme | Bullish-Extreme |
| NET POSITION MOVEMENT INDEX: | |||
| – 6-Week Change in Strength Index: | -10.3 | 4.6 | 14.8 |
Article By InvestMacro – Receive our weekly COT Newsletter
*COT Report: The COT data, released weekly to the public each Friday, is updated through the most recent Tuesday (data is 3 days old) and shows a quick view of how large speculators or non-commercials (for-profit traders) were positioned in the futures markets.
The CFTC categorizes trader positions according to commercial hedgers (traders who use futures contracts for hedging as part of the business), non-commercials (large traders who speculate to realize trading profits) and nonreportable traders (usually small traders/speculators) as well as their open interest (contracts open in the market at time of reporting). See CFTC criteria here.

- COT Metals Charts: Weekly Speculator Bets see small gains for Silver & Gold Jul 12, 2026
- COT Bonds Charts: Speculator Bets led by SOFR 3-Months & 2-Year Bonds Jul 12, 2026
- COT Energy Charts: Weekly Speculator Changes led by Brent Oil Jul 12, 2026
- COT Soft Commodities Charts: Weekly Speculator Changes led by Sugar, Corn & Soybeans Jul 12, 2026
- The US and European stock indices are rising again amid renewed investor interest in the AI industry. Jul 10, 2026
- USD/JPY Falls as Yen Recovers Weekly Losses Jul 10, 2026
- Crude oil prices surged sharply by 7% in reaction to the rapid escalation of the conflict in the Middle East Jul 9, 2026
- Middle East Tensions Weigh on Gold Jul 9, 2026
- Pound Awaits Tighter Policy from Bank of England Jul 8, 2026
- The United States carried out airstrikes on Iran after Iran’s attacked tankers in the Strait of Hormuz. The RBNZ raised the interest rate to 2.5% Jul 8, 2026