
By InvestMacro
Here are the latest charts and statistics for the Commitment of Traders (COT) reports data published by the Commodities Futures Trading Commission (CFTC).
The latest COT data is updated through Tuesday April 18th and shows a quick view of how large traders (for-profit speculators and commercial entities) were positioned in the futures markets.
Weekly Speculator Changes led by Soybean Meal & Coffee
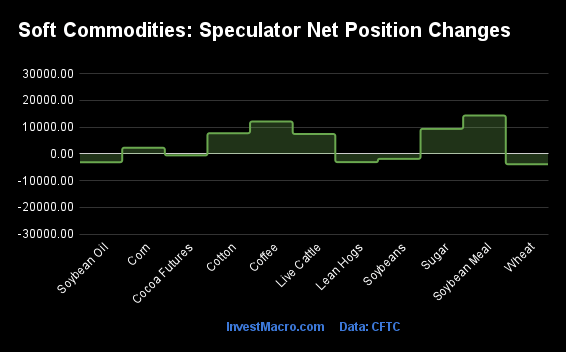
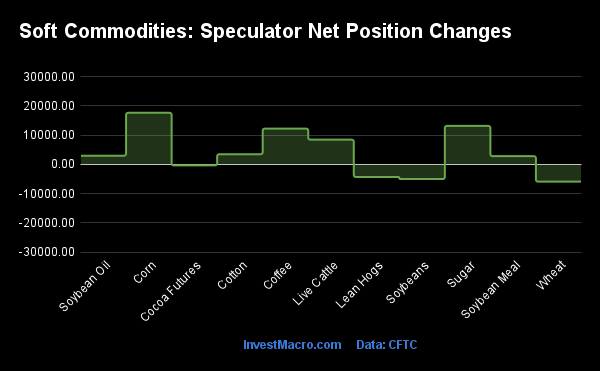
The COT soft commodities markets speculator bets were higher this week as six out of the eleven softs markets we cover had higher positioning while the other five markets had lower speculator contracts.
Leading the gains for the softs markets was Soybean Meal (14,357 contracts) with Coffee (12,124 contracts), Sugar (9,384 contracts), Cotton (7,749 contracts), Live Cattle (7,456 contracts) and Corn (2,327 contracts) also showing positive weeks.
The markets with the declines in speculator bets this week were Soybeans (-1,836 contracts) with Lean Hogs (-3,065 contracts), Soybean Oil (-3,095 contracts), Wheat (-3,854 contracts) and Cocoa (-558 contracts) also registering lower bets on the week.
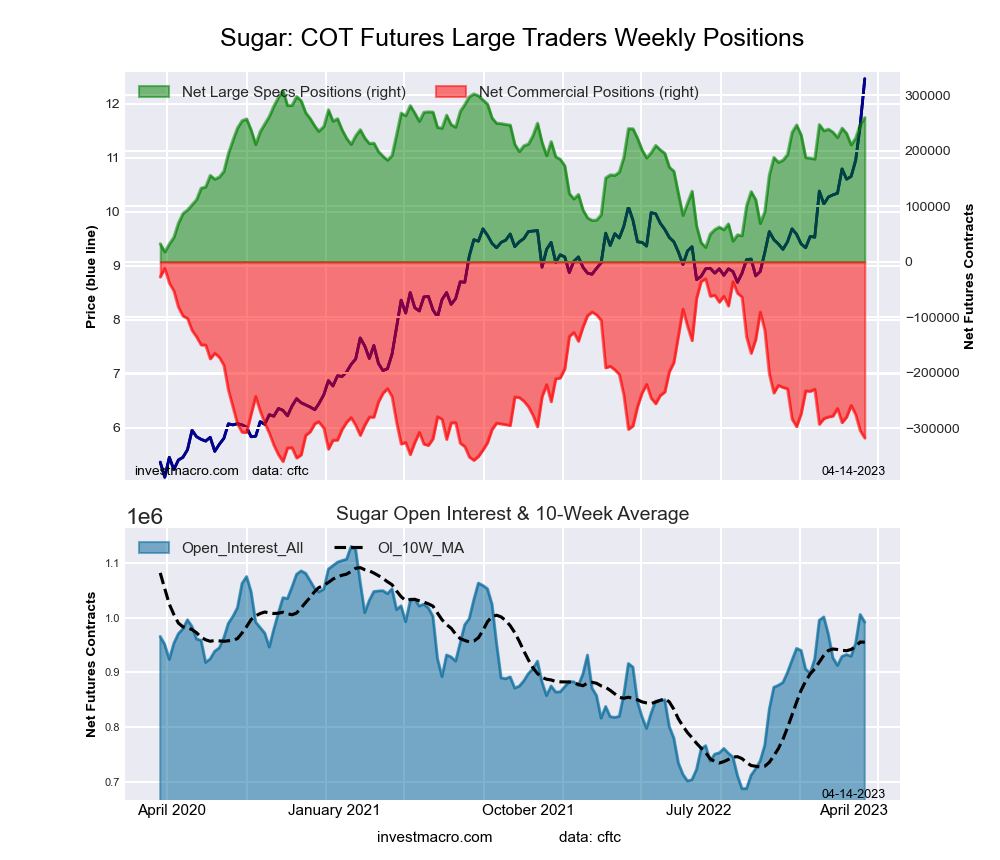
Sugar Speculators boost bullish bets for 4th week to 84-week high
Highlighting the COT soft commodities data this week is the continued bullish strength in the Sugar speculator’s positioning. The large speculator bets for Sugar rose this week for the fourth straight week and for the seventh time out of the past ten weeks. Speculators have added a total of +58,516 contracts to the net position over the past 4-week period.
The bullish sentiment has now pushed the Sugar net speculator positions to their highest level in the past 84-weeks, dating back to September 9th of 2021.
Sugar’s speculator strength score level (a 3-year range of speculator positions, on a 0-100 percent scale) has also increased with a score of 86.5 percent this week and up from a score of 83.3 percent last week. Its 6-week trend of strength scores has increased by 10 percent.
The Sugar futures price has also been flying high and touched its highest level since April of 2012 this week. The Sugar front-month futures price has risen for five consecutive weeks and closed at approximately $24.83 on Friday. Sugar futures are now up by over 40 percent since October.
| Apr-18-2023 | OI | OI-Index | Spec-Net | Spec-Index | Com-Net | COM-Index | Smalls-Net | Smalls-Index |
|---|---|---|---|---|---|---|---|---|
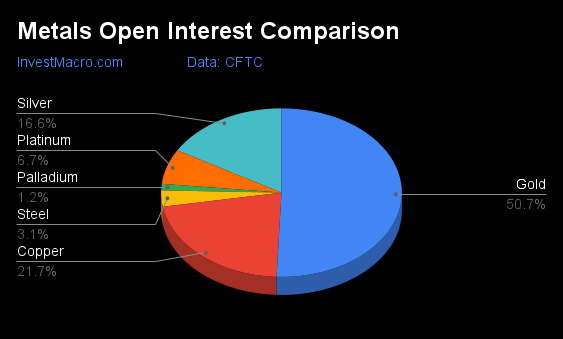
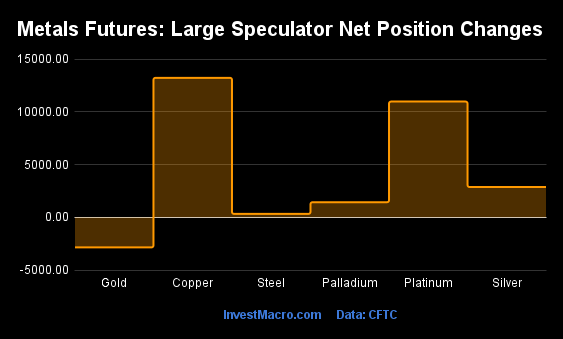
| WTI Crude | 1,913,192 | 46 | 244,575 | 21 | -273,247 | 78 | 28,672 | 47 |
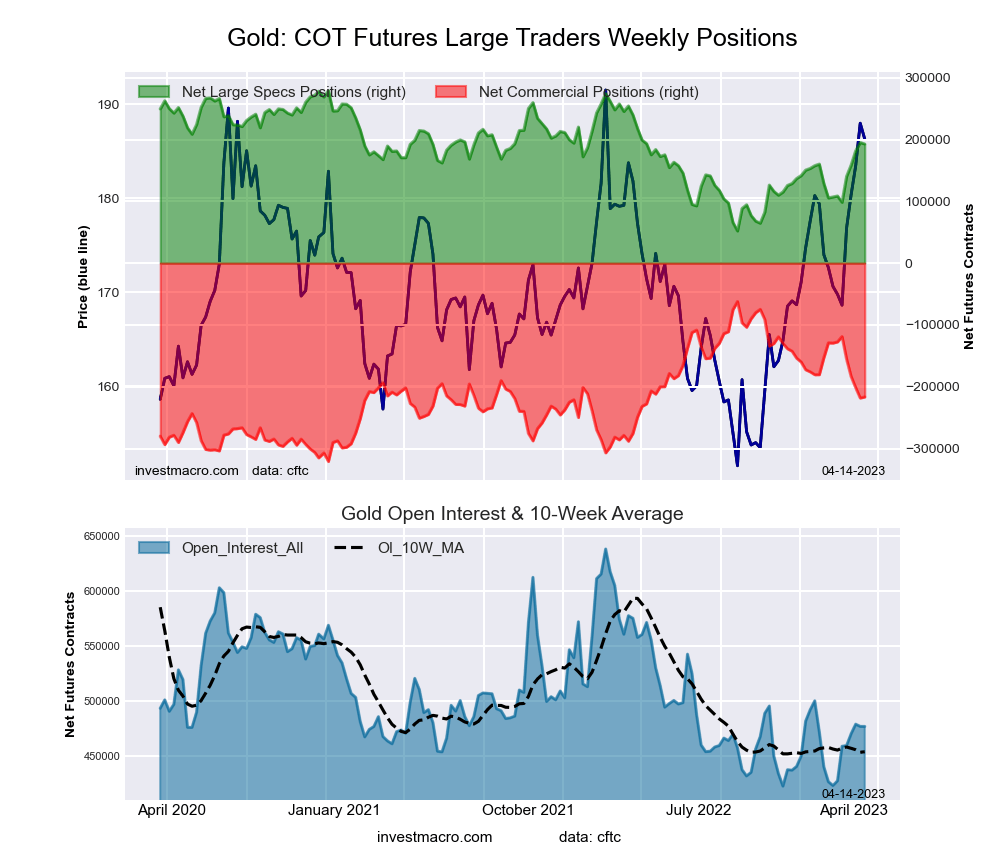
| Gold | 482,254 | 28 | 189,893 | 61 | -216,425 | 40 | 26,532 | 46 |
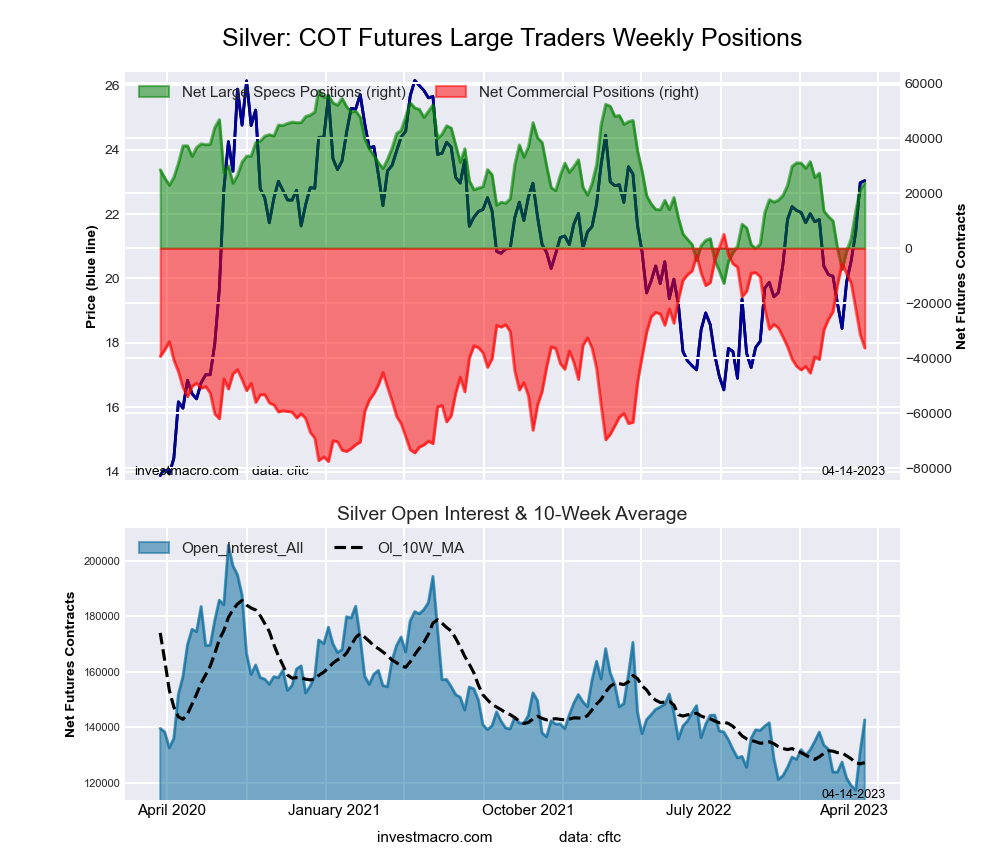
| Silver | 158,371 | 46 | 26,595 | 56 | -38,656 | 47 | 12,061 | 33 |
| Copper | 206,216 | 47 | 8,934 | 36 | -16,280 | 60 | 7,346 | 65 |
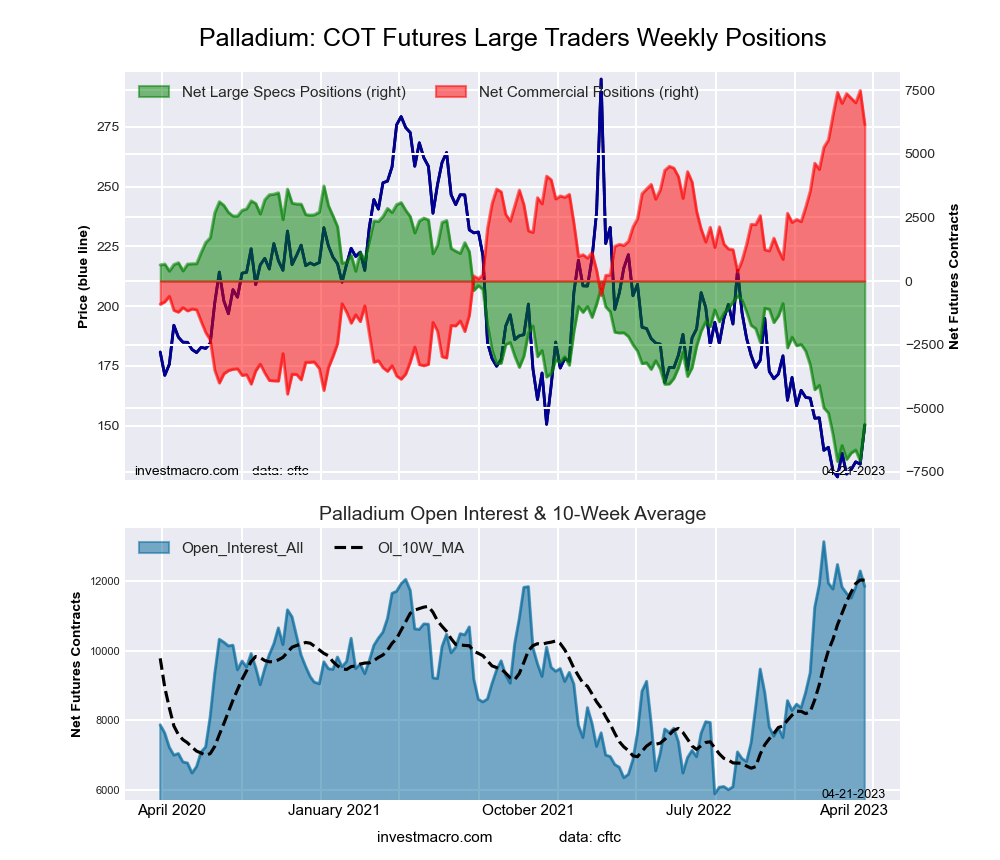
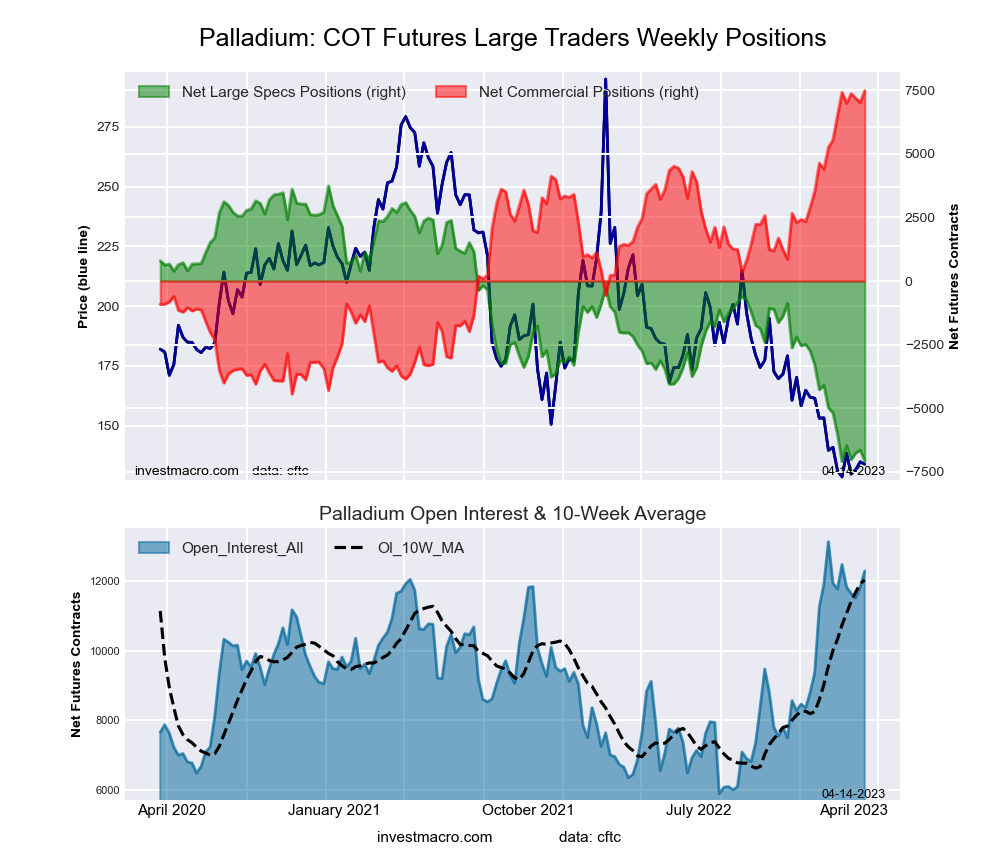
| Palladium | 11,848 | 82 | -5,637 | 13 | 6,151 | 89 | -514 | 11 |
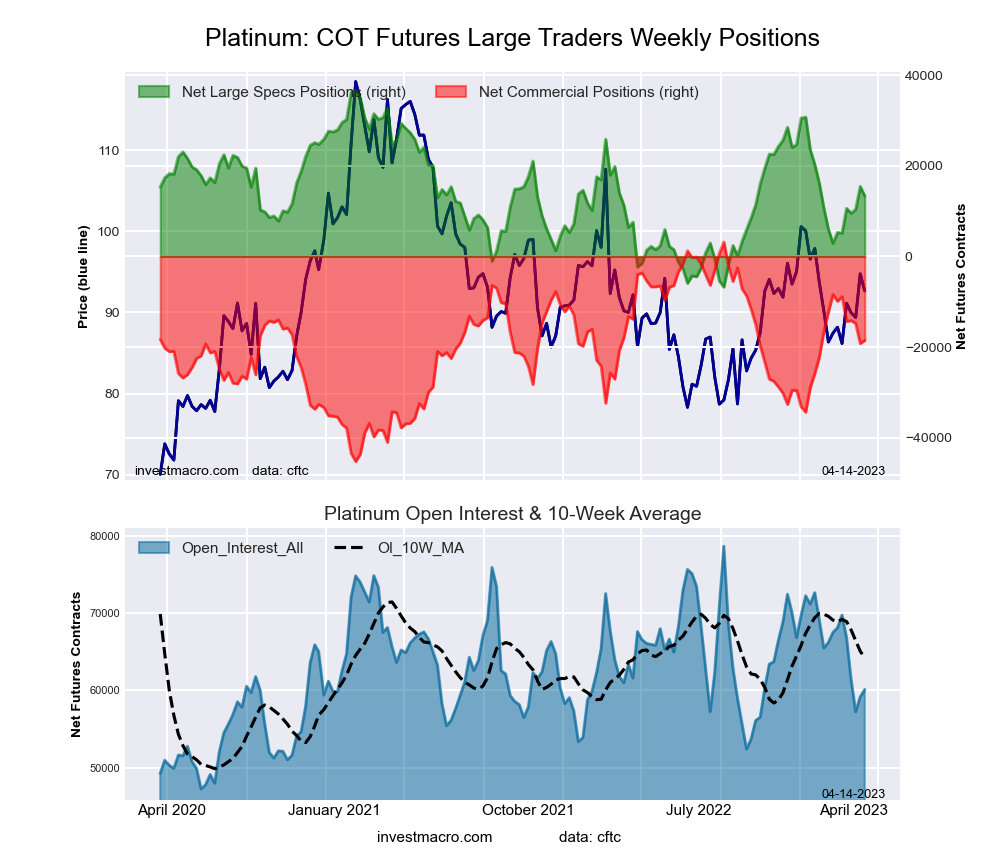
| Platinum | 63,794 | 53 | 24,319 | 72 | -28,202 | 35 | 3,883 | 20 |
| Natural Gas | 1,330,947 | 74 | -139,986 | 16 | 111,893 | 84 | 28,093 | 47 |
| Brent | 146,384 | 10 | -43,322 | 20 | 39,827 | 80 | 3,495 | 56 |
| Heating Oil | 260,459 | 20 | 8,865 | 43 | -24,987 | 65 | 16,122 | 54 |
| Soybeans | 683,161 | 24 | 177,510 | 59 | -149,491 | 45 | -28,019 | 25 |
| Corn | 1,319,551 | 17 | 105,636 | 44 | -41,244 | 66 | -64,392 | 14 |
| Coffee | 190,253 | 5 | 37,001 | 65 | -38,309 | 38 | 1,308 | 28 |
| Sugar | 961,060 | 62 | 269,172 | 86 | -326,198 | 10 | 57,026 | 78 |
| Wheat | 378,531 | 54 | -70,536 | 2 | 65,243 | 95 | 5,293 | 98 |
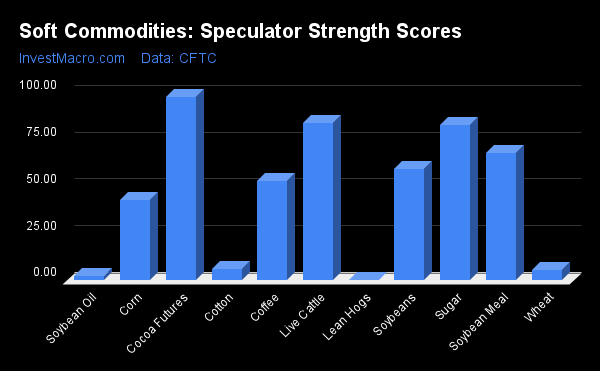
Strength Scores led by Cocoa & Live Cattle
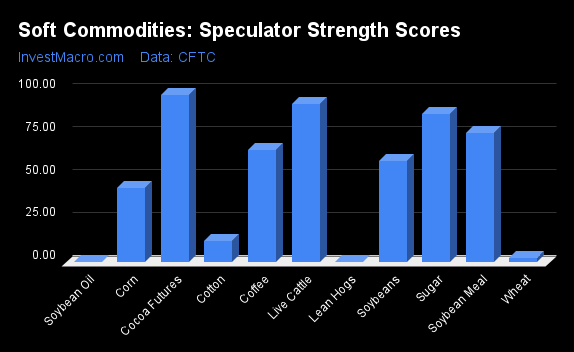
COT Strength Scores (a normalized measure of Speculator positions over a 3-Year range, from 0 to 100 where above 80 is Extreme-Bullish and below 20 is Extreme-Bearish) showed that Cocoa (98 percent) and Live Cattle (93 percent) lead the softs markets this week. Sugar (86 percent), Soybean Meal (76 percent) and Coffee (65 percent) come in as the next highest in the weekly strength scores.
On the downside, Lean Hogs (0 percent), Soybean Oil (0 percent), Wheat (2 percent) and the Cotton (12 percent) come in at the lowest strength levels currently and are all in Extreme-Bearish territory (below 20 percent).
Strength Statistics:
Corn (43.5 percent) vs Corn previous week (43.2 percent)
Sugar (86.5 percent) vs Sugar previous week (83.3 percent)
Coffee (65.4 percent) vs Coffee previous week (52.9 percent)
Soybeans (58.9 percent) vs Soybeans previous week (59.6 percent)
Soybean Oil (0.0 percent) vs Soybean Oil previous week (2.1 percent)
Soybean Meal (75.6 percent) vs Soybean Meal previous week (68.1 percent)
Live Cattle (92.5 percent) vs Live Cattle previous week (84.2 percent)
Lean Hogs (0.0 percent) vs Lean Hogs previous week (2.7 percent)
Cotton (12.1 percent) vs Cotton previous week (6.2 percent)
Cocoa (97.6 percent) vs Cocoa previous week (98.3 percent)
Wheat (2.3 percent) vs Wheat previous week (5.5 percent)
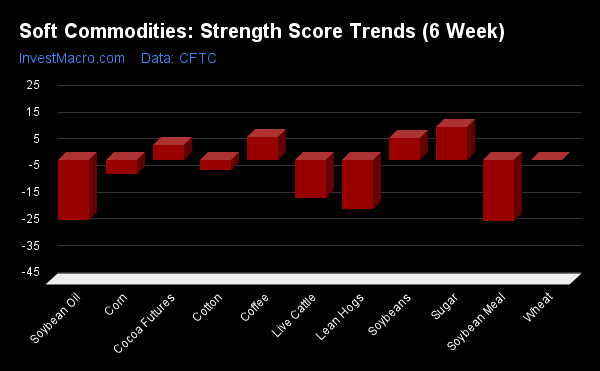
Coffee & Sugar top the 6-Week Strength Trends
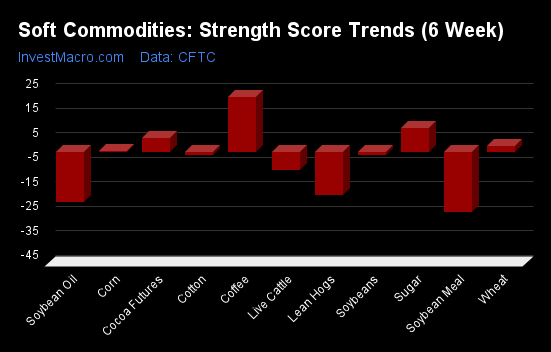
COT Strength Score Trends (or move index, calculates the 6-week changes in strength scores) showed that Coffee (22 percent) and Sugar (10 percent) lead the past six weeks trends for soft commodities. Cocoa (6 percent) and Wheat (2 percent) are the next highest positive movers in the latest trends data.
Soybean Meal (-24 percent) leads the downside trend scores currently with Soybean Oil (-21 percent), Lean Hogs (-17 percent) and Live Cattle (-7 percent) following next with lower trend scores.
Strength Trend Statistics:
Corn (0.3 percent) vs Corn previous week (-5.1 percent)
Sugar (9.8 percent) vs Sugar previous week (12.4 percent)
Coffee (22.5 percent) vs Coffee previous week (8.7 percent)
Soybeans (-1.1 percent) vs Soybeans previous week (8.2 percent)
Soybean Oil (-20.6 percent) vs Soybean Oil previous week (-22.5 percent)
Soybean Meal (-24.4 percent) vs Soybean Meal previous week (-22.7 percent)
Live Cattle (-7.5 percent) vs Live Cattle previous week (-14.2 percent)
Lean Hogs (-17.5 percent) vs Lean Hogs previous week (-17.9 percent)
Cotton (-1.1 percent) vs Cotton previous week (-3.8 percent)
Cocoa (5.9 percent) vs Cocoa previous week (5.7 percent)
Wheat (2.3 percent) vs Wheat previous week (0.1 percent)
Individual Soft Commodities Markets:
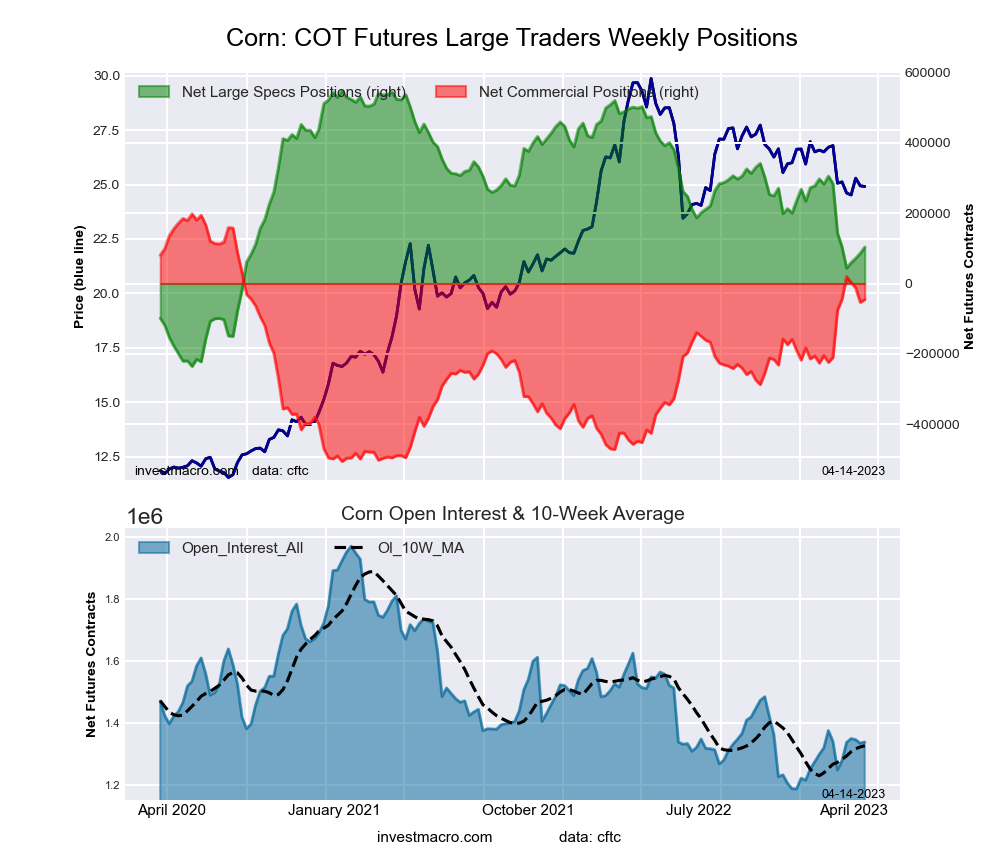
CORN Futures:
 The CORN large speculator standing this week was a net position of 105,636 contracts in the data reported through Tuesday. This was a weekly lift of 2,327 contracts from the previous week which had a total of 103,309 net contracts.
This week’s current strength score (the trader positioning range over the past three years, measured from 0 to 100) shows the speculators are currently Bearish with a score of 43.5 percent. The commercials are Bullish with a score of 66.0 percent and the small traders (not shown in chart) are Bearish-Extreme with a score of 13.7 percent.
| CORN Futures Statistics | SPECULATORS | COMMERCIALS | SMALL TRADERS |
| – Percent of Open Interest Longs: | 25.8 | 48.1 | 8.3 |
| – Percent of Open Interest Shorts: | 17.8 | 51.3 | 13.2 |
| – Net Position: | 105,636 | -41,244 | -64,392 |
| – Gross Longs: | 340,625 | 635,232 | 109,200 |
| – Gross Shorts: | 234,989 | 676,476 | 173,592 |
| – Long to Short Ratio: | 1.4 to 1 | 0.9 to 1 | 0.6 to 1 |
| NET POSITION TREND: | |||
| – Strength Index Score (3 Year Range Pct): | 43.5 | 66.0 | 13.7 |
| – Strength Index Reading (3 Year Range): | Bearish | Bullish | Bearish-Extreme |
| NET POSITION MOVEMENT INDEX: | |||
| – 6-Week Change in Strength Index: | 0.3 | 0.4 | -4.3 |
SUGAR Futures:
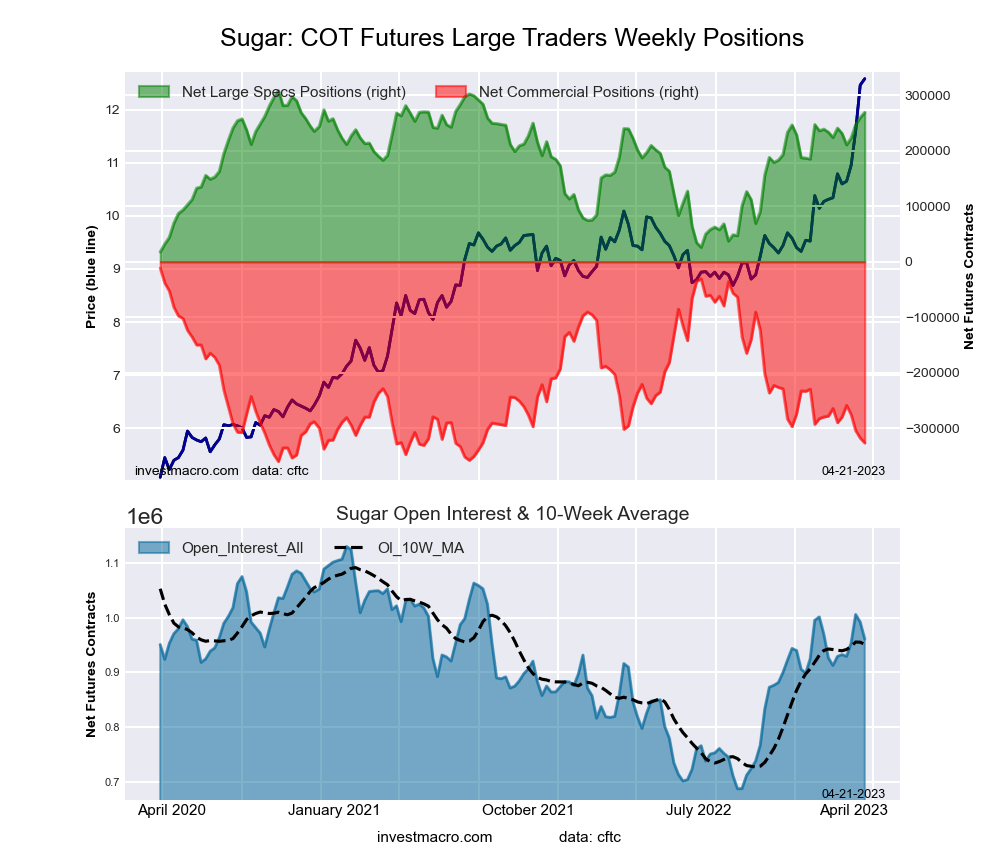 The SUGAR large speculator standing this week was a net position of 269,172 contracts in the data reported through Tuesday. This was a weekly boost of 9,384 contracts from the previous week which had a total of 259,788 net contracts.
This week’s current strength score (the trader positioning range over the past three years, measured from 0 to 100) shows the speculators are currently Bullish-Extreme with a score of 86.5 percent. The commercials are Bearish-Extreme with a score of 9.6 percent and the small traders (not shown in chart) are Bullish with a score of 78.4 percent.
| SUGAR Futures Statistics | SPECULATORS | COMMERCIALS | SMALL TRADERS |
| – Percent of Open Interest Longs: | 35.5 | 40.1 | 11.0 |
| – Percent of Open Interest Shorts: | 7.4 | 74.1 | 5.1 |
| – Net Position: | 269,172 | -326,198 | 57,026 |
| – Gross Longs: | 340,696 | 385,588 | 105,872 |
| – Gross Shorts: | 71,524 | 711,786 | 48,846 |
| – Long to Short Ratio: | 4.8 to 1 | 0.5 to 1 | 2.2 to 1 |
| NET POSITION TREND: | |||
| – Strength Index Score (3 Year Range Pct): | 86.5 | 9.6 | 78.4 |
| – Strength Index Reading (3 Year Range): | Bullish-Extreme | Bearish-Extreme | Bullish |
| NET POSITION MOVEMENT INDEX: | |||
| – 6-Week Change in Strength Index: | 9.8 | -10.5 | 10.1 |
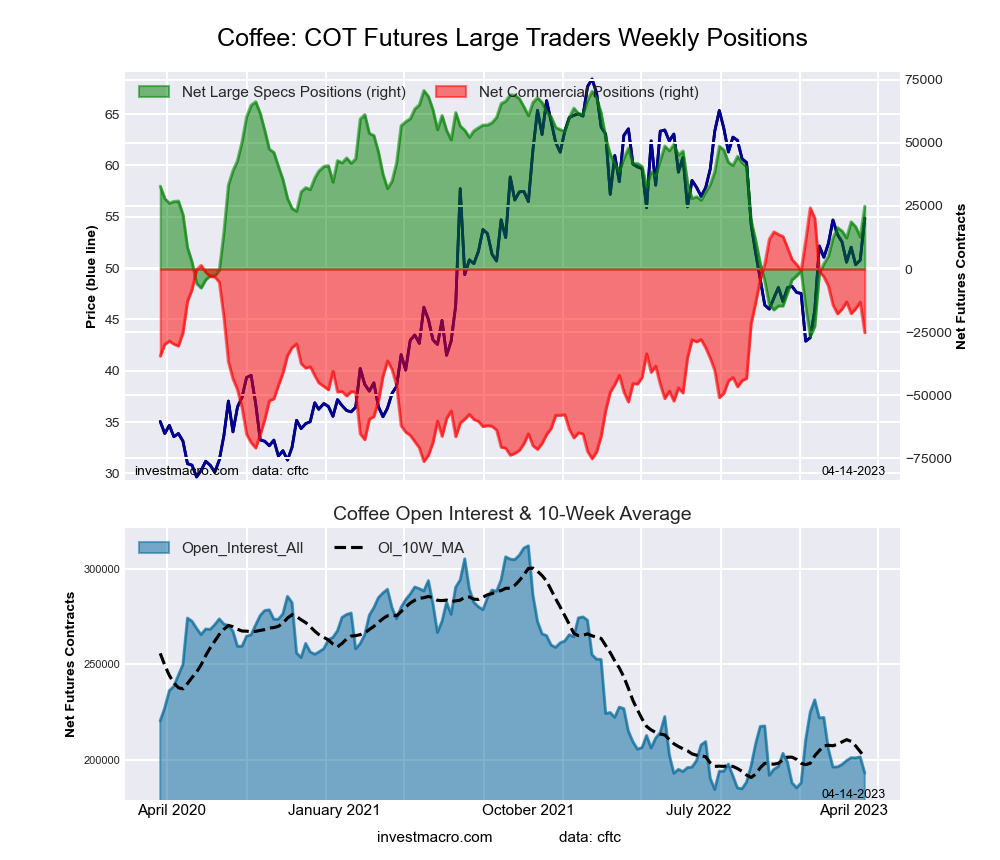
COFFEE Futures:
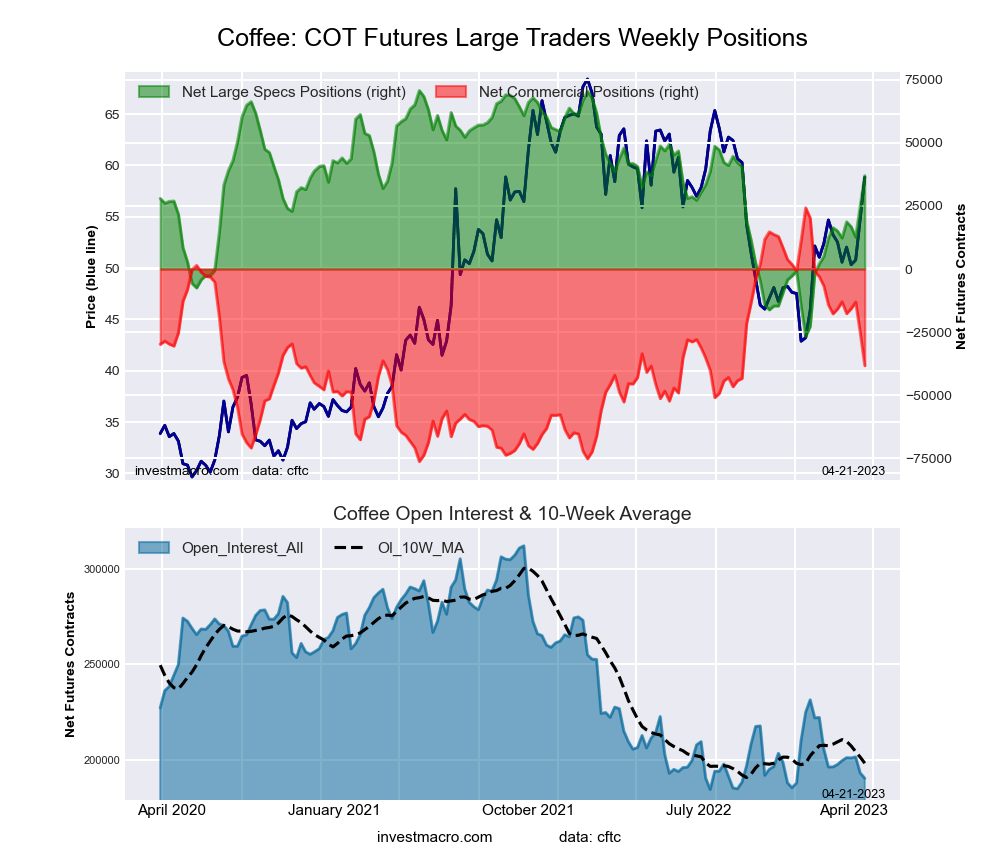 The COFFEE large speculator standing this week was a net position of 37,001 contracts in the data reported through Tuesday. This was a weekly increase of 12,124 contracts from the previous week which had a total of 24,877 net contracts.
This week’s current strength score (the trader positioning range over the past three years, measured from 0 to 100) shows the speculators are currently Bullish with a score of 65.4 percent. The commercials are Bearish with a score of 37.8 percent and the small traders (not shown in chart) are Bearish with a score of 28.5 percent.
| COFFEE Futures Statistics | SPECULATORS | COMMERCIALS | SMALL TRADERS |
| – Percent of Open Interest Longs: | 29.2 | 44.1 | 4.5 |
| – Percent of Open Interest Shorts: | 9.7 | 64.3 | 3.8 |
| – Net Position: | 37,001 | -38,309 | 1,308 |
| – Gross Longs: | 55,542 | 83,982 | 8,620 |
| – Gross Shorts: | 18,541 | 122,291 | 7,312 |
| – Long to Short Ratio: | 3.0 to 1 | 0.7 to 1 | 1.2 to 1 |
| NET POSITION TREND: | |||
| – Strength Index Score (3 Year Range Pct): | 65.4 | 37.8 | 28.5 |
| – Strength Index Reading (3 Year Range): | Bullish | Bearish | Bearish |
| NET POSITION MOVEMENT INDEX: | |||
| – 6-Week Change in Strength Index: | 22.5 | -22.3 | 6.3 |
SOYBEANS Futures:
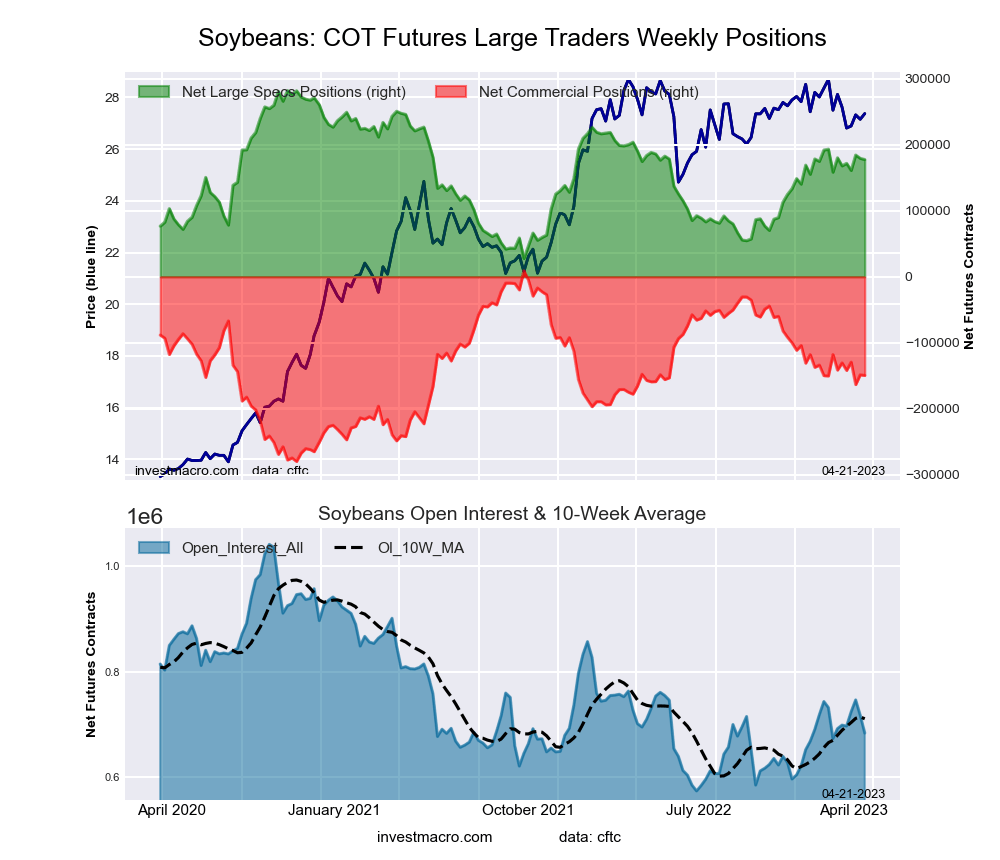 The SOYBEANS large speculator standing this week was a net position of 177,510 contracts in the data reported through Tuesday. This was a weekly lowering of -1,836 contracts from the previous week which had a total of 179,346 net contracts.
This week’s current strength score (the trader positioning range over the past three years, measured from 0 to 100) shows the speculators are currently Bullish with a score of 58.9 percent. The commercials are Bearish with a score of 45.1 percent and the small traders (not shown in chart) are Bearish with a score of 25.1 percent.
| SOYBEANS Futures Statistics | SPECULATORS | COMMERCIALS | SMALL TRADERS |
| – Percent of Open Interest Longs: | 32.1 | 43.3 | 6.9 |
| – Percent of Open Interest Shorts: | 6.1 | 65.2 | 11.0 |
| – Net Position: | 177,510 | -149,491 | -28,019 |
| – Gross Longs: | 219,301 | 296,149 | 47,114 |
| – Gross Shorts: | 41,791 | 445,640 | 75,133 |
| – Long to Short Ratio: | 5.2 to 1 | 0.7 to 1 | 0.6 to 1 |
| NET POSITION TREND: | |||
| – Strength Index Score (3 Year Range Pct): | 58.9 | 45.1 | 25.1 |
| – Strength Index Reading (3 Year Range): | Bullish | Bearish | Bearish |
| NET POSITION MOVEMENT INDEX: | |||
| – 6-Week Change in Strength Index: | -1.1 | -2.8 | 18.0 |
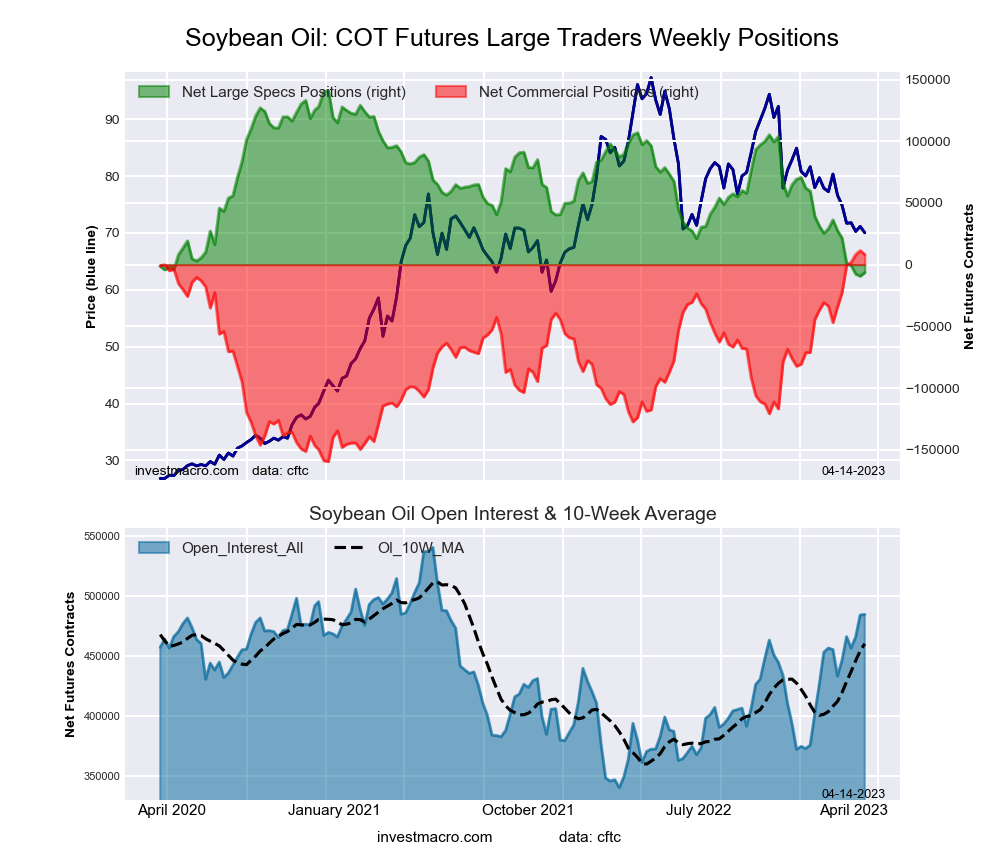
SOYBEAN OIL Futures:
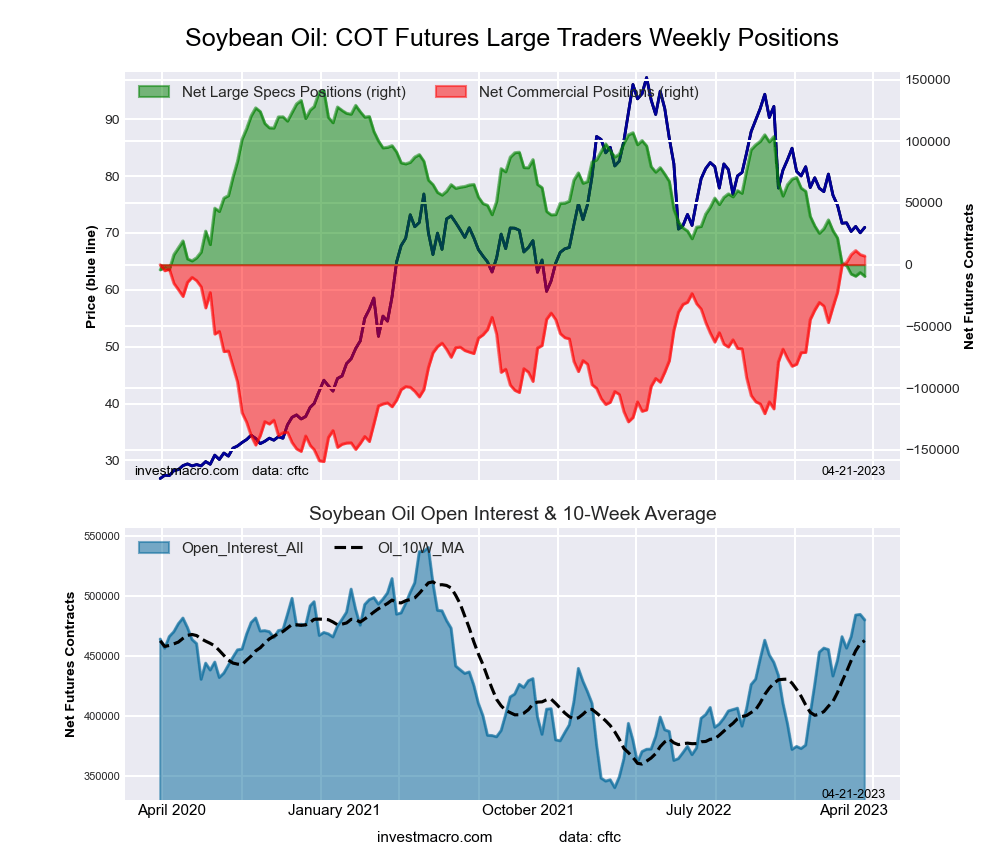 The SOYBEAN OIL large speculator standing this week was a net position of -9,451 contracts in the data reported through Tuesday. This was a weekly lowering of -3,095 contracts from the previous week which had a total of -6,356 net contracts.
This week’s current strength score (the trader positioning range over the past three years, measured from 0 to 100) shows the speculators are currently Bearish-Extreme with a score of 0.0 percent. The commercials are Bullish-Extreme with a score of 97.4 percent and the small traders (not shown in chart) are Bearish-Extreme with a score of 18.2 percent.
| SOYBEAN OIL Futures Statistics | SPECULATORS | COMMERCIALS | SMALL TRADERS |
| – Percent of Open Interest Longs: | 15.0 | 58.8 | 6.6 |
| – Percent of Open Interest Shorts: | 17.0 | 57.3 | 6.1 |
| – Net Position: | -9,451 | 6,944 | 2,507 |
| – Gross Longs: | 72,093 | 282,065 | 31,891 |
| – Gross Shorts: | 81,544 | 275,121 | 29,384 |
| – Long to Short Ratio: | 0.9 to 1 | 1.0 to 1 | 1.1 to 1 |
| NET POSITION TREND: | |||
| – Strength Index Score (3 Year Range Pct): | 0.0 | 97.4 | 18.2 |
| – Strength Index Reading (3 Year Range): | Bearish-Extreme | Bullish-Extreme | Bearish-Extreme |
| NET POSITION MOVEMENT INDEX: | |||
| – 6-Week Change in Strength Index: | -20.6 | 17.2 | 6.3 |
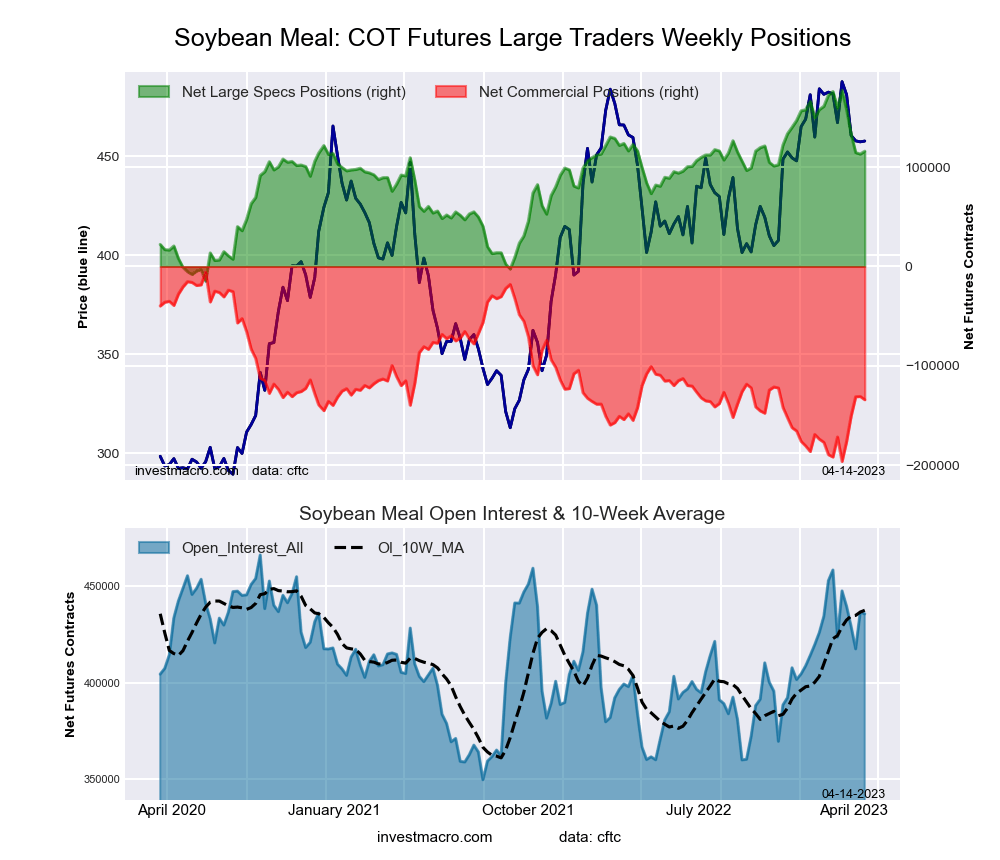
SOYBEAN MEAL Futures:
 The SOYBEAN MEAL large speculator standing this week was a net position of 130,269 contracts in the data reported through Tuesday. This was a weekly rise of 14,357 contracts from the previous week which had a total of 115,912 net contracts.
This week’s current strength score (the trader positioning range over the past three years, measured from 0 to 100) shows the speculators are currently Bullish with a score of 75.6 percent. The commercials are Bearish with a score of 25.9 percent and the small traders (not shown in chart) are Bearish with a score of 21.7 percent.
| SOYBEAN MEAL Futures Statistics | SPECULATORS | COMMERCIALS | SMALL TRADERS |
| – Percent of Open Interest Longs: | 33.5 | 36.4 | 10.8 |
| – Percent of Open Interest Shorts: | 4.8 | 68.7 | 7.1 |
| – Net Position: | 130,269 | -146,880 | 16,611 |
| – Gross Longs: | 152,035 | 165,430 | 48,978 |
| – Gross Shorts: | 21,766 | 312,310 | 32,367 |
| – Long to Short Ratio: | 7.0 to 1 | 0.5 to 1 | 1.5 to 1 |
| NET POSITION TREND: | |||
| – Strength Index Score (3 Year Range Pct): | 75.6 | 25.9 | 21.7 |
| – Strength Index Reading (3 Year Range): | Bullish | Bearish | Bearish |
| NET POSITION MOVEMENT INDEX: | |||
| – 6-Week Change in Strength Index: | -24.4 | 25.9 | -12.8 |
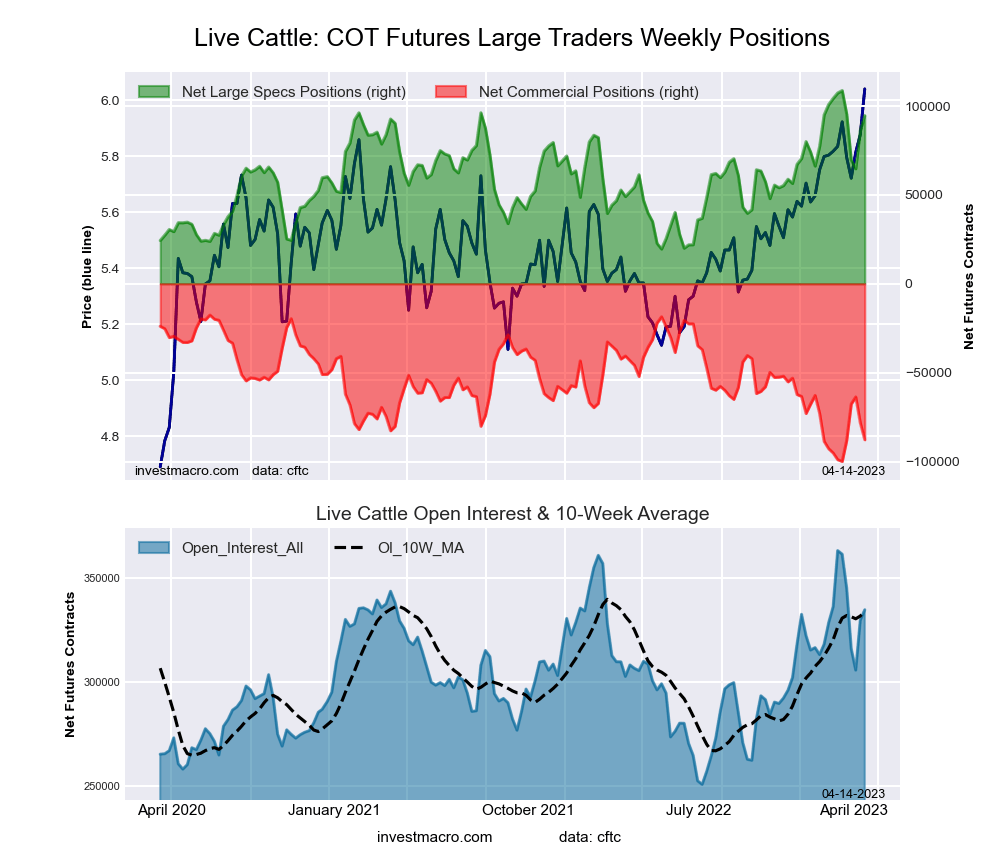
LIVE CATTLE Futures:
 The LIVE CATTLE large speculator standing this week was a net position of 102,072 contracts in the data reported through Tuesday. This was a weekly gain of 7,456 contracts from the previous week which had a total of 94,616 net contracts.
This week’s current strength score (the trader positioning range over the past three years, measured from 0 to 100) shows the speculators are currently Bullish-Extreme with a score of 92.5 percent. The commercials are Bearish-Extreme with a score of 8.7 percent and the small traders (not shown in chart) are Bearish with a score of 37.7 percent.
| LIVE CATTLE Futures Statistics | SPECULATORS | COMMERCIALS | SMALL TRADERS |
| – Percent of Open Interest Longs: | 45.4 | 25.6 | 9.9 |
| – Percent of Open Interest Shorts: | 15.7 | 52.6 | 12.6 |
| – Net Position: | 102,072 | -92,780 | -9,292 |
| – Gross Longs: | 155,956 | 88,017 | 33,970 |
| – Gross Shorts: | 53,884 | 180,797 | 43,262 |
| – Long to Short Ratio: | 2.9 to 1 | 0.5 to 1 | 0.8 to 1 |
| NET POSITION TREND: | |||
| – Strength Index Score (3 Year Range Pct): | 92.5 | 8.7 | 37.7 |
| – Strength Index Reading (3 Year Range): | Bullish-Extreme | Bearish-Extreme | Bearish |
| NET POSITION MOVEMENT INDEX: | |||
| – 6-Week Change in Strength Index: | -7.5 | 8.7 | -3.0 |
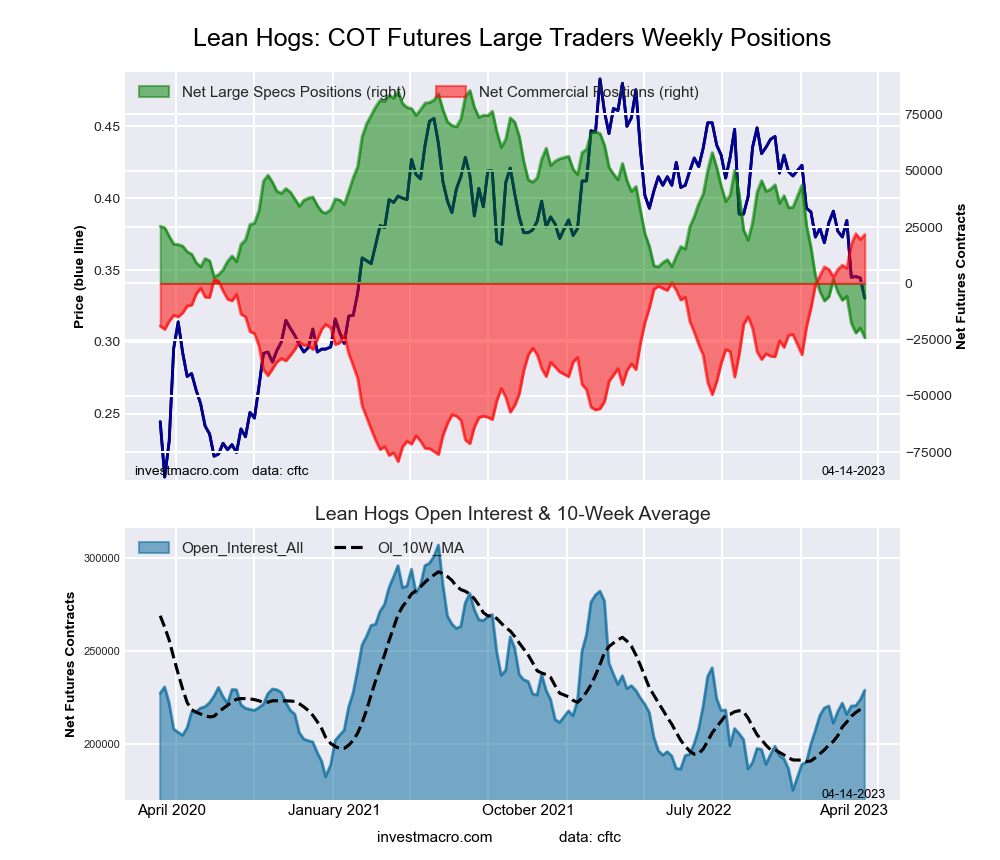
LEAN HOGS Futures:
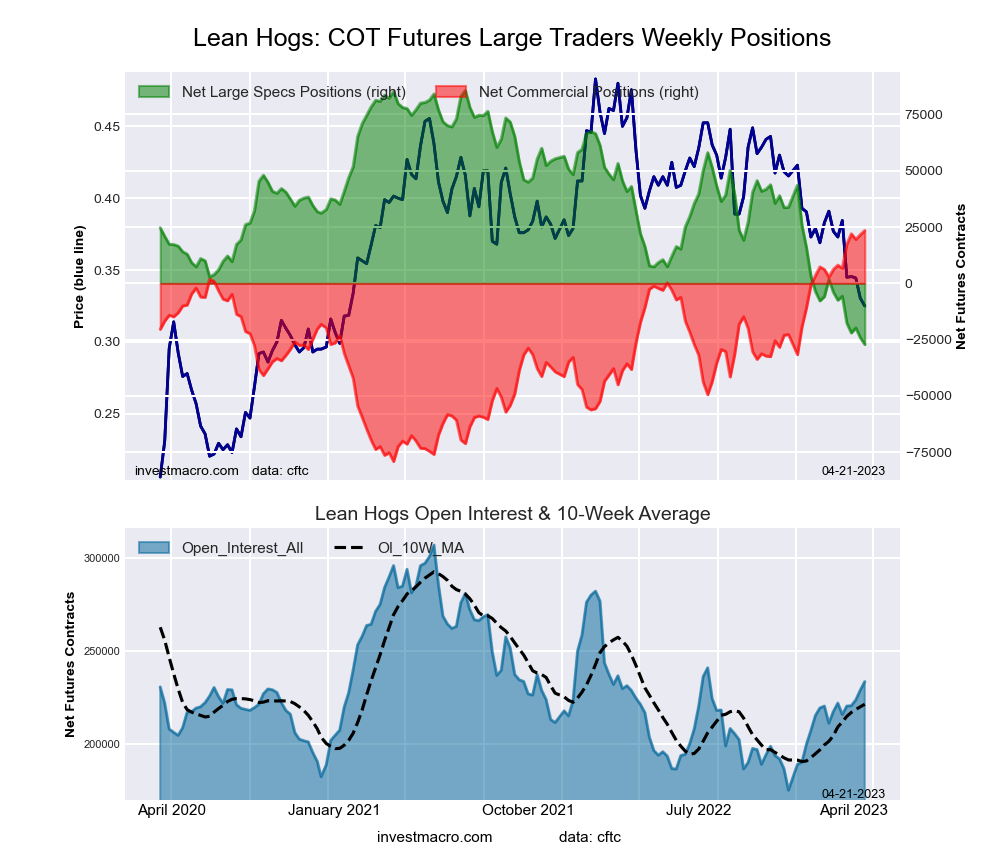 The LEAN HOGS large speculator standing this week was a net position of -27,157 contracts in the data reported through Tuesday. This was a weekly reduction of -3,065 contracts from the previous week which had a total of -24,092 net contracts.
This week’s current strength score (the trader positioning range over the past three years, measured from 0 to 100) shows the speculators are currently Bearish-Extreme with a score of 0.0 percent. The commercials are Bullish-Extreme with a score of 100.0 percent and the small traders (not shown in chart) are Bullish-Extreme with a score of 100.0 percent.
| LEAN HOGS Futures Statistics | SPECULATORS | COMMERCIALS | SMALL TRADERS |
| – Percent of Open Interest Longs: | 28.1 | 36.1 | 12.6 |
| – Percent of Open Interest Shorts: | 39.8 | 26.1 | 11.0 |
| – Net Position: | -27,157 | 23,443 | 3,714 |
| – Gross Longs: | 65,671 | 84,339 | 29,502 |
| – Gross Shorts: | 92,828 | 60,896 | 25,788 |
| – Long to Short Ratio: | 0.7 to 1 | 1.4 to 1 | 1.1 to 1 |
| NET POSITION TREND: | |||
| – Strength Index Score (3 Year Range Pct): | 0.0 | 100.0 | 100.0 |
| – Strength Index Reading (3 Year Range): | Bearish-Extreme | Bullish-Extreme | Bullish-Extreme |
| NET POSITION MOVEMENT INDEX: | |||
| – 6-Week Change in Strength Index: | -17.5 | 15.0 | 19.3 |
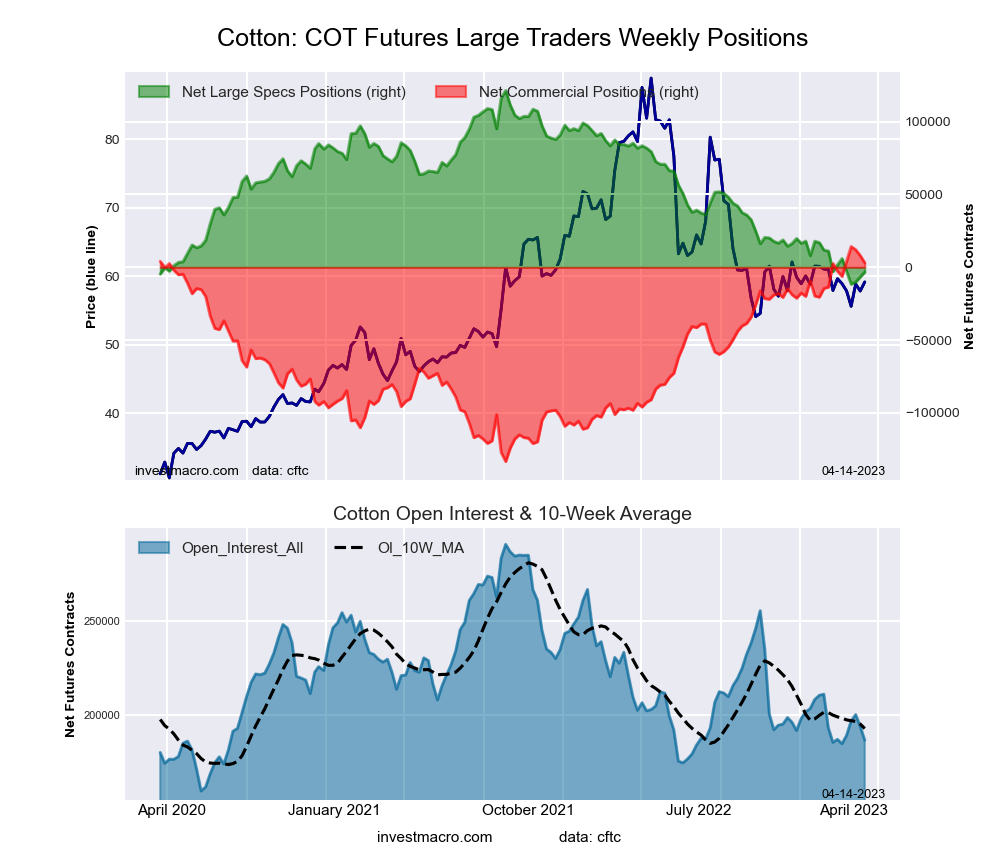
COTTON Futures:
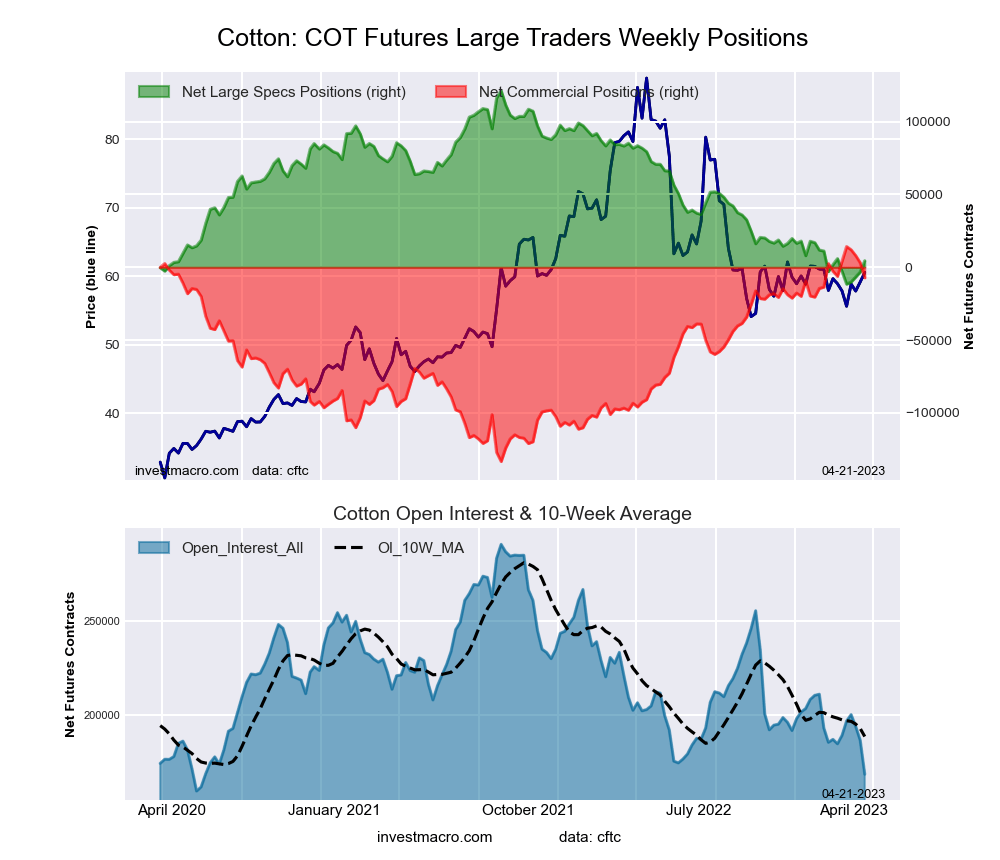 The COTTON large speculator standing this week was a net position of 4,470 contracts in the data reported through Tuesday. This was a weekly gain of 7,749 contracts from the previous week which had a total of -3,279 net contracts.
This week’s current strength score (the trader positioning range over the past three years, measured from 0 to 100) shows the speculators are currently Bearish-Extreme with a score of 12.1 percent. The commercials are Bullish-Extreme with a score of 85.5 percent and the small traders (not shown in chart) are Bearish with a score of 32.8 percent.
| COTTON Futures Statistics | SPECULATORS | COMMERCIALS | SMALL TRADERS |
| – Percent of Open Interest Longs: | 32.8 | 45.8 | 7.9 |
| – Percent of Open Interest Shorts: | 30.1 | 50.1 | 6.3 |
| – Net Position: | 4,470 | -7,229 | 2,759 |
| – Gross Longs: | 55,156 | 77,142 | 13,335 |
| – Gross Shorts: | 50,686 | 84,371 | 10,576 |
| – Long to Short Ratio: | 1.1 to 1 | 0.9 to 1 | 1.3 to 1 |
| NET POSITION TREND: | |||
| – Strength Index Score (3 Year Range Pct): | 12.1 | 85.5 | 32.8 |
| – Strength Index Reading (3 Year Range): | Bearish-Extreme | Bullish-Extreme | Bearish |
| NET POSITION MOVEMENT INDEX: | |||
| – 6-Week Change in Strength Index: | -1.1 | -0.7 | 15.1 |
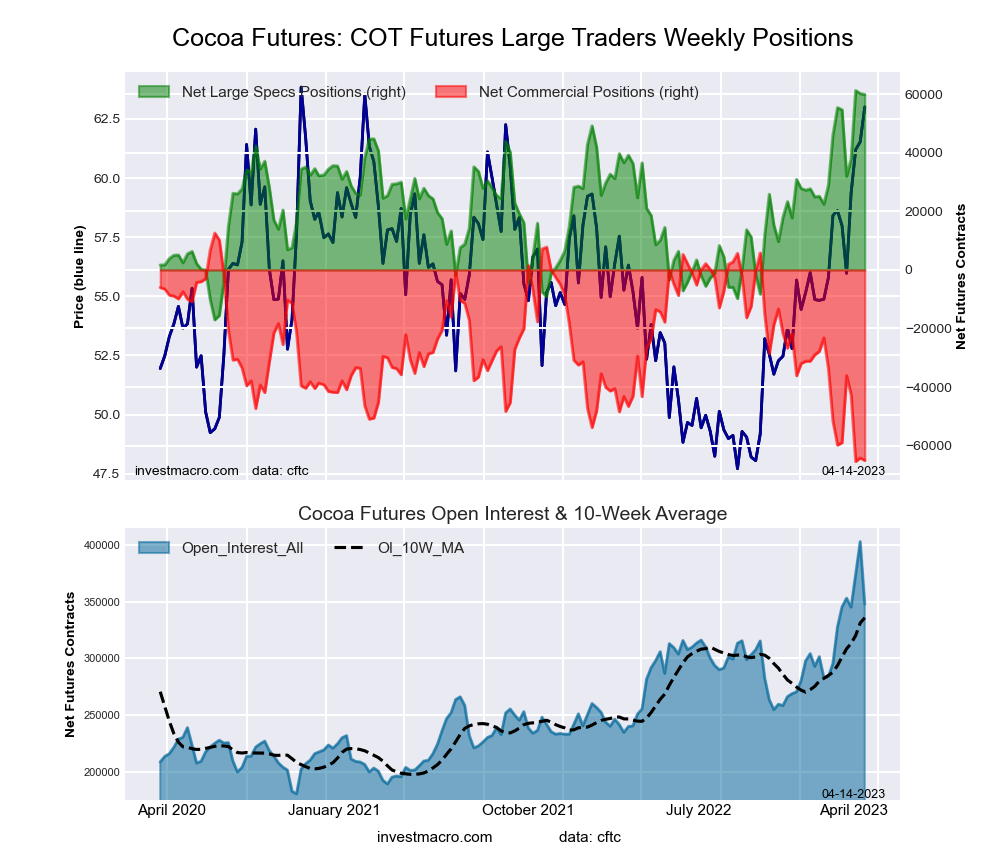
COCOA Futures:
 The COCOA large speculator standing this week was a net position of 59,355 contracts in the data reported through Tuesday. This was a weekly fall of -558 contracts from the previous week which had a total of 59,913 net contracts.
This week’s current strength score (the trader positioning range over the past three years, measured from 0 to 100) shows the speculators are currently Bullish-Extreme with a score of 97.6 percent. The commercials are Bearish-Extreme with a score of 1.6 percent and the small traders (not shown in chart) are Bearish with a score of 44.5 percent.
| COCOA Futures Statistics | SPECULATORS | COMMERCIALS | SMALL TRADERS |
| – Percent of Open Interest Longs: | 39.8 | 33.3 | 4.7 |
| – Percent of Open Interest Shorts: | 21.8 | 52.7 | 3.3 |
| – Net Position: | 59,355 | -64,143 | 4,788 |
| – Gross Longs: | 131,355 | 110,050 | 15,617 |
| – Gross Shorts: | 72,000 | 174,193 | 10,829 |
| – Long to Short Ratio: | 1.8 to 1 | 0.6 to 1 | 1.4 to 1 |
| NET POSITION TREND: | |||
| – Strength Index Score (3 Year Range Pct): | 97.6 | 1.6 | 44.5 |
| – Strength Index Reading (3 Year Range): | Bullish-Extreme | Bearish-Extreme | Bearish |
| NET POSITION MOVEMENT INDEX: | |||
| – 6-Week Change in Strength Index: | 5.9 | -6.6 | 4.8 |
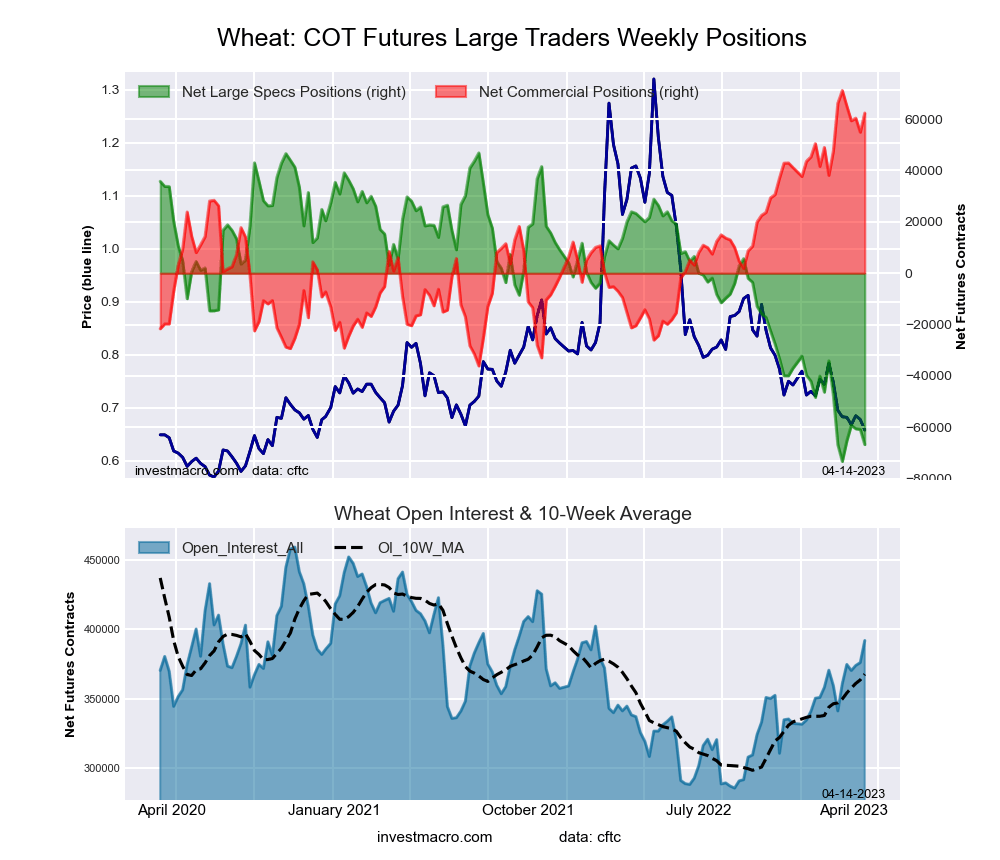
WHEAT Futures:
 The WHEAT large speculator standing this week was a net position of -70,536 contracts in the data reported through Tuesday. This was a weekly decline of -3,854 contracts from the previous week which had a total of -66,682 net contracts.
This week’s current strength score (the trader positioning range over the past three years, measured from 0 to 100) shows the speculators are currently Bearish-Extreme with a score of 2.3 percent. The commercials are Bullish-Extreme with a score of 94.6 percent and the small traders (not shown in chart) are Bullish-Extreme with a score of 97.6 percent.
| WHEAT Futures Statistics | SPECULATORS | COMMERCIALS | SMALL TRADERS |
| – Percent of Open Interest Longs: | 28.0 | 37.9 | 11.1 |
| – Percent of Open Interest Shorts: | 46.6 | 20.7 | 9.7 |
| – Net Position: | -70,536 | 65,243 | 5,293 |
| – Gross Longs: | 105,806 | 143,559 | 42,074 |
| – Gross Shorts: | 176,342 | 78,316 | 36,781 |
| – Long to Short Ratio: | 0.6 to 1 | 1.8 to 1 | 1.1 to 1 |
| NET POSITION TREND: | |||
| – Strength Index Score (3 Year Range Pct): | 2.3 | 94.6 | 97.6 |
| – Strength Index Reading (3 Year Range): | Bearish-Extreme | Bullish-Extreme | Bullish-Extreme |
| NET POSITION MOVEMENT INDEX: | |||
| – 6-Week Change in Strength Index: | 2.3 | -5.4 | 11.4 |
Article By InvestMacro – Receive our weekly COT Newsletter
*COT Report: The COT data, released weekly to the public each Friday, is updated through the most recent Tuesday (data is 3 days old) and shows a quick view of how large speculators or non-commercials (for-profit traders) were positioned in the futures markets.
The CFTC categorizes trader positions according to commercial hedgers (traders who use futures contracts for hedging as part of the business), non-commercials (large traders who speculate to realize trading profits) and nonreportable traders (usually small traders/speculators) as well as their open interest (contracts open in the market at time of reporting). See CFTC criteria here.


