
By InvestMacro | COT | Data Tables | COT Leaders | Downloads | COT Newsletter
Here are the latest charts and statistics for the Commitment of Traders (COT) data published by the Commodities Futures Trading Commission (CFTC).
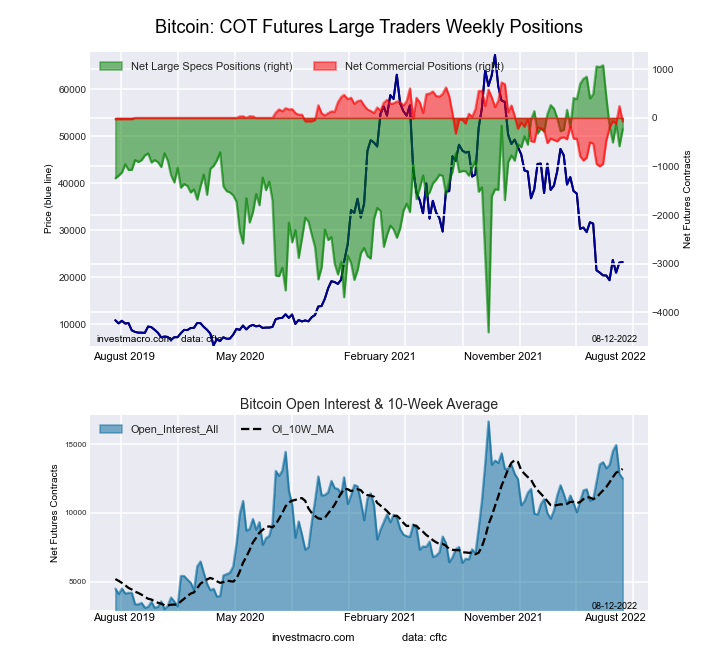
The latest COT data (Week 33) is updated through Tuesday August 16th and shows a quick view of how large traders (for-profit speculators and commercial entities) were positioned in the futures markets.
Weekly Speculator Changes: Week 33 – Heating Oil bets rise for 6th week
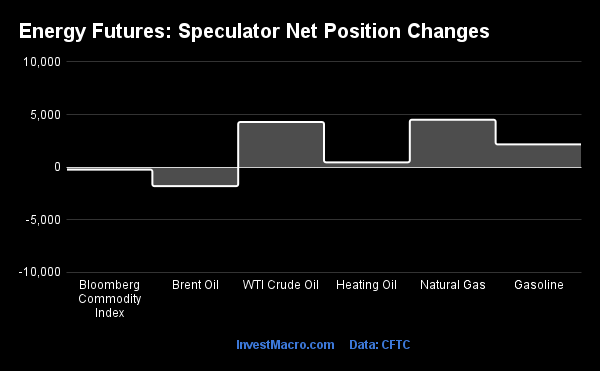
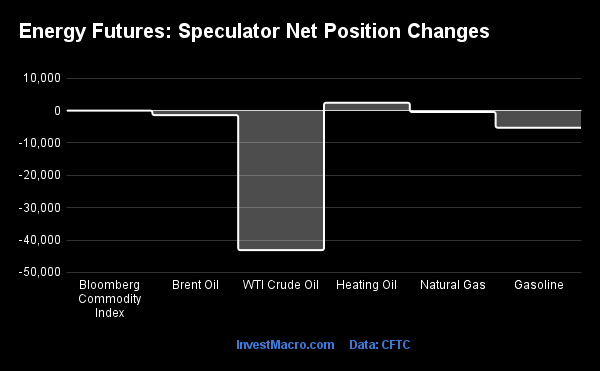
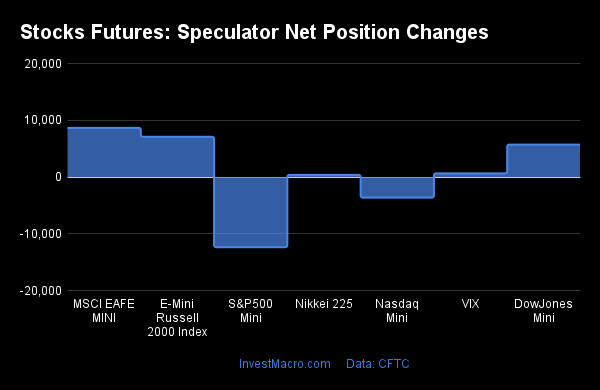
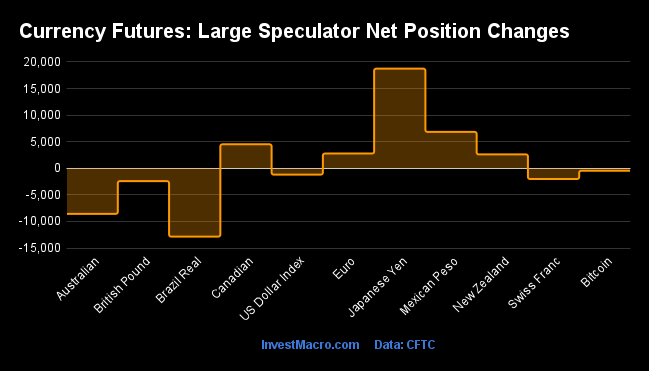
COT energy market speculator bets were higher this week as four out of the six energy markets we cover had higher positioning this week while two markets had lower contracts.
Leading the gains for energy markets was Natural Gas (4,508 contracts) with WTI Crude Oil (4,289 contracts), Gasoline (2,163 contracts) and Heating Oil (462 contracts) also showing positive weeks.
The energy markets leading the declines in speculator bets this week was Brent Crude Oil (-1,801 contracts) with the Bloomberg Commodity Index (-231 contracts) also registering lower bets on the week.
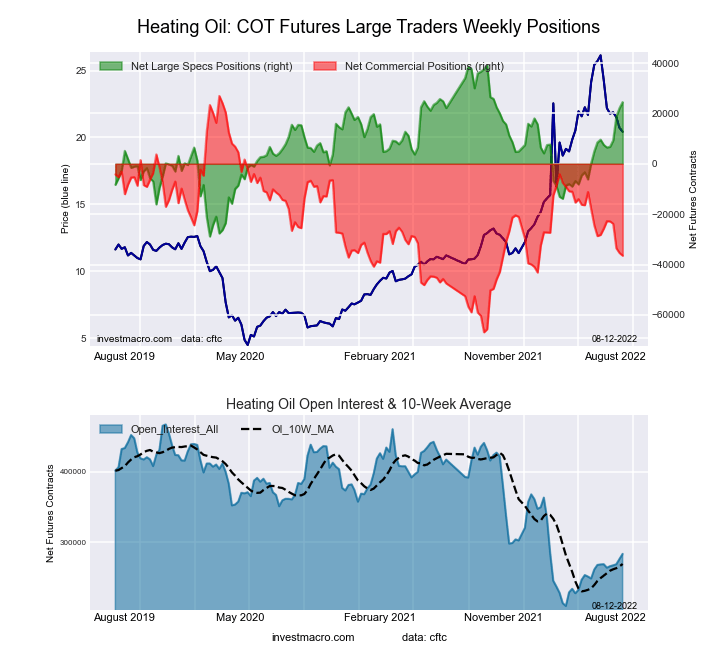
Heating Oil speculator contracts edged higher this week and rose for a sixth straight week. Speculator positions are now in bullish territory for the twelfth week after turning from bearish to bullish on May 31st. These increases have pushed the Heating Oil speculator standing to just about +25,000 contracts and to the highest level since October 26th of 2021, a span of forty-two weeks.
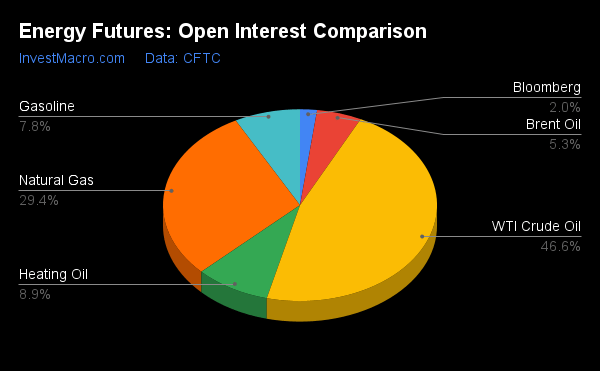
| Aug-16-2022 | OI | OI-Index | Spec-Net | Spec-Index | Com-Net | COM-Index | Smalls-Net | Smalls-Index |
|---|---|---|---|---|---|---|---|---|
| WTI Crude | 1,557,349 | 0 | 214,940 | 1 | -239,291 | 100 | 24,351 | 48 |
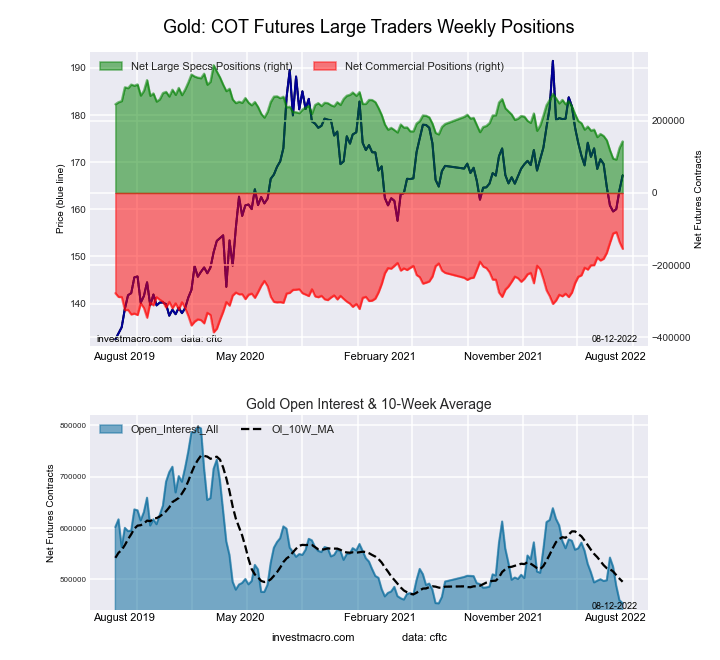
| Gold | 453,960 | 0 | 141,164 | 19 | -153,709 | 84 | 12,545 | 4 |
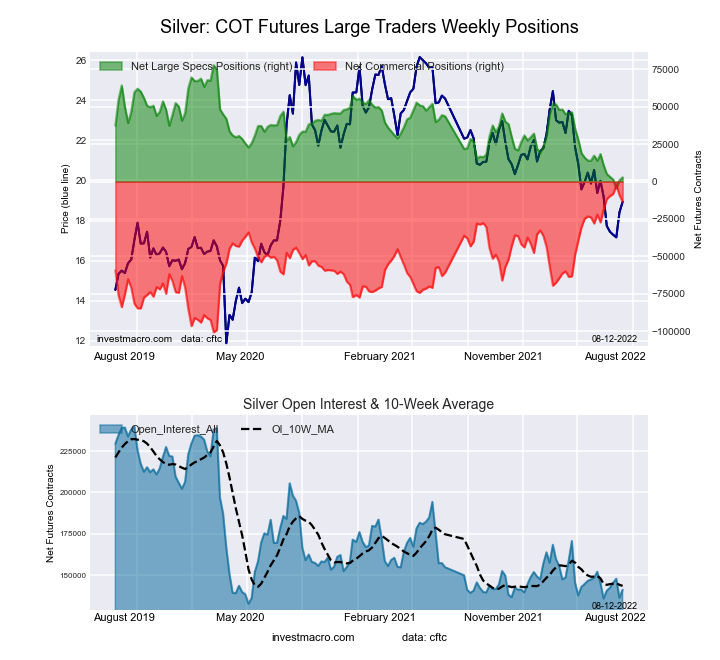
| Silver | 144,314 | 11 | 3,508 | 10 | -12,451 | 90 | 8,943 | 12 |
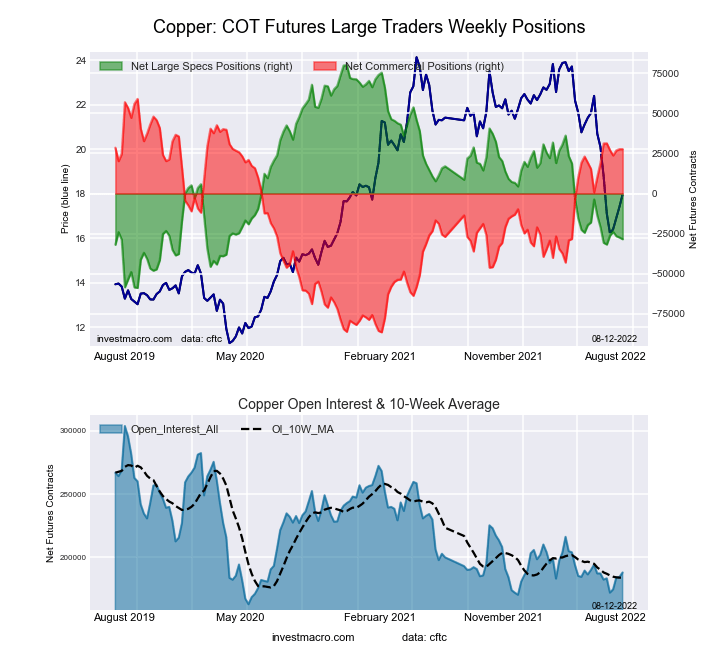
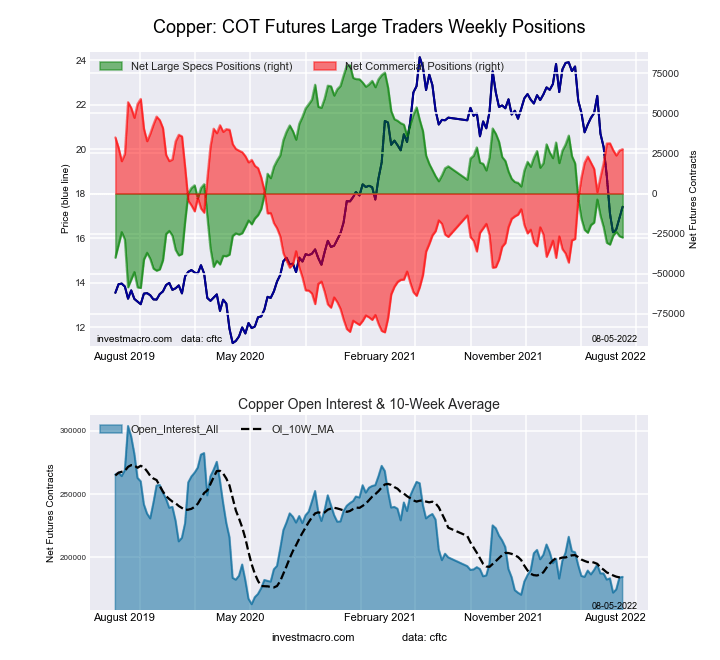
| Copper | 183,500 | 17 | -28,220 | 22 | 28,932 | 79 | -712 | 21 |
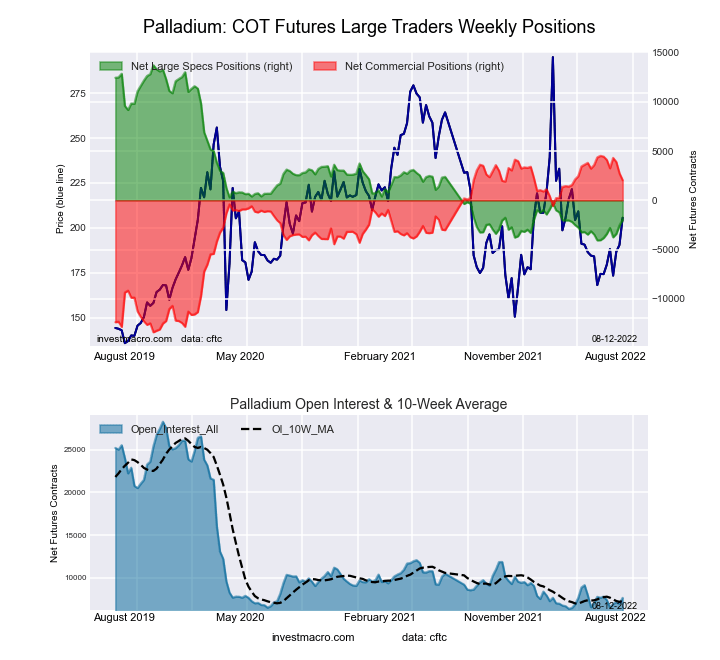
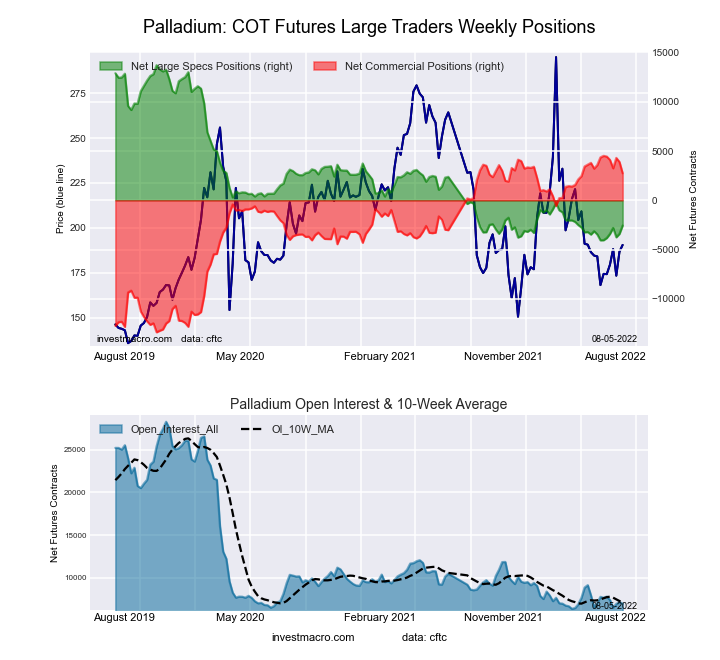
| Palladium | 7,951 | 7 | -1,599 | 14 | 1,536 | 83 | 63 | 48 |
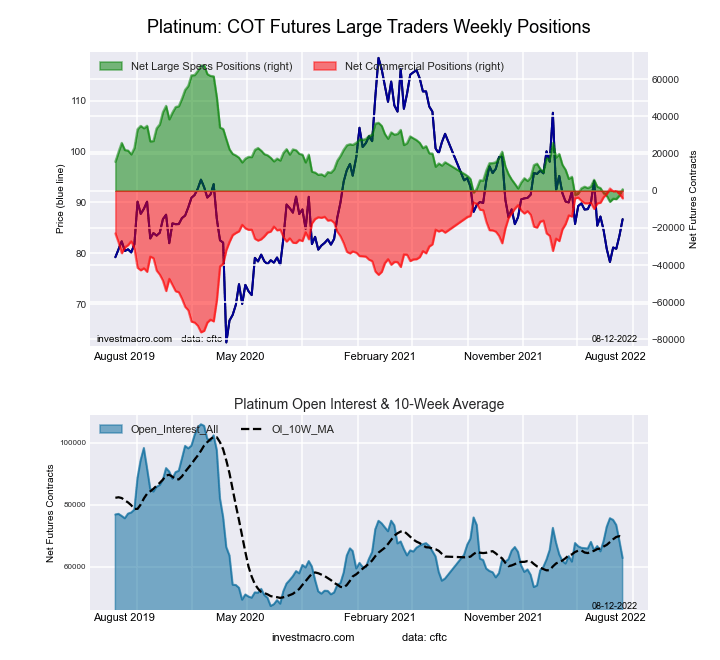
| Platinum | 57,254 | 17 | 2,940 | 12 | -6,361 | 90 | 3,421 | 10 |
| Natural Gas | 983,460 | 5 | -120,911 | 42 | 82,862 | 57 | 38,049 | 70 |
| Brent | 176,902 | 21 | -36,012 | 51 | 34,290 | 50 | 1,722 | 33 |
| Heating Oil | 296,987 | 34 | 24,926 | 79 | -40,022 | 29 | 15,096 | 51 |
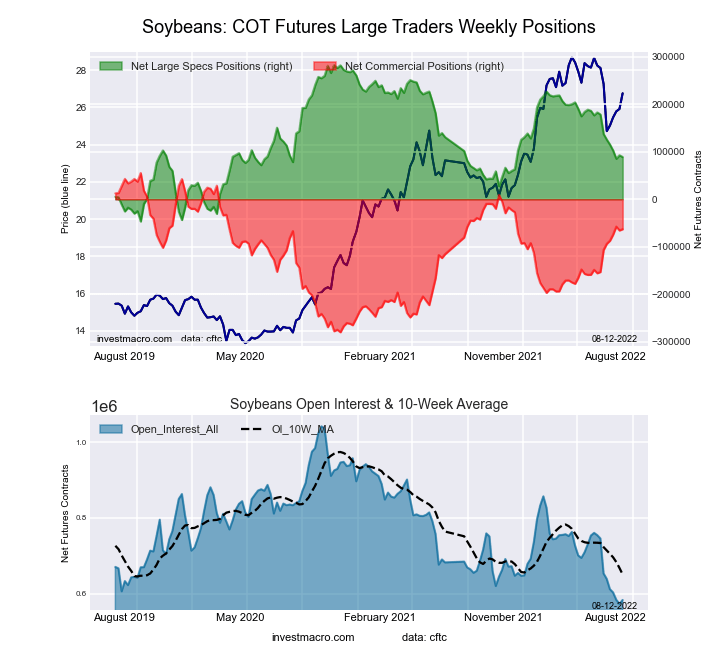
| Soybeans | 595,095 | 5 | 83,183 | 39 | -51,650 | 68 | -31,533 | 18 |
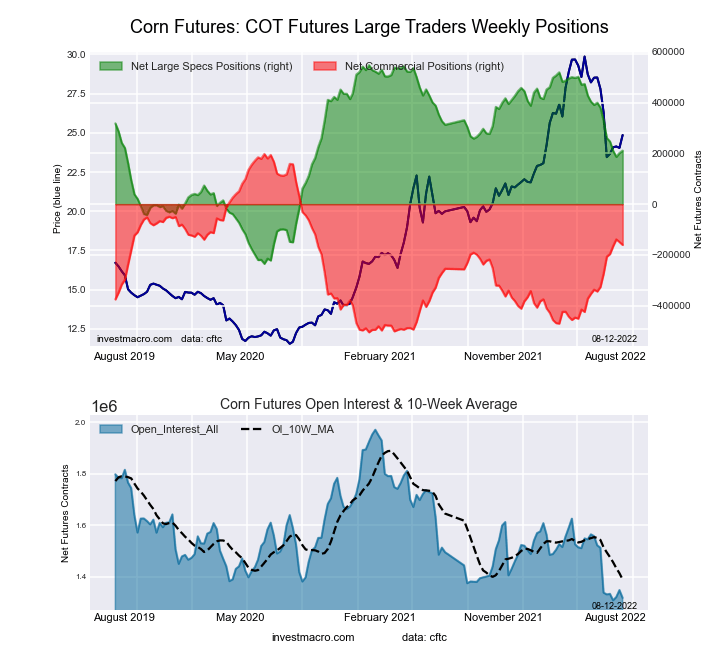
| Corn | 1,316,462 | 1 | 220,129 | 58 | -166,318 | 48 | -53,811 | 12 |
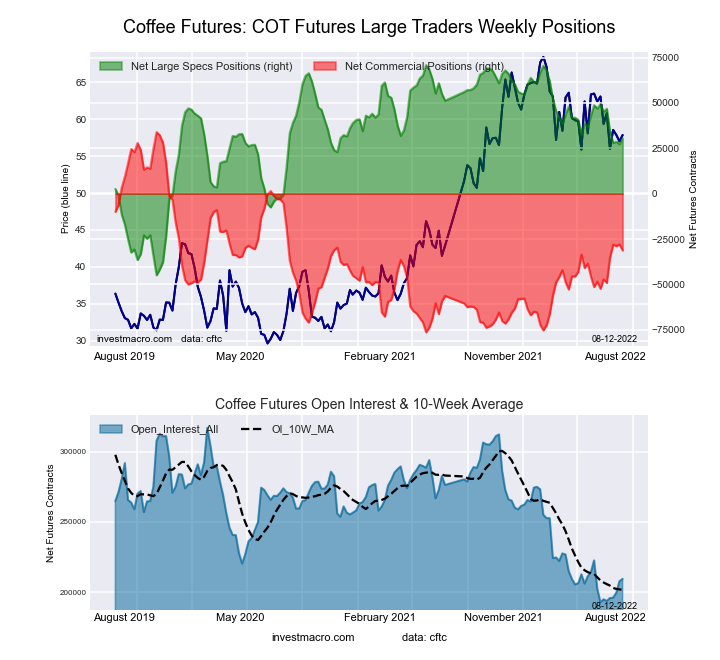
| Coffee | 190,302 | 0 | 33,471 | 68 | -35,318 | 37 | 1,847 | 16 |
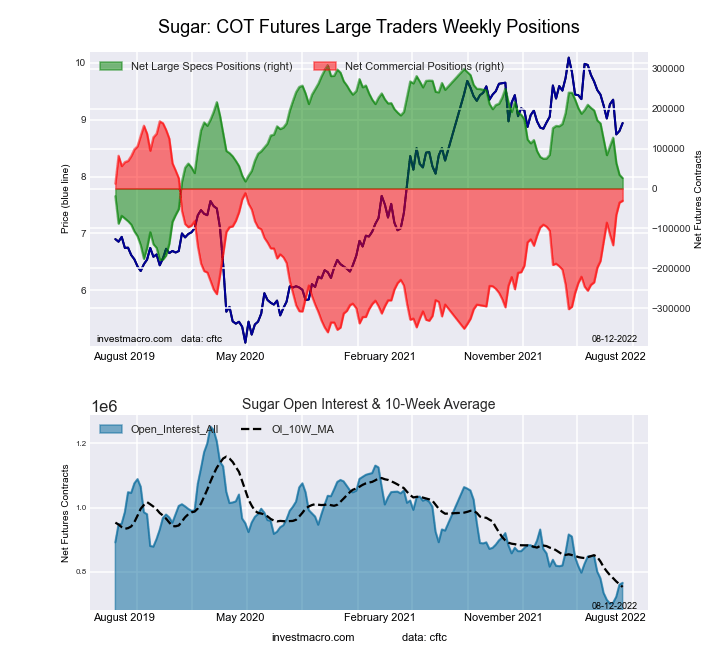
| Sugar | 737,535 | 7 | 49,970 | 47 | -61,837 | 56 | 11,867 | 23 |
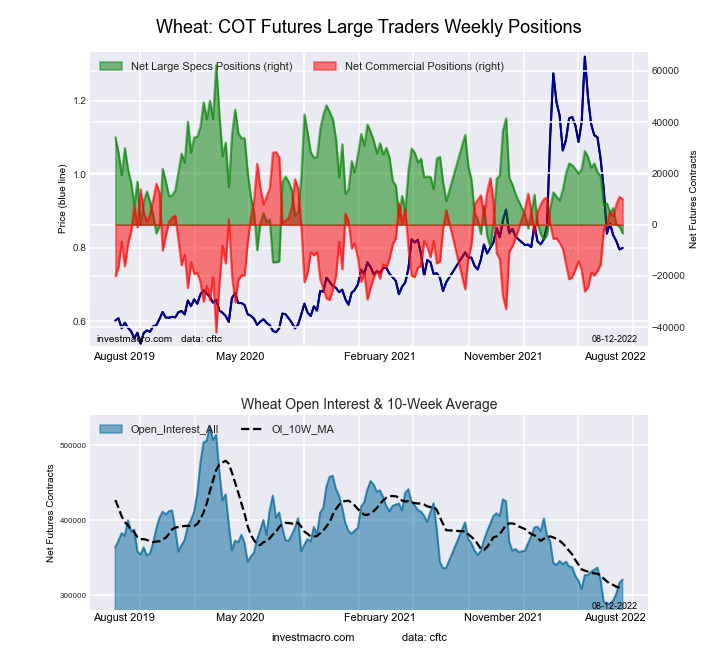
| Wheat | 313,237 | 11 | -1,908 | 17 | 7,448 | 70 | -5,540 | 82 |
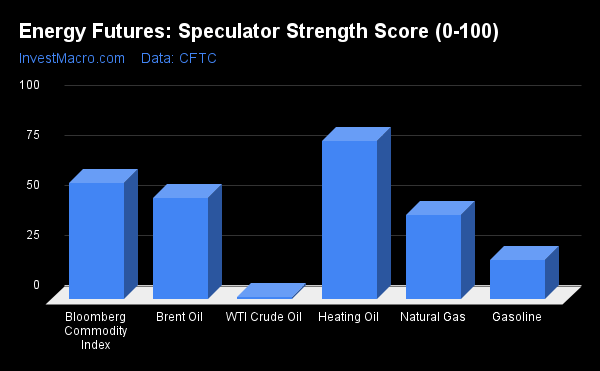
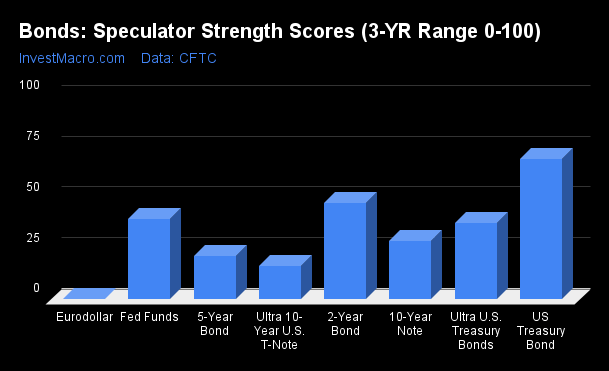
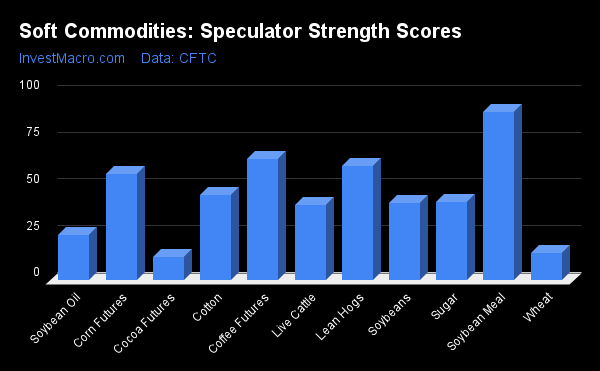
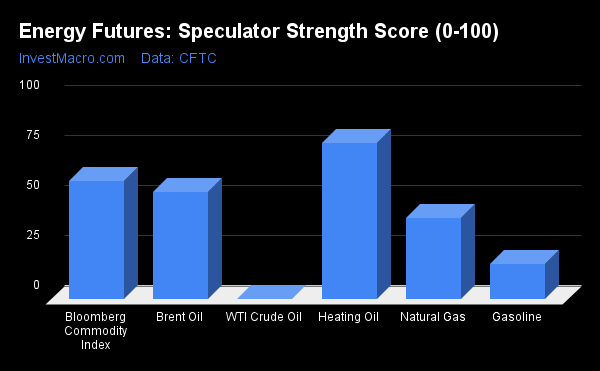
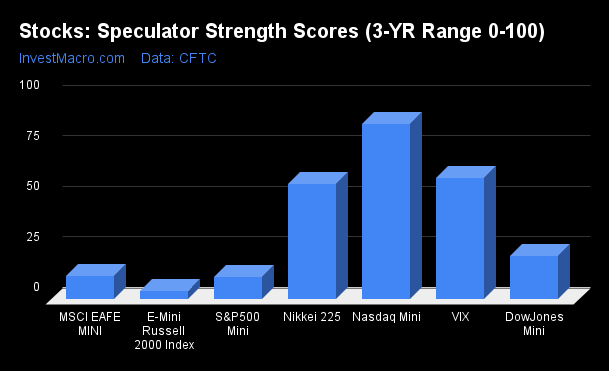
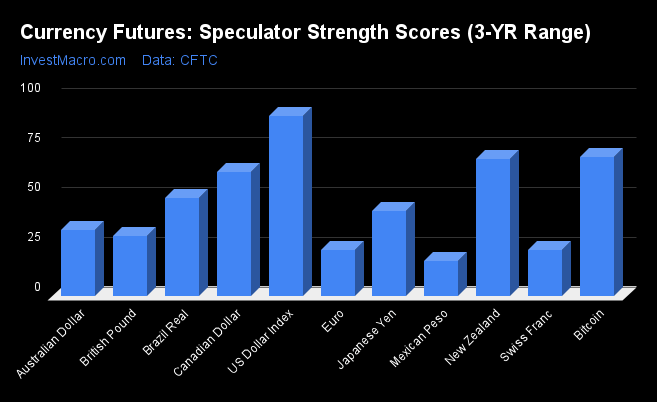
Strength Scores
Strength Scores (a normalized measure of Speculator positions over a 3-Year range, from 0 to 100 where above 80 is extreme bullish and below 20 is extreme bearish) show that Heating Oil (79.1 percent) leads the energy currently and is up a bit from last week’s score of 78.4 percent. The Bloomberg Commodity Index (58.2 percent) and Brent Crude Oil (50.8 percent) come in as the next highest energy markets in strength scores. On the downside, the WTI Crude Oil (1.1 percent) and Gasoline (19.7 percent) come in at the lowest strength levels and are both in bearish extreme levels (below 20 percent).
Strength Statistics:
WTI Crude Oil (1.1 percent) vs WTI Crude Oil previous week (0.0 percent)
Brent Crude Oil (50.8 percent) vs Brent Crude Oil previous week (53.8 percent)
Natural Gas (42.3 percent) vs Natural Gas previous week (40.9 percent)
Gasoline (19.7 percent) vs Gasoline previous week (17.5 percent)
Heating Oil (79.1 percent) vs Heating Oil previous week (78.4 percent)
Bloomberg Commodity Index (58.2 percent) vs Bloomberg Commodity Index previous week (59.1 percent)
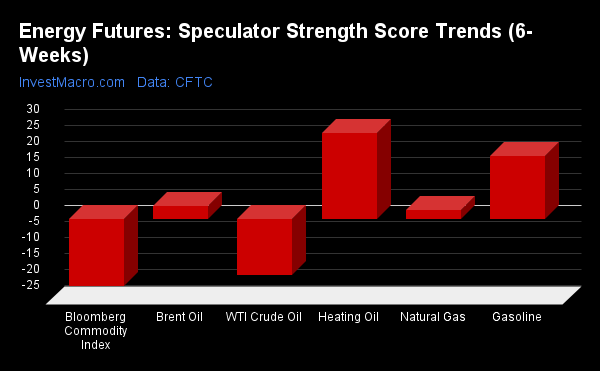
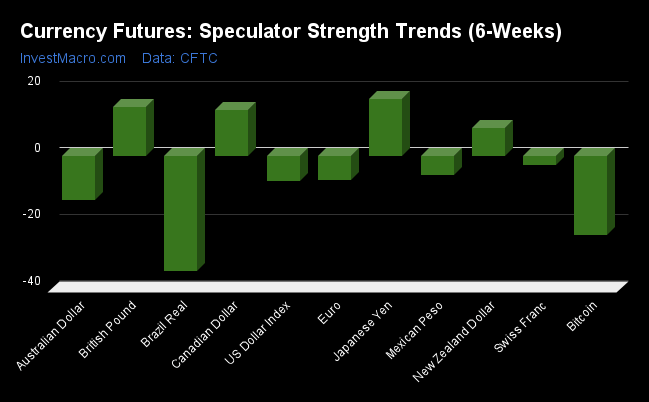
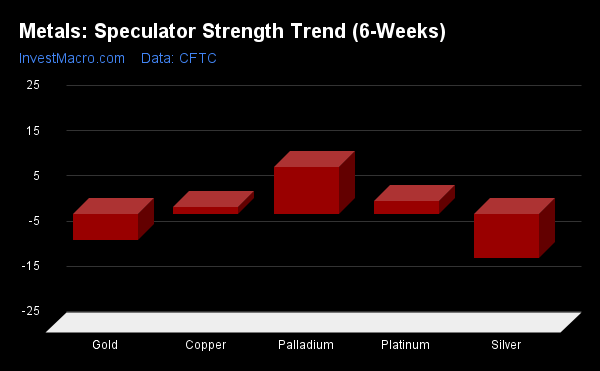
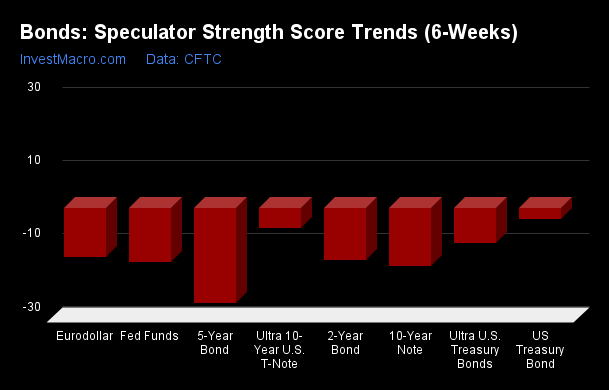
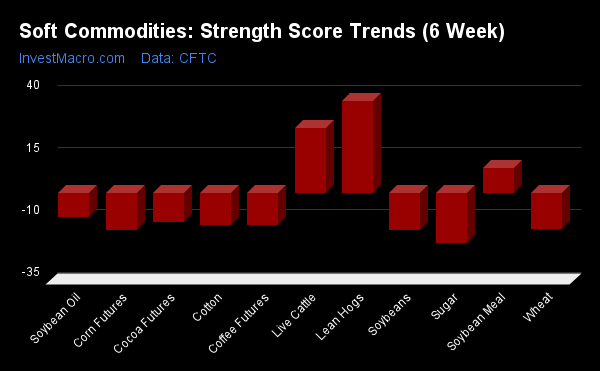
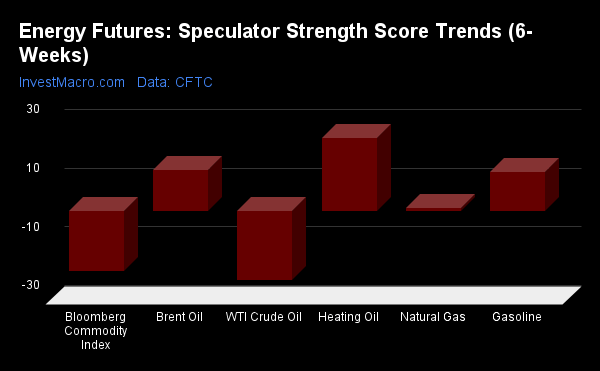
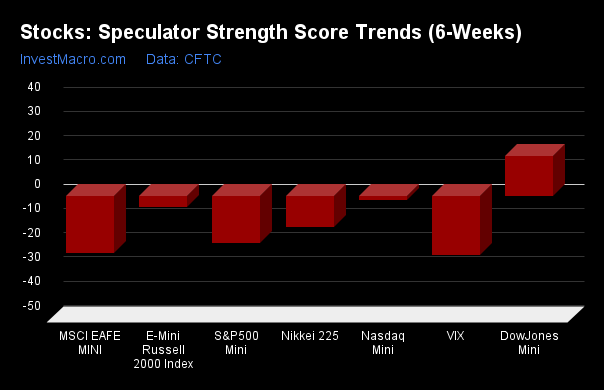
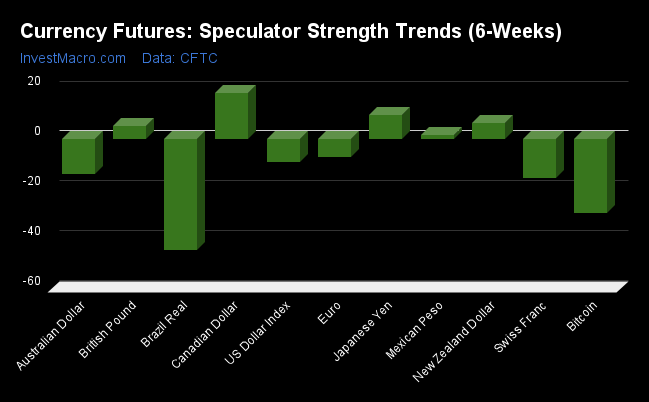
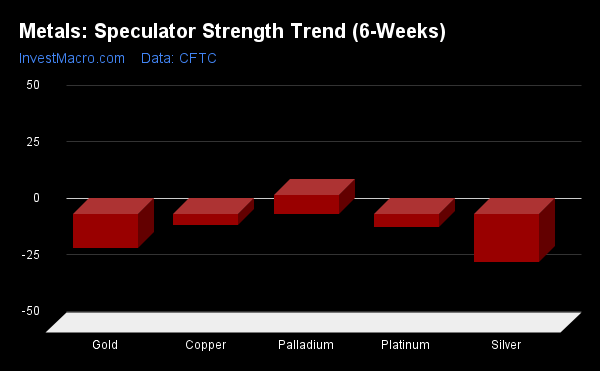
Strength Trends
Strength Score Trends (or move index, calculates the 6-week changes in strength scores) show that Heating Oil (27.1 percent) is getting the most love from speculators lately and leads the past six weeks trends for energy. Gasoline (19.7 percent), Brent Crude Oil (4.2 percent) and Natural Gas (2.9 percent) fill out the other positive movers in the latest trends data. The Bloomberg Commodity Index (-20.7 percent) leads the downside trend scores currently while the next market with lower trend scores is WTI Crude Oil (-17.3 percent).
Strength Trend Statistics:
WTI Crude Oil (-17.3 percent) vs WTI Crude Oil previous week (-23.5 percent)
Brent Crude Oil (4.2 percent) vs Brent Crude Oil previous week (14.2 percent)
Natural Gas (2.9 percent) vs Natural Gas previous week (1.2 percent)
Gasoline (19.7 percent) vs Gasoline previous week (13.4 percent)
Heating Oil (27.1 percent) vs Heating Oil previous week (24.9 percent)
Bloomberg Commodity Index (-20.7 percent) vs Bloomberg Commodity Index previous week (-20.3 percent)
Individual Markets:
WTI Crude Oil Futures:
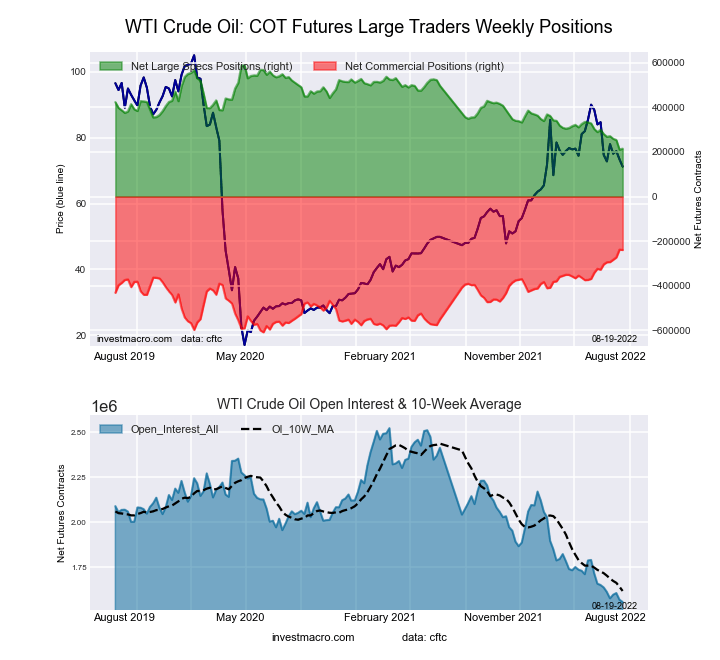 The WTI Crude Oil Futures large speculator standing this week reached a net position of 214,940 contracts in the data reported through Tuesday. This was a weekly increase of 4,289 contracts from the previous week which had a total of 210,651 net contracts.
This week’s current strength score (the trader positioning range over the past three years, measured from 0 to 100) shows the speculators are currently Bearish-Extreme with a score of 1.1 percent. The commercials are Bullish-Extreme with a score of 99.7 percent and the small traders (not shown in chart) are Bearish with a score of 48.3 percent.
| WTI Crude Oil Futures Statistics | SPECULATORS | COMMERCIALS | SMALL TRADERS |
| – Percent of Open Interest Longs: | 22.3 | 41.0 | 5.1 |
| – Percent of Open Interest Shorts: | 8.5 | 56.4 | 3.5 |
| – Net Position: | 214,940 | -239,291 | 24,351 |
| – Gross Longs: | 346,865 | 638,971 | 78,715 |
| – Gross Shorts: | 131,925 | 878,262 | 54,364 |
| – Long to Short Ratio: | 2.6 to 1 | 0.7 to 1 | 1.4 to 1 |
| NET POSITION TREND: | |||
| – Strength Index Score (3 Year Range Pct): | 1.1 | 99.7 | 48.3 |
| – Strength Index Reading (3 Year Range): | Bearish-Extreme | Bullish-Extreme | Bearish |
| NET POSITION MOVEMENT INDEX: | |||
| – 6-Week Change in Strength Index: | -17.3 | 17.5 | 0.9 |
Brent Crude Oil Futures:
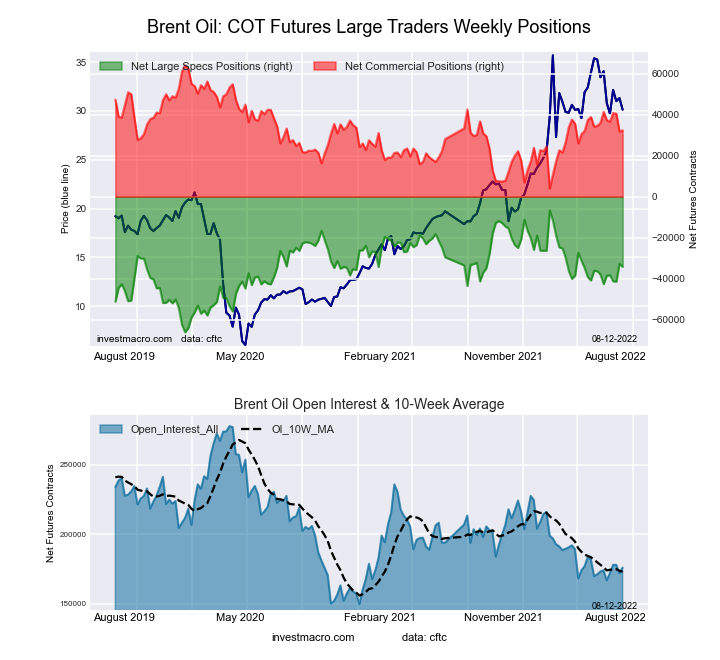
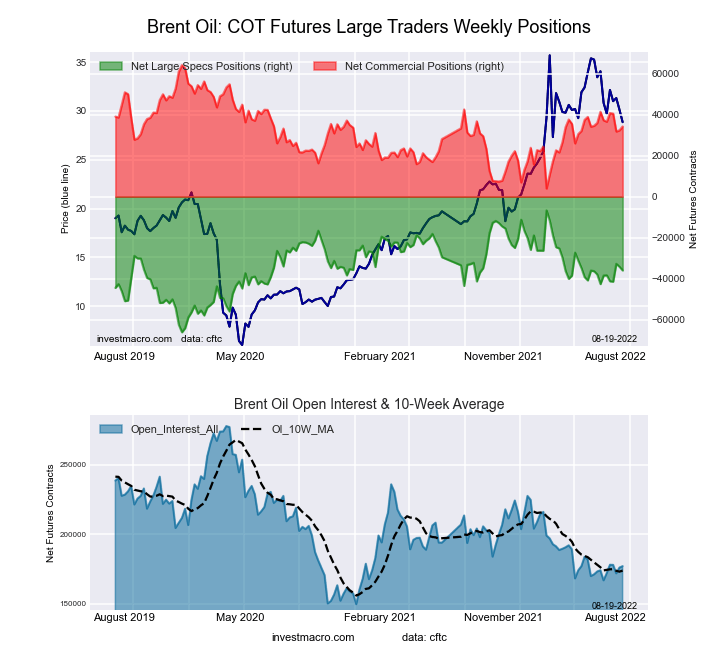 The Brent Crude Oil Futures large speculator standing this week reached a net position of -36,012 contracts in the data reported through Tuesday. This was a weekly lowering of -1,801 contracts from the previous week which had a total of -34,211 net contracts.
This week’s current strength score (the trader positioning range over the past three years, measured from 0 to 100) shows the speculators are currently Bullish with a score of 50.8 percent. The commercials are Bullish with a score of 50.3 percent and the small traders (not shown in chart) are Bearish with a score of 32.5 percent.
| Brent Crude Oil Futures Statistics | SPECULATORS | COMMERCIALS | SMALL TRADERS |
| – Percent of Open Interest Longs: | 18.7 | 50.8 | 4.1 |
| – Percent of Open Interest Shorts: | 39.0 | 31.4 | 3.1 |
| – Net Position: | -36,012 | 34,290 | 1,722 |
| – Gross Longs: | 33,017 | 89,828 | 7,241 |
| – Gross Shorts: | 69,029 | 55,538 | 5,519 |
| – Long to Short Ratio: | 0.5 to 1 | 1.6 to 1 | 1.3 to 1 |
| NET POSITION TREND: | |||
| – Strength Index Score (3 Year Range Pct): | 50.8 | 50.3 | 32.5 |
| – Strength Index Reading (3 Year Range): | Bullish | Bullish | Bearish |
| NET POSITION MOVEMENT INDEX: | |||
| – 6-Week Change in Strength Index: | 4.2 | -5.0 | 7.0 |
Natural Gas Futures:
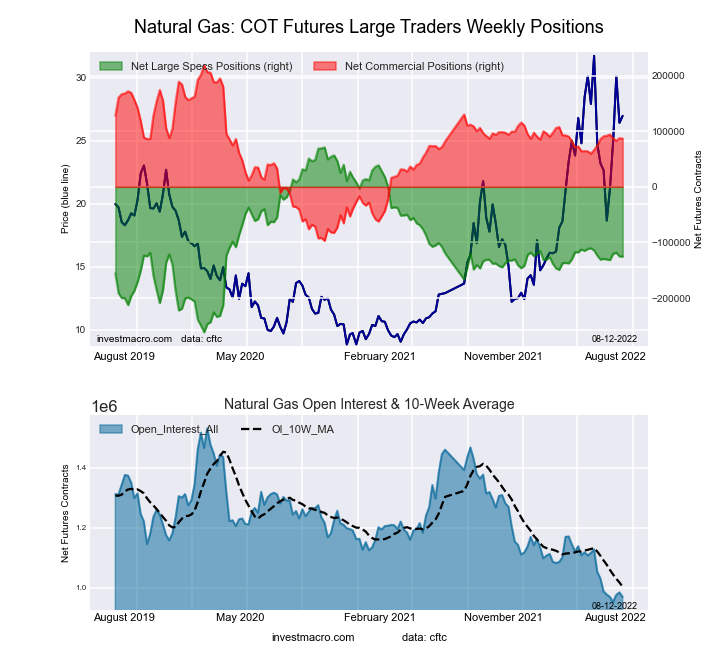
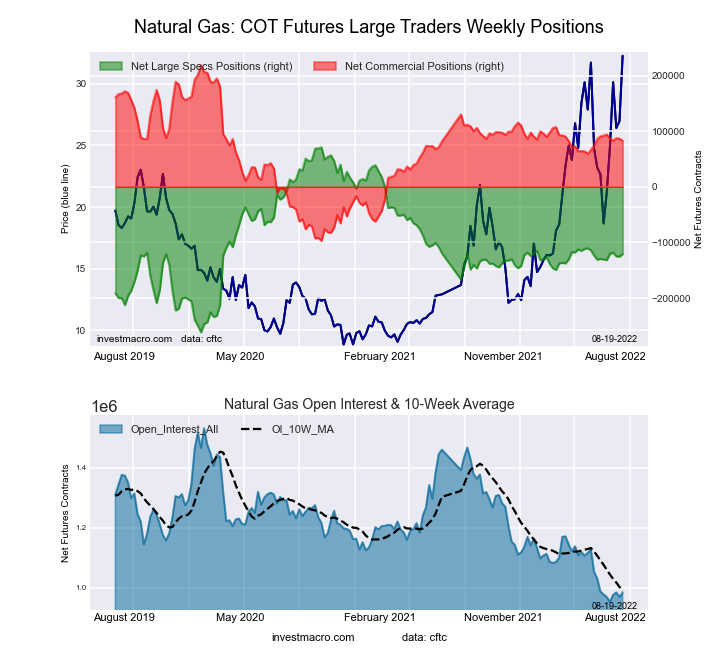 The Natural Gas Futures large speculator standing this week reached a net position of -120,911 contracts in the data reported through Tuesday. This was a weekly lift of 4,508 contracts from the previous week which had a total of -125,419 net contracts.
This week’s current strength score (the trader positioning range over the past three years, measured from 0 to 100) shows the speculators are currently Bearish with a score of 42.3 percent. The commercials are Bullish with a score of 57.0 percent and the small traders (not shown in chart) are Bullish with a score of 70.2 percent.
| Natural Gas Futures Statistics | SPECULATORS | COMMERCIALS | SMALL TRADERS |
| – Percent of Open Interest Longs: | 17.3 | 42.2 | 6.9 |
| – Percent of Open Interest Shorts: | 29.6 | 33.8 | 3.0 |
| – Net Position: | -120,911 | 82,862 | 38,049 |
| – Gross Longs: | 170,133 | 415,171 | 67,826 |
| – Gross Shorts: | 291,044 | 332,309 | 29,777 |
| – Long to Short Ratio: | 0.6 to 1 | 1.2 to 1 | 2.3 to 1 |
| NET POSITION TREND: | |||
| – Strength Index Score (3 Year Range Pct): | 42.3 | 57.0 | 70.2 |
| – Strength Index Reading (3 Year Range): | Bearish | Bullish | Bullish |
| NET POSITION MOVEMENT INDEX: | |||
| – 6-Week Change in Strength Index: | 2.9 | -2.9 | -1.2 |
Gasoline Blendstock Futures:
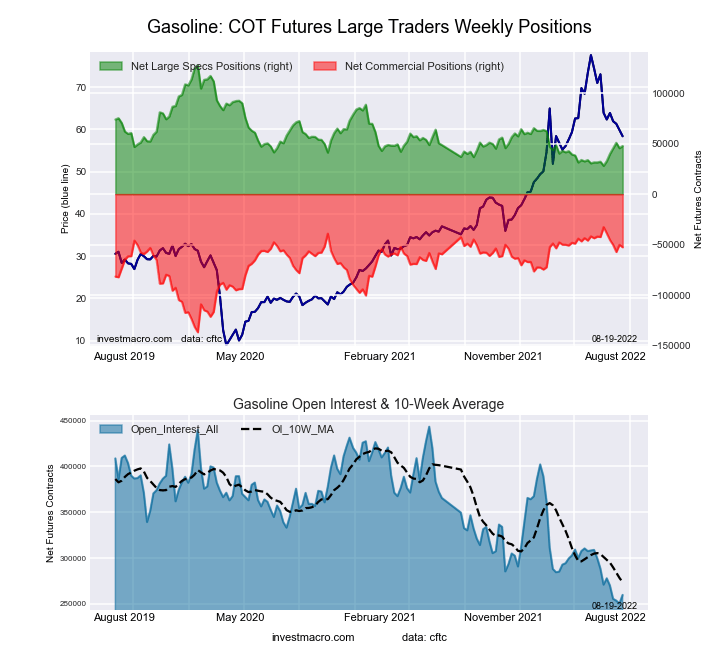 The Gasoline Blendstock Futures large speculator standing this week reached a net position of 47,669 contracts in the data reported through Tuesday. This was a weekly advance of 2,163 contracts from the previous week which had a total of 45,506 net contracts.
This week’s current strength score (the trader positioning range over the past three years, measured from 0 to 100) shows the speculators are currently Bearish-Extreme with a score of 19.7 percent. The commercials are Bullish-Extreme with a score of 80.9 percent and the small traders (not shown in chart) are Bearish with a score of 45.8 percent.
| Nasdaq Mini Futures Statistics | SPECULATORS | COMMERCIALS | SMALL TRADERS |
| – Percent of Open Interest Longs: | 31.3 | 48.1 | 7.9 |
| – Percent of Open Interest Shorts: | 13.0 | 68.3 | 6.0 |
| – Net Position: | 47,669 | -52,630 | 4,961 |
| – Gross Longs: | 81,394 | 124,919 | 20,499 |
| – Gross Shorts: | 33,725 | 177,549 | 15,538 |
| – Long to Short Ratio: | 2.4 to 1 | 0.7 to 1 | 1.3 to 1 |
| NET POSITION TREND: | |||
| – Strength Index Score (3 Year Range Pct): | 19.7 | 80.9 | 45.8 |
| – Strength Index Reading (3 Year Range): | Bearish-Extreme | Bullish-Extreme | Bearish |
| NET POSITION MOVEMENT INDEX: | |||
| – 6-Week Change in Strength Index: | 19.7 | -19.1 | 1.9 |
#2 Heating Oil NY-Harbor Futures:
 The #2 Heating Oil NY-Harbor Futures large speculator standing this week reached a net position of 24,926 contracts in the data reported through Tuesday. This was a weekly rise of 462 contracts from the previous week which had a total of 24,464 net contracts.
This week’s current strength score (the trader positioning range over the past three years, measured from 0 to 100) shows the speculators are currently Bullish with a score of 79.1 percent. The commercials are Bearish with a score of 28.6 percent and the small traders (not shown in chart) are Bullish with a score of 50.6 percent.
| Heating Oil Futures Statistics | SPECULATORS | COMMERCIALS | SMALL TRADERS |
| – Percent of Open Interest Longs: | 15.5 | 52.1 | 13.8 |
| – Percent of Open Interest Shorts: | 7.1 | 65.6 | 8.7 |
| – Net Position: | 24,926 | -40,022 | 15,096 |
| – Gross Longs: | 46,048 | 154,772 | 41,070 |
| – Gross Shorts: | 21,122 | 194,794 | 25,974 |
| – Long to Short Ratio: | 2.2 to 1 | 0.8 to 1 | 1.6 to 1 |
| NET POSITION TREND: | |||
| – Strength Index Score (3 Year Range Pct): | 79.1 | 28.6 | 50.6 |
| – Strength Index Reading (3 Year Range): | Bullish | Bearish | Bullish |
| NET POSITION MOVEMENT INDEX: | |||
| – 6-Week Change in Strength Index: | 27.1 | -18.4 | -4.1 |
Bloomberg Commodity Index Futures:
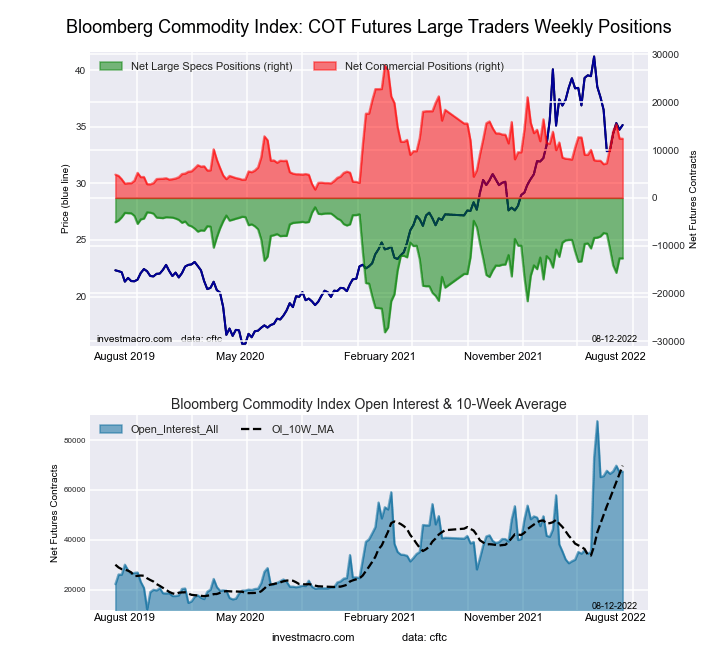
 The Bloomberg Commodity Index Futures large speculator standing this week reached a net position of -12,887 contracts in the data reported through Tuesday. This was a weekly lowering of -231 contracts from the previous week which had a total of -12,656 net contracts.
This week’s current strength score (the trader positioning range over the past three years, measured from 0 to 100) shows the speculators are currently Bullish with a score of 58.2 percent. The commercials are Bearish with a score of 41.7 percent and the small traders (not shown in chart) are Bearish with a score of 21.0 percent.
| Bloomberg Index Futures Statistics | SPECULATORS | COMMERCIALS | SMALL TRADERS |
| – Percent of Open Interest Longs: | 23.0 | 75.0 | 0.5 |
| – Percent of Open Interest Shorts: | 42.3 | 56.2 | 0.1 |
| – Net Position: | -12,887 | 12,595 | 292 |
| – Gross Longs: | 15,330 | 50,098 | 339 |
| – Gross Shorts: | 28,217 | 37,503 | 47 |
| – Long to Short Ratio: | 0.5 to 1 | 1.3 to 1 | 7.2 to 1 |
| NET POSITION TREND: | |||
| – Strength Index Score (3 Year Range Pct): | 58.2 | 41.7 | 21.0 |
| – Strength Index Reading (3 Year Range): | Bullish | Bearish | Bearish |
| NET POSITION MOVEMENT INDEX: | |||
| – 6-Week Change in Strength Index: | -20.7 | 20.6 | 1.9 |
Article By InvestMacro – Receive our weekly COT Reports by Email
*COT Report: The COT data, released weekly to the public each Friday, is updated through the most recent Tuesday (data is 3 days old) and shows a quick view of how large speculators or non-commercials (for-profit traders) were positioned in the futures markets.
The CFTC categorizes trader positions according to commercial hedgers (traders who use futures contracts for hedging as part of the business), non-commercials (large traders who speculate to realize trading profits) and nonreportable traders (usually small traders/speculators) as well as their open interest (contracts open in the market at time of reporting).See CFTC criteria here.


