
By InvestMacro | COT | Data Tables | COT Leaders | Downloads | COT Newsletter
Here are the latest charts and statistics for the Commitment of Traders (COT) data published by the Commodities Futures Trading Commission (CFTC).
The latest COT data is updated through Tuesday August 9th and shows a quick view of how large traders (for-profit speculators and commercial entities) were positioned in the futures markets.
Weekly Speculator Changes
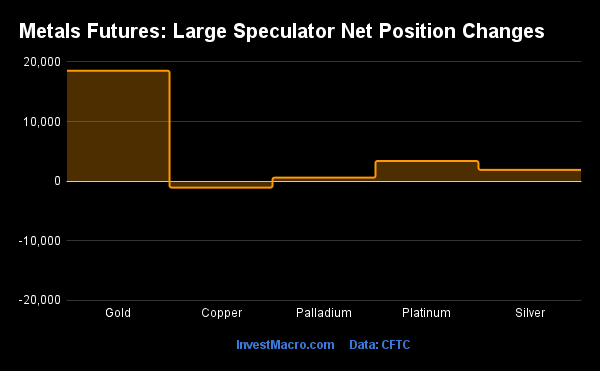
COT precious metals speculator bets were higher again this week as five out of the five metals markets we cover had higher positioning this week while just one market had lower weekly contracts.
Leading the gains for the precious metals markets was Gold (18,525 contracts) with Platinum (3,387 contracts), Silver (1,905 contracts) and Palladium (590 contracts) also showing positive weeks.
Free Reports:
 Sign Up for Our Stock Market Newsletter – Get updated on News, Charts & Rankings of Public Companies when you join our Stocks Newsletter
 Get our Weekly Commitment of Traders Reports - See where the biggest traders (Hedge Funds and Commercial Hedgers) are positioned in the futures markets on a weekly basis.
The only metals markets with a decline in speculator bets this week was Copper with a decrease of -1,071 contracts.
Highlighting the COT metals changes this week is the strong rebound in Gold speculator bets over the past two weeks. This week’s +18,525 contract rise followed last week’s +31,636 contract jump for a two-week gain of approximately +50,000 contracts. This positive speculator sentiment has pushed the Gold bullish level to the highest of the past five weeks. Previously on July 26th, the Gold speculator level had fallen to the lowest level in one hundred and sixty-five weeks, dating back to May 28th of 2019 and near the height of the COVID-19 pandemic panic when most markets were going haywire. The Gold futures price has been on the rebound as well after hitting a recent low near $1,678.50 on July 21st. The Gold price has had four straight positive weeks and closed out this week near the $1,815.50 level.
Silver speculator contracts rose this week for a second consecutive week and rose a little further away from bearish territory. The Silver speculator positions had previously dropped into bearish territory on July 26th, a rare occurrence and the first time it has happened since June 4th of 2019 (a span of 164 weeks). Silver bets have seen a modest rebound over the past two weeks while the Silver futures price has risen in two out of the past three weeks. Silver is back above the $20 threshold after bouncing off the $18 level for a few weeks in July.
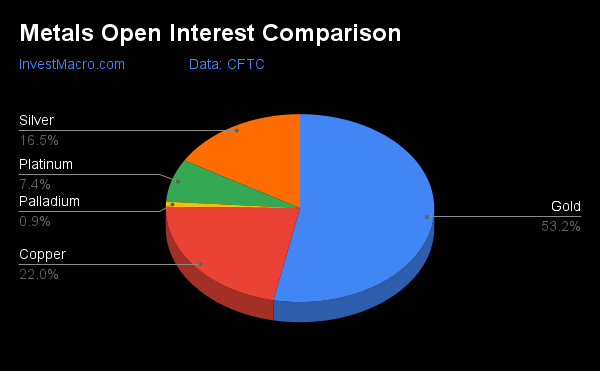
| Aug-09-2022 | OI | OI-Index | Spec-Net | Spec-Index | Com-Net | COM-Index | Smalls-Net | Smalls-Index |
|---|---|---|---|---|---|---|---|---|
| WTI Crude | 1,570,131 | 0 | 210,651 | 0 | -238,073 | 100 | 27,422 | 53 |
| Gold | 453,540 | 0 | 142,851 | 19 | -154,554 | 83 | 11,703 | 1 |
| Silver | 141,093 | 8 | 2,879 | 9 | -13,574 | 89 | 10,695 | 21 |
| Copper | 187,988 | 21 | -28,477 | 22 | 27,700 | 78 | 777 | 30 |
| Palladium | 7,619 | 6 | -1,970 | 12 | 2,044 | 86 | -74 | 40 |
| Platinum | 62,782 | 26 | 846 | 9 | -4,055 | 93 | 3,209 | 7 |
| Natural Gas | 969,582 | 3 | -125,419 | 41 | 86,734 | 58 | 38,685 | 72 |
| Brent | 175,896 | 21 | -34,211 | 54 | 32,411 | 47 | 1,800 | 34 |
| Heating Oil | 283,749 | 29 | 24,464 | 78 | -36,472 | 32 | 12,008 | 40 |
| Soybeans | 583,208 | 2 | 88,901 | 41 | -62,971 | 65 | -25,930 | 27 |
| Corn | 1,317,913 | 1 | 210,786 | 57 | -160,654 | 49 | -50,132 | 14 |
| Coffee | 209,446 | 13 | 30,453 | 65 | -31,268 | 41 | 815 | 7 |
| Sugar | 765,669 | 12 | 26,065 | 42 | -30,608 | 62 | 4,543 | 13 |
| Wheat | 320,767 | 14 | -3,426 | 15 | 9,939 | 74 | -6,513 | 77 |
Strength Scores
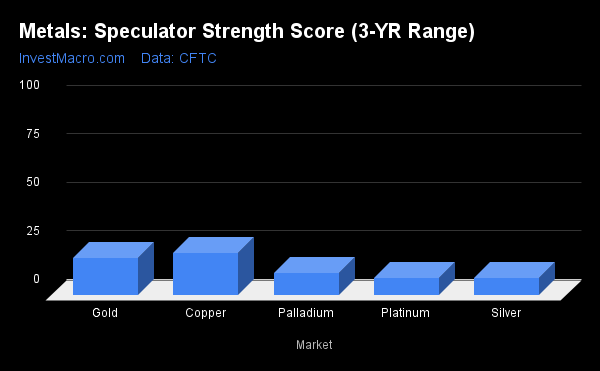
Strength scores (a measure of the 3-Year range of Speculator positions, from 0 to 100 where above 80 is extreme bullish and below 20 is extreme bearish) showed that Copper (21.9 percent) continues to be the leader in strength scores but is at a very low level. The rest of the metals all remain in a bearish extreme position (below 20 percent) and have been there for many consecutive weeks. Despite the persistent weak sentiment, all metals except Copper have started seeing improvements week-over-week with Gold rising by 7.1 percent this week.
Strength Statistics:
Gold (19.2 percent) vs Gold previous week (12.1 percent)
Silver (9.0 percent) vs Silver previous week (6.6 percent)
Copper (21.9 percent) vs Copper previous week (22.6 percent)
Platinum (9.2 percent) vs Platinum previous week (4.6 percent)
Palladium (11.7 percent) vs Palladium previous week (8.4 percent)
Strength Trends
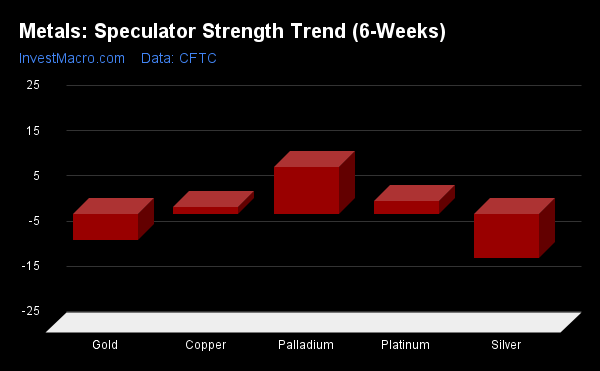
Strength Score Trends (or move index, calculates the 6-week changes in strength scores) showed that the Palladium (10.4 percent) leads the past six weeks trends for metals this week. Platinum (2.9 percent) and Copper (1.6 percent) fill out the other positive movers in the latest trends data. Silver (-9.7 percent) leads the downside trend scores currently but is improving compared to last week’s -21.2 percent trend. Gold is at -5.7 percent this week and also has improved compared to last week’s -14.9 percent trend score.
Strength Trends Statistics:
Gold (-5.7 percent) vs Gold previous week (-14.9 percent)
Silver (-9.7 percent) vs Silver previous week (-21.2 percent)
Copper (1.6 percent) vs Copper previous week (-4.7 percent)
Platinum (2.9 percent) vs Platinum previous week (-5.5 percent)
Palladium (10.4 percent) vs Palladium previous week (8.4 percent)
Individual Markets:
Gold Comex Futures:
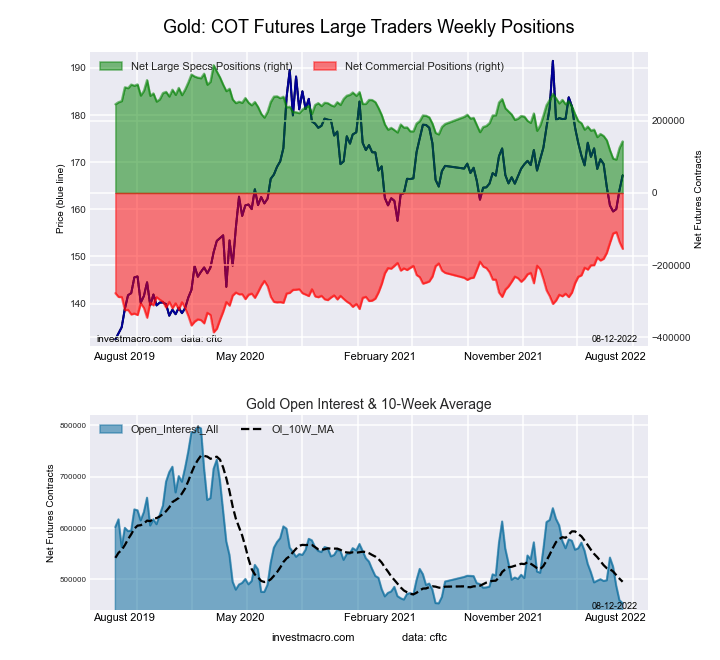 The Gold Comex Futures large speculator standing this week resulted in a net position of 142,851 contracts in the data reported through Tuesday. This was a weekly advance of 18,525 contracts from the previous week which had a total of 124,326 net contracts.
This week’s current strength score (the trader positioning range over the past three years, measured from 0 to 100) shows the speculators are currently Bearish-Extreme with a score of 19.2 percent. The commercials are Bullish-Extreme with a score of 83.4 percent and the small traders (not shown in chart) are Bearish-Extreme with a score of 1.3 percent.
| Gold Futures Statistics | SPECULATORS | COMMERCIALS | SMALL TRADERS |
| – Percent of Open Interest Longs: | 53.6 | 26.9 | 8.4 |
| – Percent of Open Interest Shorts: | 22.1 | 61.0 | 5.8 |
| – Net Position: | 142,851 | -154,554 | 11,703 |
| – Gross Longs: | 242,906 | 121,980 | 37,927 |
| – Gross Shorts: | 100,055 | 276,534 | 26,224 |
| – Long to Short Ratio: | 2.4 to 1 | 0.4 to 1 | 1.4 to 1 |
| NET POSITION TREND: | |||
| – Strength Index Score (3 Year Range Pct): | 19.2 | 83.4 | 1.3 |
| – Strength Index Reading (3 Year Range): | Bearish-Extreme | Bullish-Extreme | Bearish-Extreme |
| NET POSITION MOVEMENT INDEX: | |||
| – 6-Week Change in Strength Index: | -5.7 | 9.9 | -34.5 |
Silver Comex Futures:
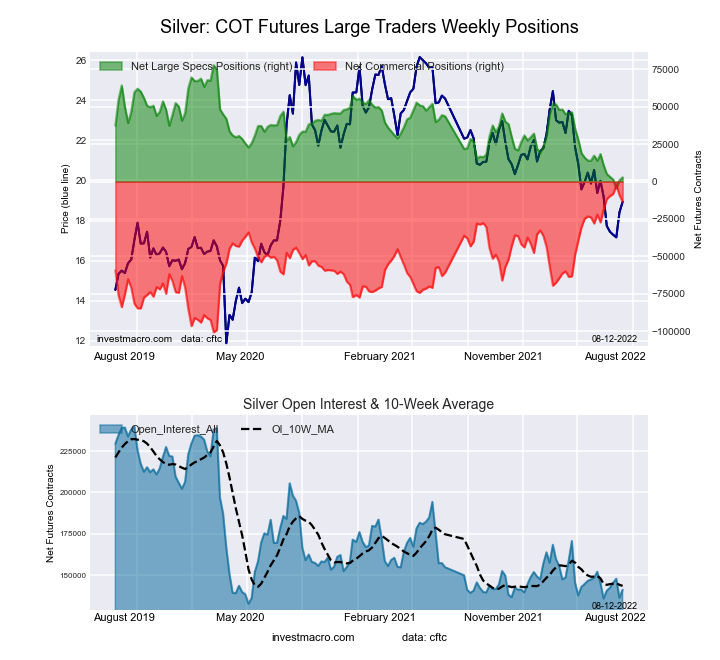 The Silver Comex Futures large speculator standing this week resulted in a net position of 2,879 contracts in the data reported through Tuesday. This was a weekly advance of 1,905 contracts from the previous week which had a total of 974 net contracts.
This week’s current strength score (the trader positioning range over the past three years, measured from 0 to 100) shows the speculators are currently Bearish-Extreme with a score of 9.0 percent. The commercials are Bullish-Extreme with a score of 88.9 percent and the small traders (not shown in chart) are Bearish with a score of 20.8 percent.
| Silver Futures Statistics | SPECULATORS | COMMERCIALS | SMALL TRADERS |
| – Percent of Open Interest Longs: | 34.6 | 40.3 | 17.1 |
| – Percent of Open Interest Shorts: | 32.6 | 49.9 | 9.5 |
| – Net Position: | 2,879 | -13,574 | 10,695 |
| – Gross Longs: | 48,864 | 56,876 | 24,122 |
| – Gross Shorts: | 45,985 | 70,450 | 13,427 |
| – Long to Short Ratio: | 1.1 to 1 | 0.8 to 1 | 1.8 to 1 |
| NET POSITION TREND: | |||
| – Strength Index Score (3 Year Range Pct): | 9.0 | 88.9 | 20.8 |
| – Strength Index Reading (3 Year Range): | Bearish-Extreme | Bullish-Extreme | Bearish |
| NET POSITION MOVEMENT INDEX: | |||
| – 6-Week Change in Strength Index: | -9.7 | 5.0 | 15.1 |
Copper Grade #1 Futures:
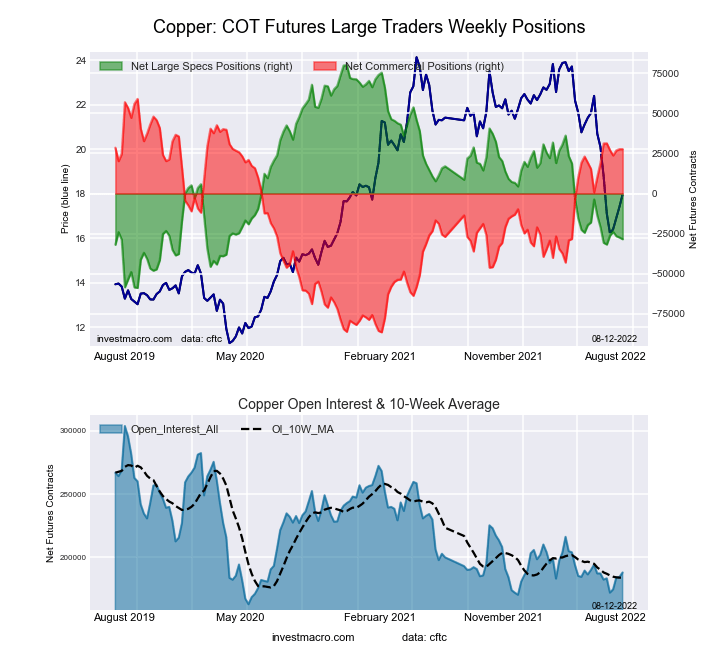 The Copper Grade #1 Futures large speculator standing this week resulted in a net position of -28,477 contracts in the data reported through Tuesday. This was a weekly reduction of -1,071 contracts from the previous week which had a total of -27,406 net contracts.
This week’s current strength score (the trader positioning range over the past three years, measured from 0 to 100) shows the speculators are currently Bearish with a score of 21.9 percent. The commercials are Bullish with a score of 78.5 percent and the small traders (not shown in chart) are Bearish with a score of 29.8 percent.
| Copper Futures Statistics | SPECULATORS | COMMERCIALS | SMALL TRADERS |
| – Percent of Open Interest Longs: | 26.3 | 45.3 | 7.9 |
| – Percent of Open Interest Shorts: | 41.5 | 30.5 | 7.5 |
| – Net Position: | -28,477 | 27,700 | 777 |
| – Gross Longs: | 49,477 | 85,085 | 14,822 |
| – Gross Shorts: | 77,954 | 57,385 | 14,045 |
| – Long to Short Ratio: | 0.6 to 1 | 1.5 to 1 | 1.1 to 1 |
| NET POSITION TREND: | |||
| – Strength Index Score (3 Year Range Pct): | 21.9 | 78.5 | 29.8 |
| – Strength Index Reading (3 Year Range): | Bearish | Bullish | Bearish |
| NET POSITION MOVEMENT INDEX: | |||
| – 6-Week Change in Strength Index: | 1.6 | -2.4 | 7.4 |
Platinum Futures:
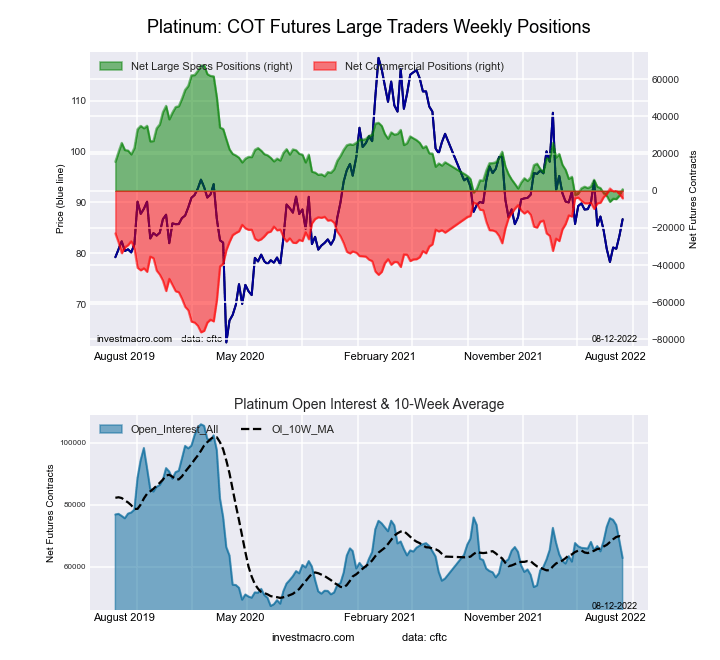 The Platinum Futures large speculator standing this week resulted in a net position of 846 contracts in the data reported through Tuesday. This was a weekly increase of 3,387 contracts from the previous week which had a total of -2,541 net contracts.
This week’s current strength score (the trader positioning range over the past three years, measured from 0 to 100) shows the speculators are currently Bearish-Extreme with a score of 9.2 percent. The commercials are Bullish-Extreme with a score of 93.2 percent and the small traders (not shown in chart) are Bearish-Extreme with a score of 6.7 percent.
| Platinum Futures Statistics | SPECULATORS | COMMERCIALS | SMALL TRADERS |
| – Percent of Open Interest Longs: | 44.2 | 38.9 | 10.8 |
| – Percent of Open Interest Shorts: | 42.9 | 45.4 | 5.7 |
| – Net Position: | 846 | -4,055 | 3,209 |
| – Gross Longs: | 27,754 | 24,450 | 6,803 |
| – Gross Shorts: | 26,908 | 28,505 | 3,594 |
| – Long to Short Ratio: | 1.0 to 1 | 0.9 to 1 | 1.9 to 1 |
| NET POSITION TREND: | |||
| – Strength Index Score (3 Year Range Pct): | 9.2 | 93.2 | 6.7 |
| – Strength Index Reading (3 Year Range): | Bearish-Extreme | Bullish-Extreme | Bearish-Extreme |
| NET POSITION MOVEMENT INDEX: | |||
| – 6-Week Change in Strength Index: | 2.9 | -0.9 | -20.7 |
Palladium Futures:
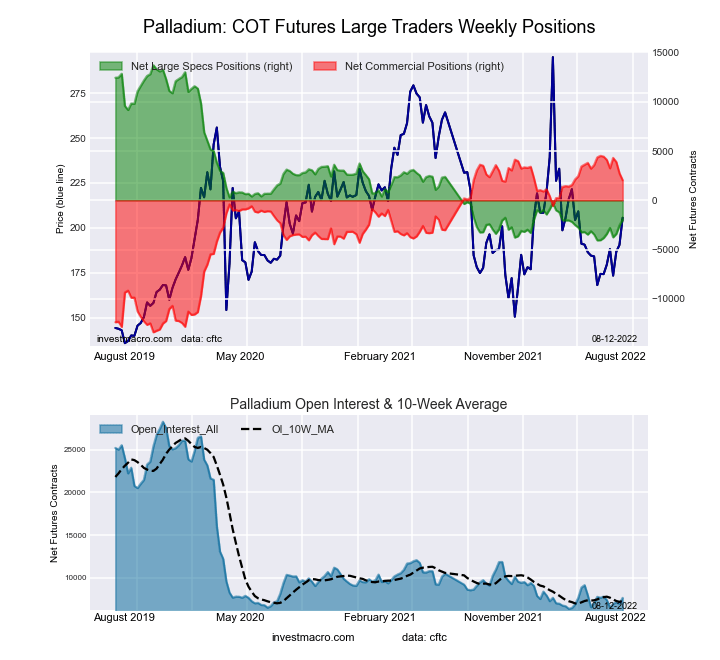 The Palladium Futures large speculator standing this week resulted in a net position of -1,970 contracts in the data reported through Tuesday. This was a weekly lift of 590 contracts from the previous week which had a total of -2,560 net contracts.
This week’s current strength score (the trader positioning range over the past three years, measured from 0 to 100) shows the speculators are currently Bearish-Extreme with a score of 11.7 percent. The commercials are Bullish-Extreme with a score of 86.2 percent and the small traders (not shown in chart) are Bearish with a score of 39.6 percent.
| Palladium Futures Statistics | SPECULATORS | COMMERCIALS | SMALL TRADERS |
| – Percent of Open Interest Longs: | 17.5 | 58.8 | 15.6 |
| – Percent of Open Interest Shorts: | 43.3 | 32.0 | 16.6 |
| – Net Position: | -1,970 | 2,044 | -74 |
| – Gross Longs: | 1,331 | 4,482 | 1,191 |
| – Gross Shorts: | 3,301 | 2,438 | 1,265 |
| – Long to Short Ratio: | 0.4 to 1 | 1.8 to 1 | 0.9 to 1 |
| NET POSITION TREND: | |||
| – Strength Index Score (3 Year Range Pct): | 11.7 | 86.2 | 39.6 |
| – Strength Index Reading (3 Year Range): | Bearish-Extreme | Bullish-Extreme | Bearish |
| NET POSITION MOVEMENT INDEX: | |||
| – 6-Week Change in Strength Index: | 10.4 | -13.4 | 31.4 |
Article By InvestMacro – Receive our weekly COT Reports by Email
*COT Report: The COT data, released weekly to the public each Friday, is updated through the most recent Tuesday (data is 3 days old) and shows a quick view of how large speculators or non-commercials (for-profit traders) were positioned in the futures markets.
The CFTC categorizes trader positions according to commercial hedgers (traders who use futures contracts for hedging as part of the business), non-commercials (large traders who speculate to realize trading profits) and nonreportable traders (usually small traders/speculators) as well as their open interest (contracts open in the market at time of reporting).See CFTC criteria here.

- Geopolitical and macroeconomic conditions continue to pressure market sentiment Jul 20, 2026
- USD/JPY Poised to Continue Gains as Expensive Oil and Lack of Support Weigh on Yen Jul 20, 2026
- COT Metals Charts: Weekly Speculator Bets led by Copper & Steel Jul 18, 2026
- COT Bonds Charts: Weekly Speculator Bets led by 2-Year, SOFR 3M & 5-Year Bonds Jul 18, 2026
- COT Energy Charts: Weekly Speculator Bets led by Brent Oil & Heating Oil Jul 18, 2026
- COT Soft Commodities Charts: Weekly Speculator Bets led by Wheat, Corn & Soybean Meal Jul 18, 2026
- The Bank of Canada kept its interest rate unchanged. Platinum prices reached a three‑week high Jul 16, 2026
- Stock indices rose after the release of US inflation data. China’s GDP slowed sharply Jul 15, 2026
- GBP/USD Awaits Political News: What Will Happen Next Jul 15, 2026
- USD/JPY Holds at Highs: Pressure Lingers on Yen Jul 14, 2026