Archive for CountingPips Forex Blog – Page 16

COT Bonds Speculators cut their bearish 5-Year Treasuries bets for 3rd week

By InvestMacro | COT | Data Tables | COT Leaders | Downloads | COT Newsletter

Here are the latest charts and statistics for the Commitment of Traders (COT) data published by the Commodities Futures Trading Commission (CFTC).

The latest COT data is updated through Tuesday January 25th and shows a quick view of how large traders (for-profit speculators and commercial entities) were positioned in the futures markets.

Highlighting the COT bonds data is the continued improvement in the 5-Year Bond speculator positions. Speculative positioning in the 5-Year has seen bearish bets sharply falling for the third consecutive week and by a total of 262,418 contracts over that time-frame. This improvement in the 5-Year brings the net speculator standing to the least bearish level in nineteen weeks, dating back to September 14th when the spec standing was -24,366 contracts.

Joining the 5-Year (76,717 contracts) in gaining this week were the 2-Year Bond (-6,759 contracts), 10-Year (6,786 contracts), Ultra 10-Year (18,302 contracts) and the Fed Funds (61,711 contracts) while decreasing bets for the week were seen in Ultra US Bond (-4,895 contracts), Long US Bond (-16,599 contracts) and the Eurodollar (-294,011 contracts).


Data Snapshot of Bond Market Traders | Columns Legend
Jan-25-2022OIOI-IndexSpec-NetSpec-IndexCom-NetCOM-IndexSmalls-NetSmalls-Index
Eurodollar11,211,59749-2,121,30402,542,838100-421,53414
FedFunds1,790,9015849,43746-26,16157-23,2764
2-Year2,112,0071331,8778932,98327-64,8604
Long T-Bond1,193,45048-64,0957074,28144-10,18645
10-Year3,750,56447-264,65631500,63185-235,97524
5-Year3,979,85246-140,45757401,40766-260,9509


3-Month Eurodollars Futures:

Eurodollar Bonds Futures COT ChartThe 3-Month Eurodollars large speculator standing this week came in at a net position of -2,121,304 contracts in the data reported through Tuesday. This was a weekly decrease of -294,011 contracts from the previous week which had a total of -1,827,293 net contracts.

This week’s current strength score (the trader positioning range over the past three years, measured from 0 to 100) shows the speculators are currently Bearish-Extreme with a score of 0.0 percent. The commercials are Bullish-Extreme with a score of 100.0 percent and the small traders (not shown in chart) are Bearish-Extreme with a score of 14.2 percent.

3-Month Eurodollars StatisticsSPECULATORSCOMMERCIALSSMALL TRADERS
– Percent of Open Interest Longs:6.774.73.9
– Percent of Open Interest Shorts:25.752.17.7
– Net Position:-2,121,3042,542,838-421,534
– Gross Longs:756,3588,378,627438,371
– Gross Shorts:2,877,6625,835,789859,905
– Long to Short Ratio:0.3 to 11.4 to 10.5 to 1
NET POSITION TREND:
– Strength Index Score (3 Year Range Pct):0.0100.014.2
– Strength Index Reading (3 Year Range):Bearish-ExtremeBullish-ExtremeBearish-Extreme
NET POSITION MOVEMENT INDEX:
– 6-Week Change in Strength Index:-8.67.56.9


30-Day Federal Funds Futures:

Federal Funds 30-Day Bonds Futures COT ChartThe 30-Day Federal Funds large speculator standing this week came in at a net position of 49,437 contracts in the data reported through Tuesday. This was a weekly increase of 61,711 contracts from the previous week which had a total of -12,274 net contracts.

This week’s current strength score (the trader positioning range over the past three years, measured from 0 to 100) shows the speculators are currently Bearish with a score of 45.7 percent. The commercials are Bullish with a score of 56.7 percent and the small traders (not shown in chart) are Bearish-Extreme with a score of 4.2 percent.

30-Day Federal Funds StatisticsSPECULATORSCOMMERCIALSSMALL TRADERS
– Percent of Open Interest Longs:7.172.41.3
– Percent of Open Interest Shorts:4.473.82.6
– Net Position:49,437-26,161-23,276
– Gross Longs:127,9251,296,35023,599
– Gross Shorts:78,4881,322,51146,875
– Long to Short Ratio:1.6 to 11.0 to 10.5 to 1
NET POSITION TREND:
– Strength Index Score (3 Year Range Pct):45.756.74.2
– Strength Index Reading (3 Year Range):BearishBullishBearish-Extreme
NET POSITION MOVEMENT INDEX:
– 6-Week Change in Strength Index:17.1-15.6-25.6


2-Year Treasury Note Futures:

2-Year Treasury Bonds Futures COT ChartThe 2-Year Treasury Note large speculator standing this week came in at a net position of 31,877 contracts in the data reported through Tuesday. This was a weekly reduction of -6,759 contracts from the previous week which had a total of 38,636 net contracts.

This week’s current strength score (the trader positioning range over the past three years, measured from 0 to 100) shows the speculators are currently Bullish-Extreme with a score of 88.7 percent. The commercials are Bearish with a score of 27.0 percent and the small traders (not shown in chart) are Bearish-Extreme with a score of 3.5 percent.

2-Year Treasury Note StatisticsSPECULATORSCOMMERCIALSSMALL TRADERS
– Percent of Open Interest Longs:18.571.26.2
– Percent of Open Interest Shorts:17.069.69.3
– Net Position:31,87732,983-64,860
– Gross Longs:391,5701,503,920130,535
– Gross Shorts:359,6931,470,937195,395
– Long to Short Ratio:1.1 to 11.0 to 10.7 to 1
NET POSITION TREND:
– Strength Index Score (3 Year Range Pct):88.727.03.5
– Strength Index Reading (3 Year Range):Bullish-ExtremeBearishBearish-Extreme
NET POSITION MOVEMENT INDEX:
– 6-Week Change in Strength Index:-2.71.43.5


5-Year Treasury Note Futures:

5-Year Treasury Bonds Futures COT ChartThe 5-Year Treasury Note large speculator standing this week came in at a net position of -140,457 contracts in the data reported through Tuesday. This was a weekly boost of 76,717 contracts from the previous week which had a total of -217,174 net contracts.

This week’s current strength score (the trader positioning range over the past three years, measured from 0 to 100) shows the speculators are currently Bullish with a score of 57.0 percent. The commercials are Bullish with a score of 66.3 percent and the small traders (not shown in chart) are Bearish-Extreme with a score of 9.4 percent.

5-Year Treasury Note StatisticsSPECULATORSCOMMERCIALSSMALL TRADERS
– Percent of Open Interest Longs:10.879.56.6
– Percent of Open Interest Shorts:14.369.413.1
– Net Position:-140,457401,407-260,950
– Gross Longs:429,8363,162,224262,210
– Gross Shorts:570,2932,760,817523,160
– Long to Short Ratio:0.8 to 11.1 to 10.5 to 1
NET POSITION TREND:
– Strength Index Score (3 Year Range Pct):57.066.39.4
– Strength Index Reading (3 Year Range):BullishBullishBearish-Extreme
NET POSITION MOVEMENT INDEX:
– 6-Week Change in Strength Index:36.4-21.5-9.2


10-Year Treasury Note Futures:

10-Year Treasury Notes Bonds Futures COT ChartThe 10-Year Treasury Note large speculator standing this week came in at a net position of -264,656 contracts in the data reported through Tuesday. This was a weekly gain of 6,786 contracts from the previous week which had a total of -271,442 net contracts.

This week’s current strength score (the trader positioning range over the past three years, measured from 0 to 100) shows the speculators are currently Bearish with a score of 31.3 percent. The commercials are Bullish-Extreme with a score of 84.5 percent and the small traders (not shown in chart) are Bearish with a score of 23.7 percent.

10-Year Treasury Note StatisticsSPECULATORSCOMMERCIALSSMALL TRADERS
– Percent of Open Interest Longs:10.877.88.3
– Percent of Open Interest Shorts:17.964.414.6
– Net Position:-264,656500,631-235,975
– Gross Longs:406,2132,917,637312,418
– Gross Shorts:670,8692,417,006548,393
– Long to Short Ratio:0.6 to 11.2 to 10.6 to 1
NET POSITION TREND:
– Strength Index Score (3 Year Range Pct):31.384.523.7
– Strength Index Reading (3 Year Range):BearishBullish-ExtremeBearish
NET POSITION MOVEMENT INDEX:
– 6-Week Change in Strength Index:1.4-3.95.2


Ultra 10-Year Notes Futures:

Ultra 10-Year Treasury Notes Bonds Futures COT ChartThe Ultra 10-Year Notes large speculator standing this week came in at a net position of 94,332 contracts in the data reported through Tuesday. This was a weekly rise of 18,302 contracts from the previous week which had a total of 76,030 net contracts.

This week’s current strength score (the trader positioning range over the past three years, measured from 0 to 100) shows the speculators are currently Bullish with a score of 52.7 percent. The commercials are Bullish with a score of 67.4 percent and the small traders (not shown in chart) are Bearish-Extreme with a score of 9.2 percent.

Ultra 10-Year Notes StatisticsSPECULATORSCOMMERCIALSSMALL TRADERS
– Percent of Open Interest Longs:19.471.37.9
– Percent of Open Interest Shorts:12.665.320.8
– Net Position:94,33282,395-176,727
– Gross Longs:266,673977,595107,990
– Gross Shorts:172,341895,200284,717
– Long to Short Ratio:1.5 to 11.1 to 10.4 to 1
NET POSITION TREND:
– Strength Index Score (3 Year Range Pct):52.767.49.2
– Strength Index Reading (3 Year Range):BullishBullishBearish-Extreme
NET POSITION MOVEMENT INDEX:
– 6-Week Change in Strength Index:-3.63.11.5


US Treasury Bonds Futures:

US Year Treasury Notes Long Bonds Futures COT ChartThe US Treasury Bonds large speculator standing this week came in at a net position of -64,095 contracts in the data reported through Tuesday. This was a weekly fall of -16,599 contracts from the previous week which had a total of -47,496 net contracts.

This week’s current strength score (the trader positioning range over the past three years, measured from 0 to 100) shows the speculators are currently Bullish with a score of 70.4 percent. The commercials are Bearish with a score of 43.8 percent and the small traders (not shown in chart) are Bearish with a score of 44.5 percent.

US Treasury Bonds StatisticsSPECULATORSCOMMERCIALSSMALL TRADERS
– Percent of Open Interest Longs:8.875.214.3
– Percent of Open Interest Shorts:14.269.015.1
– Net Position:-64,09574,281-10,186
– Gross Longs:104,960897,501170,480
– Gross Shorts:169,055823,220180,666
– Long to Short Ratio:0.6 to 11.1 to 10.9 to 1
NET POSITION TREND:
– Strength Index Score (3 Year Range Pct):70.443.844.5
– Strength Index Reading (3 Year Range):BullishBearishBearish
NET POSITION MOVEMENT INDEX:
– 6-Week Change in Strength Index:-9.625.2-41.5


Ultra US Treasury Bonds Futures:

Ultra US Year Treasury Notes Long Bonds Futures COT ChartThe Ultra US Treasury Bonds large speculator standing this week came in at a net position of -343,245 contracts in the data reported through Tuesday. This was a weekly lowering of -4,895 contracts from the previous week which had a total of -338,350 net contracts.

This week’s current strength score (the trader positioning range over the past three years, measured from 0 to 100) shows the speculators are currently Bearish with a score of 45.2 percent. The commercials are Bullish with a score of 67.8 percent and the small traders (not shown in chart) are Bullish with a score of 50.5 percent.

Ultra US Treasury Bonds StatisticsSPECULATORSCOMMERCIALSSMALL TRADERS
– Percent of Open Interest Longs:5.482.411.6
– Percent of Open Interest Shorts:32.158.19.2
– Net Position:-343,245312,27530,970
– Gross Longs:69,0361,059,367149,528
– Gross Shorts:412,281747,092118,558
– Long to Short Ratio:0.2 to 11.4 to 11.3 to 1
NET POSITION TREND:
– Strength Index Score (3 Year Range Pct):45.267.850.5
– Strength Index Reading (3 Year Range):BearishBullishBullish
NET POSITION MOVEMENT INDEX:
– 6-Week Change in Strength Index:-20.725.8-1.3


Article By InvestMacroReceive our weekly COT Reports by Email

*COT Report: The COT data, released weekly to the public each Friday, is updated through the most recent Tuesday (data is 3 days old) and shows a quick view of how large speculators or non-commercials (for-profit traders) were positioned in the futures markets.

The CFTC categorizes trader positions according to commercial hedgers (traders who use futures contracts for hedging as part of the business), non-commercials (large traders who speculate to realize trading profits) and nonreportable traders (usually small traders/speculators) as well as their open interest (contracts open in the market at time of reporting).See CFTC criteria here.

COT Metals Speculators boost Gold bullish bets to highest since Nov. 30th

By InvestMacro | COT | Data Tables | COT Leaders | Downloads | COT Newsletter

Here are the latest charts and statistics for the Commitment of Traders (COT) data published by the Commodities Futures Trading Commission (CFTC).

The latest COT data is updated through Tuesday January 25th and shows a quick view of how large traders (for-profit speculators and commercial entities) were positioned in the futures markets.

Highlighting the COT metals data is the gains in the Gold futures bets. Gold speculator bullish bets jumped by the most contracts in the past eleven weeks this week following three straight weeks of declines. The gain by +25,944 contracts have more than erased the previous three weeks of losses and has pushed the current net speculator standing to the highest level since November 30th at over +220,000 net contracts.

Joining Gold (25,944 contracts) in gaining this week were Silver (2,441 contracts), Copper (4,171 contracts), Platinum (6,563 contracts), Palladium (1,321 contracts).


Data Snapshot of Commodity Market Traders | Columns Legend
Jan-25-2022OIOI-IndexSpec-NetSpec-IndexCom-NetCOM-IndexSmalls-NetSmalls-Index
WTI Crude2,095,99435373,41528-420,6466147,23182
Gold572,07839220,15158-249,7464129,59548
Silver151,7791832,14154-47,6845215,54333
Copper205,7713026,48161-32,836376,35562
Palladium9,03411-1,988102,27490-28628
Platinum53,3901013,79222-19,227825,43538
Natural Gas1,141,7967-124,5354197,5416226,99447
Brent224,56159-25,9367323,862292,07437
Heating Oil360,9693818,00069-40,9592822,95978
Soybeans735,96630148,87267-112,79939-36,07312
Corn1,539,12428439,09886-389,47116-49,62714
Coffee274,3274061,64393-64,95093,30711
Sugar875,99512121,28362-142,9724121,68935
Wheat390,2662911,66157-3,52537-8,13663


Gold Comex Futures:

Gold Futures COT ChartThe Gold Comex Futures large speculator standing this week totaled a net position of 220,151 contracts in the data reported through Tuesday. This was a weekly advance of 25,944 contracts from the previous week which had a total of 194,207 net contracts.

This week’s current strength score (the trader positioning range over the past three years, measured from 0 to 100) shows the speculators are currently Bullish with a score of 57.8 percent. The commercials are Bearish with a score of 41.4 percent and the small traders (not shown in chart) are Bearish with a score of 48.2 percent.

Gold Futures StatisticsSPECULATORSCOMMERCIALSSMALL TRADERS
– Percent of Open Interest Longs:54.822.88.9
– Percent of Open Interest Shorts:16.366.43.7
– Net Position:220,151-249,74629,595
– Gross Longs:313,415130,20850,669
– Gross Shorts:93,264379,95421,074
– Long to Short Ratio:3.4 to 10.3 to 12.4 to 1
NET POSITION TREND:
– Strength Index Score (3 Year Range Pct):57.841.448.2
– Strength Index Reading (3 Year Range):BullishBearishBearish
NET POSITION MOVEMENT INDEX:
– 6-Week Change in Strength Index:5.6-5.61.7


Silver Comex Futures:

Silver Futures COT ChartThe Silver Comex Futures large speculator standing this week totaled a net position of 32,141 contracts in the data reported through Tuesday. This was a weekly rise of 2,441 contracts from the previous week which had a total of 29,700 net contracts.

This week’s current strength score (the trader positioning range over the past three years, measured from 0 to 100) shows the speculators are currently Bullish with a score of 54.4 percent. The commercials are Bullish with a score of 52.1 percent and the small traders (not shown in chart) are Bearish with a score of 33.4 percent.

Silver Futures StatisticsSPECULATORSCOMMERCIALSSMALL TRADERS
– Percent of Open Interest Longs:42.133.018.5
– Percent of Open Interest Shorts:20.964.48.3
– Net Position:32,141-47,68415,543
– Gross Longs:63,92350,13528,132
– Gross Shorts:31,78297,81912,589
– Long to Short Ratio:2.0 to 10.5 to 12.2 to 1
NET POSITION TREND:
– Strength Index Score (3 Year Range Pct):54.452.133.4
– Strength Index Reading (3 Year Range):BullishBullishBearish
NET POSITION MOVEMENT INDEX:
– 6-Week Change in Strength Index:10.1-11.69.7


Copper Grade #1 Futures:

Copper Futures COT ChartThe Copper Grade #1 Futures large speculator standing this week totaled a net position of 26,481 contracts in the data reported through Tuesday. This was a weekly increase of 4,171 contracts from the previous week which had a total of 22,310 net contracts.

This week’s current strength score (the trader positioning range over the past three years, measured from 0 to 100) shows the speculators are currently Bullish with a score of 61.4 percent. The commercials are Bearish with a score of 36.9 percent and the small traders (not shown in chart) are Bullish with a score of 62.0 percent.

Copper Futures StatisticsSPECULATORSCOMMERCIALSSMALL TRADERS
– Percent of Open Interest Longs:38.239.39.0
– Percent of Open Interest Shorts:25.355.35.9
– Net Position:26,481-32,8366,355
– Gross Longs:78,61680,96918,431
– Gross Shorts:52,135113,80512,076
– Long to Short Ratio:1.5 to 10.7 to 11.5 to 1
NET POSITION TREND:
– Strength Index Score (3 Year Range Pct):61.436.962.0
– Strength Index Reading (3 Year Range):BullishBearishBullish
NET POSITION MOVEMENT INDEX:
– 6-Week Change in Strength Index:14.2-13.6-0.3


Platinum Futures:

Platinum Futures COT ChartThe Platinum Futures large speculator standing this week totaled a net position of 13,792 contracts in the data reported through Tuesday. This was a weekly boost of 6,563 contracts from the previous week which had a total of 7,229 net contracts.

This week’s current strength score (the trader positioning range over the past three years, measured from 0 to 100) shows the speculators are currently Bearish with a score of 22.3 percent. The commercials are Bullish-Extreme with a score of 81.5 percent and the small traders (not shown in chart) are Bearish with a score of 37.8 percent.

Platinum Futures StatisticsSPECULATORSCOMMERCIALSSMALL TRADERS
– Percent of Open Interest Longs:51.431.114.9
– Percent of Open Interest Shorts:25.567.14.8
– Net Position:13,792-19,2275,435
– Gross Longs:27,42916,6187,973
– Gross Shorts:13,63735,8452,538
– Long to Short Ratio:2.0 to 10.5 to 13.1 to 1
NET POSITION TREND:
– Strength Index Score (3 Year Range Pct):22.381.537.8
– Strength Index Reading (3 Year Range):BearishBullish-ExtremeBearish
NET POSITION MOVEMENT INDEX:
– 6-Week Change in Strength Index:14.5-13.7-6.9


Palladium Futures:

Palladium Futures COT ChartThe Palladium Futures large speculator standing this week totaled a net position of -1,988 contracts in the data reported through Tuesday. This was a weekly rise of 1,321 contracts from the previous week which had a total of -3,309 net contracts.

This week’s current strength score (the trader positioning range over the past three years, measured from 0 to 100) shows the speculators are currently Bearish-Extreme with a score of 9.7 percent. The commercials are Bullish-Extreme with a score of 90.1 percent and the small traders (not shown in chart) are Bearish with a score of 27.8 percent.

Palladium Futures StatisticsSPECULATORSCOMMERCIALSSMALL TRADERS
– Percent of Open Interest Longs:31.452.612.9
– Percent of Open Interest Shorts:53.427.416.1
– Net Position:-1,9882,274-286
– Gross Longs:2,8394,7531,167
– Gross Shorts:4,8272,4791,453
– Long to Short Ratio:0.6 to 11.9 to 10.8 to 1
NET POSITION TREND:
– Strength Index Score (3 Year Range Pct):9.790.127.8
– Strength Index Reading (3 Year Range):Bearish-ExtremeBullish-ExtremeBearish
NET POSITION MOVEMENT INDEX:
– 6-Week Change in Strength Index:9.7-9.93.8


Article By InvestMacroReceive our weekly COT Reports by Email

*COT Report: The COT data, released weekly to the public each Friday, is updated through the most recent Tuesday (data is 3 days old) and shows a quick view of how large speculators or non-commercials (for-profit traders) were positioned in the futures markets.

The CFTC categorizes trader positions according to commercial hedgers (traders who use futures contracts for hedging as part of the business), non-commercials (large traders who speculate to realize trading profits) and nonreportable traders (usually small traders/speculators) as well as their open interest (contracts open in the market at time of reporting).See CFTC criteria here.

COT Energy Speculators push Brent Crude Oil bearish bets to 14-week high

By InvestMacro | COT | Data Tables | COT Leaders | Downloads | COT Newsletter

Here are the latest charts and statistics for the Commitment of Traders (COT) data published by the Commodities Futures Trading Commission (CFTC).

The latest COT data is updated through Tuesday January 25th and shows a quick view of how large traders (for-profit speculators and commercial entities) were positioned in the futures markets.

Highlighting the COT energy data is the recent rise in bearish bets for the Brent Crude Oil (last day) futures bets. The speculative net position in the Brent Crude Oil futures has now seen higher bearish positions for three consecutive weeks. This comes after a streak of improving positions that culminated in speculator bets touching the least bearish level in the previous 167 weeks (on January 4th). The overall speculator standing in Brent oil have been in a continuous bearish position since December of 2013 (due to the unique positioning dynamics of the market) but positioning has been less and less bearish with crude oil prices rising in recent months. However, this recent 3-week streak of rising bearish bets brings the Brent net standing to the most bearish of the last fourteen weeks.

Joining Brent Crude Oil (-5,730 contracts) in falling this week were Natural Gas (-6,488 contracts), WTI Crude Oil (-12,366 contracts) and Gasoline (-1,184 contracts) while Heating Oil (3,173 contracts) and the Bloomberg Commodity Index (2,177 contracts) saw higher bets on the week.


Data Snapshot of Commodity Market Traders | Columns Legend
Jan-25-2022OIOI-IndexSpec-NetSpec-IndexCom-NetCOM-IndexSmalls-NetSmalls-Index
WTI Crude2,095,99435373,41528-420,6466147,23182
Gold572,07839220,15158-249,7464129,59548
Silver151,7791832,14154-47,6845215,54333
Copper205,7713026,48161-32,836376,35562
Palladium9,03411-1,988102,27490-28628
Platinum53,3901013,79222-19,227825,43538
Natural Gas1,141,7967-124,5354197,5416226,99447
Brent224,56159-25,9367323,862292,07437
Heating Oil360,9693818,00069-40,9592822,95978
Soybeans735,96630148,87267-112,79939-36,07312
Corn1,539,12428439,09886-389,47116-49,62714
Coffee274,3274061,64393-64,95093,30711
Sugar875,99512121,28362-142,9724121,68935
Wheat390,2662911,66157-3,52537-8,13663


WTI Crude Oil Futures:

WTI Crude Oil Futures COT ChartThe WTI Crude Oil Futures large speculator standing this week totaled a net position of 373,415 contracts in the data reported through Tuesday. This was a weekly decrease of -12,366 contracts from the previous week which had a total of 385,781 net contracts.

This week’s current strength score (the trader positioning range over the past three years, measured from 0 to 100) shows the speculators are currently Bearish with a score of 28.3 percent. The commercials are Bullish with a score of 60.7 percent and the small traders (not shown in chart) are Bullish-Extreme with a score of 81.6 percent.

WTI Crude Oil Futures StatisticsSPECULATORSCOMMERCIALSSMALL TRADERS
– Percent of Open Interest Longs:23.535.84.7
– Percent of Open Interest Shorts:5.755.82.4
– Net Position:373,415-420,64647,231
– Gross Longs:492,310749,82198,250
– Gross Shorts:118,8951,170,46751,019
– Long to Short Ratio:4.1 to 10.6 to 11.9 to 1
NET POSITION TREND:
– Strength Index Score (3 Year Range Pct):28.360.781.6
– Strength Index Reading (3 Year Range):BearishBullishBullish-Extreme
NET POSITION MOVEMENT INDEX:
– 6-Week Change in Strength Index:8.7-11.312.5


Brent Crude Oil Futures:

Brent Last Day Crude Oil Futures COT ChartThe Brent Crude Oil Futures large speculator standing this week totaled a net position of -25,936 contracts in the data reported through Tuesday. This was a weekly reduction of -5,730 contracts from the previous week which had a total of -20,206 net contracts.

This week’s current strength score (the trader positioning range over the past three years, measured from 0 to 100) shows the speculators are currently Bullish with a score of 73.3 percent. The commercials are Bearish with a score of 29.5 percent and the small traders (not shown in chart) are Bearish with a score of 37.3 percent.

Brent Crude Oil Futures StatisticsSPECULATORSCOMMERCIALSSMALL TRADERS
– Percent of Open Interest Longs:17.844.24.1
– Percent of Open Interest Shorts:29.333.63.2
– Net Position:-25,93623,8622,074
– Gross Longs:39,88899,2249,298
– Gross Shorts:65,82475,3627,224
– Long to Short Ratio:0.6 to 11.3 to 11.3 to 1
NET POSITION TREND:
– Strength Index Score (3 Year Range Pct):73.329.537.3
– Strength Index Reading (3 Year Range):BullishBearishBearish
NET POSITION MOVEMENT INDEX:
– 6-Week Change in Strength Index:-4.26.7-20.4


Natural Gas Futures:

Natural Gas Futures COT ChartThe Natural Gas Futures large speculator standing this week totaled a net position of -124,535 contracts in the data reported through Tuesday. This was a weekly reduction of -6,488 contracts from the previous week which had a total of -118,047 net contracts.

This week’s current strength score (the trader positioning range over the past three years, measured from 0 to 100) shows the speculators are currently Bearish with a score of 41.2 percent. The commercials are Bullish with a score of 61.6 percent and the small traders (not shown in chart) are Bearish with a score of 47.4 percent.

Natural Gas Futures StatisticsSPECULATORSCOMMERCIALSSMALL TRADERS
– Percent of Open Interest Longs:20.542.74.5
– Percent of Open Interest Shorts:31.434.12.2
– Net Position:-124,53597,54126,994
– Gross Longs:233,870487,34251,865
– Gross Shorts:358,405389,80124,871
– Long to Short Ratio:0.7 to 11.3 to 12.1 to 1
NET POSITION TREND:
– Strength Index Score (3 Year Range Pct):41.261.647.4
– Strength Index Reading (3 Year Range):BearishBullishBearish
NET POSITION MOVEMENT INDEX:
– 6-Week Change in Strength Index:1.7-0.5-10.1


Gasoline Blendstock Futures:

RBOB Gasoline Energy Futures COT ChartThe Gasoline Blendstock Futures large speculator standing this week totaled a net position of 59,605 contracts in the data reported through Tuesday. This was a weekly decline of -1,184 contracts from the previous week which had a total of 60,789 net contracts.

This week’s current strength score (the trader positioning range over the past three years, measured from 0 to 100) shows the speculators are currently Bearish with a score of 30.8 percent. The commercials are Bullish with a score of 69.8 percent and the small traders (not shown in chart) are Bullish with a score of 56.9 percent.

Nasdaq Mini Futures StatisticsSPECULATORSCOMMERCIALSSMALL TRADERS
– Percent of Open Interest Longs:29.249.26.1
– Percent of Open Interest Shorts:12.867.64.0
– Net Position:59,605-67,1957,590
– Gross Longs:106,361179,16822,300
– Gross Shorts:46,756246,36314,710
– Long to Short Ratio:2.3 to 10.7 to 11.5 to 1
NET POSITION TREND:
– Strength Index Score (3 Year Range Pct):30.869.856.9
– Strength Index Reading (3 Year Range):BearishBullishBullish
NET POSITION MOVEMENT INDEX:
– 6-Week Change in Strength Index:3.2-5.312.5


#2 Heating Oil NY-Harbor Futures:

NY Harbor Heating Oil Energy Futures COT ChartThe #2 Heating Oil NY-Harbor Futures large speculator standing this week totaled a net position of 18,000 contracts in the data reported through Tuesday. This was a weekly increase of 3,173 contracts from the previous week which had a total of 14,827 net contracts.

This week’s current strength score (the trader positioning range over the past three years, measured from 0 to 100) shows the speculators are currently Bullish with a score of 68.9 percent. The commercials are Bearish with a score of 27.6 percent and the small traders (not shown in chart) are Bullish with a score of 77.9 percent.

Heating Oil Futures StatisticsSPECULATORSCOMMERCIALSSMALL TRADERS
– Percent of Open Interest Longs:16.849.813.9
– Percent of Open Interest Shorts:11.861.27.5
– Net Position:18,000-40,95922,959
– Gross Longs:60,678179,92350,189
– Gross Shorts:42,678220,88227,230
– Long to Short Ratio:1.4 to 10.8 to 11.8 to 1
NET POSITION TREND:
– Strength Index Score (3 Year Range Pct):68.927.677.9
– Strength Index Reading (3 Year Range):BullishBearishBullish
NET POSITION MOVEMENT INDEX:
– 6-Week Change in Strength Index:19.5-21.825.0


Bloomberg Commodity Index Futures:

Bloomberg Commodity Index Futures COT ChartThe Bloomberg Commodity Index Futures large speculator standing this week totaled a net position of -14,100 contracts in the data reported through Tuesday. This was a weekly gain of 2,177 contracts from the previous week which had a total of -16,277 net contracts.

This week’s current strength score (the trader positioning range over the past three years, measured from 0 to 100) shows the speculators are currently Bullish with a score of 53.6 percent. The commercials are Bearish with a score of 45.4 percent and the small traders (not shown in chart) are Bearish with a score of 39.5 percent.

Bloomberg Index Futures StatisticsSPECULATORSCOMMERCIALSSMALL TRADERS
– Percent of Open Interest Longs:65.328.61.2
– Percent of Open Interest Shorts:93.91.20.1
– Net Position:-14,10013,537563
– Gross Longs:32,28814,137596
– Gross Shorts:46,38860033
– Long to Short Ratio:0.7 to 123.6 to 118.1 to 1
NET POSITION TREND:
– Strength Index Score (3 Year Range Pct):53.645.439.5
– Strength Index Reading (3 Year Range):BullishBearishBearish
NET POSITION MOVEMENT INDEX:
– 6-Week Change in Strength Index:-21.121.01.8


Article By InvestMacroReceive our weekly COT Reports by Email

*COT Report: The COT data, released weekly to the public each Friday, is updated through the most recent Tuesday (data is 3 days old) and shows a quick view of how large speculators or non-commercials (for-profit traders) were positioned in the futures markets.

The CFTC categorizes trader positions according to commercial hedgers (traders who use futures contracts for hedging as part of the business), non-commercials (large traders who speculate to realize trading profits) and nonreportable traders (usually small traders/speculators) as well as their open interest (contracts open in the market at time of reporting).See CFTC criteria here.

COT Soft Commodities Speculators sharply raised Corn bullish bets for 1st time in 4 weeks

By InvestMacro | COT | Data Tables | COT Leaders | Downloads | COT Newsletter

Here are the latest charts and statistics for the Commitment of Traders (COT) data published by the Commodities Futures Trading Commission (CFTC).

The latest COT data is updated through Tuesday January 25th and shows a quick view of how large traders (for-profit speculators and commercial entities) were positioned in the futures markets.

Highlighting the COT soft commodities data is the sharp rebound in Corn futures bets. The speculative net position in the Corn futures jumped this week by over +50,000 contracts after falling in the previous three weeks. This marked the largest one-week gain of the past twelve weeks and pushed the net bullish position back over the +400,000 contract level. Corn continues to have an extreme bullish strength score at 86.1 percent (current speculator standing compared to past three years, above 80 is bullish extreme, below 20 is bearish extreme) at the current time.

The soft commodities that saw higher bets this week were Corn (50,960 contracts), Sugar (8,115 contracts), Soybeans (20,857 contracts), Soybean Oil (16,969 contracts), Lean Hogs (9,741 contracts) and Wheat (6,821 contracts). The markets with lower bets were Soybean Meal (-1,875 contracts), Live Cattle (-14,921 contracts), Cotton (-1,339 contracts), Cocoa (406 contracts), Coffee (-2,141 contracts).


Data Snapshot of Commodity Market Traders | Columns Legend
Jan-25-2022OIOI-IndexSpec-NetSpec-IndexCom-NetCOM-IndexSmalls-NetSmalls-Index
WTI Crude2,095,99435373,41528-420,6466147,23182
Gold572,07839220,15158-249,7464129,59548
Silver151,7791832,14154-47,6845215,54333
Copper205,7713026,48161-32,836376,35562
Palladium9,03411-1,988102,27490-28628
Platinum53,3901013,79222-19,227825,43538
Natural Gas1,141,7967-124,5354197,5416226,99447
Brent224,56159-25,9367323,862292,07437
Heating Oil360,9693818,00069-40,9592822,95978
Soybeans735,96630148,87267-112,79939-36,07312
Corn1,539,12428439,09886-389,47116-49,62714
Coffee274,3274061,64393-64,95093,30711
Sugar875,99512121,28362-142,9724121,68935
Wheat390,2662911,66157-3,52537-8,13663


CORN Futures:

CORN Futures COT ChartThe CORN large speculator standing this week totaled a net position of 439,098 contracts in the data reported through Tuesday. This was a weekly lift of 50,960 contracts from the previous week which had a total of 388,138 net contracts.

This week’s current strength score (the trader positioning range over the past three years, measured from 0 to 100) shows the speculators are currently Bullish-Extreme with a score of 86.1 percent. The commercials are Bearish-Extreme with a score of 16.4 percent and the small traders (not shown in chart) are Bearish-Extreme with a score of 14.5 percent.

CORN Futures StatisticsSPECULATORSCOMMERCIALSSMALL TRADERS
– Percent of Open Interest Longs:34.144.29.0
– Percent of Open Interest Shorts:5.669.512.2
– Net Position:439,098-389,471-49,627
– Gross Longs:524,903680,057137,937
– Gross Shorts:85,8051,069,528187,564
– Long to Short Ratio:6.1 to 10.6 to 10.7 to 1
NET POSITION TREND:
– Strength Index Score (3 Year Range Pct):86.116.414.5
– Strength Index Reading (3 Year Range):Bullish-ExtremeBearish-ExtremeBearish-Extreme
NET POSITION MOVEMENT INDEX:
– 6-Week Change in Strength Index:1.6-1.1-2.8


SUGAR Futures:

SUGAR Futures COT ChartThe SUGAR large speculator standing this week totaled a net position of 121,283 contracts in the data reported through Tuesday. This was a weekly lift of 8,115 contracts from the previous week which had a total of 113,168 net contracts.

This week’s current strength score (the trader positioning range over the past three years, measured from 0 to 100) shows the speculators are currently Bullish with a score of 61.5 percent. The commercials are Bearish with a score of 41.0 percent and the small traders (not shown in chart) are Bearish with a score of 34.7 percent.

SUGAR Futures StatisticsSPECULATORSCOMMERCIALSSMALL TRADERS
– Percent of Open Interest Longs:21.454.88.7
– Percent of Open Interest Shorts:7.671.16.2
– Net Position:121,283-142,97221,689
– Gross Longs:187,445479,92376,345
– Gross Shorts:66,162622,89554,656
– Long to Short Ratio:2.8 to 10.8 to 11.4 to 1
NET POSITION TREND:
– Strength Index Score (3 Year Range Pct):61.541.034.7
– Strength Index Reading (3 Year Range):BullishBearishBearish
NET POSITION MOVEMENT INDEX:
– 6-Week Change in Strength Index:-19.620.6-17.0


COFFEE Futures:

COFFEE Futures COT ChartThe COFFEE large speculator standing this week totaled a net position of 61,643 contracts in the data reported through Tuesday. This was a weekly decrease of -2,141 contracts from the previous week which had a total of 63,784 net contracts.

This week’s current strength score (the trader positioning range over the past three years, measured from 0 to 100) shows the speculators are currently Bullish-Extreme with a score of 93.4 percent. The commercials are Bearish-Extreme with a score of 8.9 percent and the small traders (not shown in chart) are Bearish-Extreme with a score of 11.2 percent.

COFFEE Futures StatisticsSPECULATORSCOMMERCIALSSMALL TRADERS
– Percent of Open Interest Longs:27.642.53.8
– Percent of Open Interest Shorts:5.166.12.6
– Net Position:61,643-64,9503,307
– Gross Longs:75,714116,48710,526
– Gross Shorts:14,071181,4377,219
– Long to Short Ratio:5.4 to 10.6 to 11.5 to 1
NET POSITION TREND:
– Strength Index Score (3 Year Range Pct):93.48.911.2
– Strength Index Reading (3 Year Range):Bullish-ExtremeBearish-ExtremeBearish-Extreme
NET POSITION MOVEMENT INDEX:
– 6-Week Change in Strength Index:1.0-1.43.1


SOYBEANS Futures:

SOYBEANS Futures COT ChartThe SOYBEANS large speculator standing this week totaled a net position of 148,872 contracts in the data reported through Tuesday. This was a weekly gain of 20,857 contracts from the previous week which had a total of 128,015 net contracts.

This week’s current strength score (the trader positioning range over the past three years, measured from 0 to 100) shows the speculators are currently Bullish with a score of 67.1 percent. The commercials are Bearish with a score of 39.3 percent and the small traders (not shown in chart) are Bearish-Extreme with a score of 11.8 percent.

SOYBEANS Futures StatisticsSPECULATORSCOMMERCIALSSMALL TRADERS
– Percent of Open Interest Longs:26.849.96.8
– Percent of Open Interest Shorts:6.665.211.7
– Net Position:148,872-112,799-36,073
– Gross Longs:197,316367,15649,857
– Gross Shorts:48,444479,95585,930
– Long to Short Ratio:4.1 to 10.8 to 10.6 to 1
NET POSITION TREND:
– Strength Index Score (3 Year Range Pct):67.139.311.8
– Strength Index Reading (3 Year Range):BullishBearishBearish-Extreme
NET POSITION MOVEMENT INDEX:
– 6-Week Change in Strength Index:21.1-20.1-0.0


SOYBEAN OIL Futures:

SOYBEAN OIL Futures COT ChartThe SOYBEAN OIL large speculator standing this week totaled a net position of 68,472 contracts in the data reported through Tuesday. This was a weekly rise of 16,969 contracts from the previous week which had a total of 51,503 net contracts.

This week’s current strength score (the trader positioning range over the past three years, measured from 0 to 100) shows the speculators are currently Bullish with a score of 60.8 percent. The commercials are Bearish with a score of 40.6 percent and the small traders (not shown in chart) are Bullish with a score of 50.3 percent.

SOYBEAN OIL Futures StatisticsSPECULATORSCOMMERCIALSSMALL TRADERS
– Percent of Open Interest Longs:25.247.28.6
– Percent of Open Interest Shorts:8.666.36.1
– Net Position:68,472-78,3589,886
– Gross Longs:103,832194,57235,212
– Gross Shorts:35,360272,93025,326
– Long to Short Ratio:2.9 to 10.7 to 11.4 to 1
NET POSITION TREND:
– Strength Index Score (3 Year Range Pct):60.840.650.3
– Strength Index Reading (3 Year Range):BullishBearishBullish
NET POSITION MOVEMENT INDEX:
– 6-Week Change in Strength Index:13.7-17.032.5


SOYBEAN MEAL Futures:

SOYBEAN MEAL Futures COT ChartThe SOYBEAN MEAL large speculator standing this week totaled a net position of 79,018 contracts in the data reported through Tuesday. This was a weekly decline of -1,875 contracts from the previous week which had a total of 80,893 net contracts.

This week’s current strength score (the trader positioning range over the past three years, measured from 0 to 100) shows the speculators are currently Bullish with a score of 75.1 percent. The commercials are Bearish with a score of 22.9 percent and the small traders (not shown in chart) are Bullish with a score of 72.4 percent.

SOYBEAN MEAL Futures StatisticsSPECULATORSCOMMERCIALSSMALL TRADERS
– Percent of Open Interest Longs:24.947.611.8
– Percent of Open Interest Shorts:5.473.35.5
– Net Position:79,018-104,41425,396
– Gross Longs:101,074193,26347,848
– Gross Shorts:22,056297,67722,452
– Long to Short Ratio:4.6 to 10.6 to 12.1 to 1
NET POSITION TREND:
– Strength Index Score (3 Year Range Pct):75.122.972.4
– Strength Index Reading (3 Year Range):BullishBearishBullish
NET POSITION MOVEMENT INDEX:
– 6-Week Change in Strength Index:4.4-5.911.9


LIVE CATTLE Futures:

LIVE CATTLE Futures COT ChartThe LIVE CATTLE large speculator standing this week totaled a net position of 48,641 contracts in the data reported through Tuesday. This was a weekly decrease of -14,921 contracts from the previous week which had a total of 63,562 net contracts.

This week’s current strength score (the trader positioning range over the past three years, measured from 0 to 100) shows the speculators are currently Bearish with a score of 21.7 percent. The commercials are Bullish with a score of 72.2 percent and the small traders (not shown in chart) are Bullish with a score of 74.4 percent.

LIVE CATTLE Futures StatisticsSPECULATORSCOMMERCIALSSMALL TRADERS
– Percent of Open Interest Longs:32.839.310.5
– Percent of Open Interest Shorts:18.352.212.1
– Net Position:48,641-43,410-5,231
– Gross Longs:110,040131,82635,302
– Gross Shorts:61,399175,23640,533
– Long to Short Ratio:1.8 to 10.8 to 10.9 to 1
NET POSITION TREND:
– Strength Index Score (3 Year Range Pct):21.772.274.4
– Strength Index Reading (3 Year Range):BearishBullishBullish
NET POSITION MOVEMENT INDEX:
– 6-Week Change in Strength Index:-20.818.420.9


LEAN HOGS Futures:

LEAN HOGS Futures COT ChartThe LEAN HOGS large speculator standing this week totaled a net position of 58,046 contracts in the data reported through Tuesday. This was a weekly increase of 9,741 contracts from the previous week which had a total of 48,305 net contracts.

This week’s current strength score (the trader positioning range over the past three years, measured from 0 to 100) shows the speculators are currently Bullish with a score of 71.1 percent. The commercials are Bearish with a score of 36.2 percent and the small traders (not shown in chart) are Bearish with a score of 23.3 percent.

LEAN HOGS Futures StatisticsSPECULATORSCOMMERCIALSSMALL TRADERS
– Percent of Open Interest Longs:39.034.68.4
– Percent of Open Interest Shorts:15.752.513.7
– Net Position:58,046-44,897-13,149
– Gross Longs:97,37186,39921,041
– Gross Shorts:39,325131,29634,190
– Long to Short Ratio:2.5 to 10.7 to 10.6 to 1
NET POSITION TREND:
– Strength Index Score (3 Year Range Pct):71.136.223.3
– Strength Index Reading (3 Year Range):BullishBearishBearish
NET POSITION MOVEMENT INDEX:
– 6-Week Change in Strength Index:4.0-8.317.1


COTTON Futures:

COTTON Futures COT ChartThe COTTON large speculator standing this week totaled a net position of 93,787 contracts in the data reported through Tuesday. This was a weekly fall of -1,339 contracts from the previous week which had a total of 95,126 net contracts.

This week’s current strength score (the trader positioning range over the past three years, measured from 0 to 100) shows the speculators are currently Bullish-Extreme with a score of 82.4 percent. The commercials are Bearish-Extreme with a score of 16.2 percent and the small traders (not shown in chart) are Bullish-Extreme with a score of 87.5 percent.

COTTON Futures StatisticsSPECULATORSCOMMERCIALSSMALL TRADERS
– Percent of Open Interest Longs:43.033.87.9
– Percent of Open Interest Shorts:5.875.73.2
– Net Position:93,787-105,63211,845
– Gross Longs:108,42385,06019,987
– Gross Shorts:14,636190,6928,142
– Long to Short Ratio:7.4 to 10.4 to 12.5 to 1
NET POSITION TREND:
– Strength Index Score (3 Year Range Pct):82.416.287.5
– Strength Index Reading (3 Year Range):Bullish-ExtremeBearish-ExtremeBullish-Extreme
NET POSITION MOVEMENT INDEX:
– 6-Week Change in Strength Index:3.3-4.212.4


COCOA Futures:

COCOA Futures COT ChartThe COCOA large speculator standing this week totaled a net position of 28,620 contracts in the data reported through Tuesday. This was a weekly rise of 406 contracts from the previous week which had a total of 28,214 net contracts.

This week’s current strength score (the trader positioning range over the past three years, measured from 0 to 100) shows the speculators are currently Bearish with a score of 49.4 percent. The commercials are Bearish with a score of 49.9 percent and the small traders (not shown in chart) are Bullish with a score of 52.2 percent.

COCOA Futures StatisticsSPECULATORSCOMMERCIALSSMALL TRADERS
– Percent of Open Interest Longs:26.445.95.3
– Percent of Open Interest Shorts:15.058.83.7
– Net Position:28,620-32,4673,847
– Gross Longs:66,341115,07513,192
– Gross Shorts:37,721147,5429,345
– Long to Short Ratio:1.8 to 10.8 to 11.4 to 1
NET POSITION TREND:
– Strength Index Score (3 Year Range Pct):49.449.952.2
– Strength Index Reading (3 Year Range):BearishBearishBullish
NET POSITION MOVEMENT INDEX:
– 6-Week Change in Strength Index:27.1-29.031.8


WHEAT Futures:

WHEAT Futures COT ChartThe WHEAT large speculator standing this week totaled a net position of 11,661 contracts in the data reported through Tuesday. This was a weekly boost of 6,821 contracts from the previous week which had a total of 4,840 net contracts.

This week’s current strength score (the trader positioning range over the past three years, measured from 0 to 100) shows the speculators are currently Bullish with a score of 56.9 percent. The commercials are Bearish with a score of 37.4 percent and the small traders (not shown in chart) are Bullish with a score of 62.7 percent.

WHEAT Futures StatisticsSPECULATORSCOMMERCIALSSMALL TRADERS
– Percent of Open Interest Longs:28.139.18.4
– Percent of Open Interest Shorts:25.140.010.5
– Net Position:11,661-3,525-8,136
– Gross Longs:109,676152,60332,799
– Gross Shorts:98,015156,12840,935
– Long to Short Ratio:1.1 to 11.0 to 10.8 to 1
NET POSITION TREND:
– Strength Index Score (3 Year Range Pct):56.937.462.7
– Strength Index Reading (3 Year Range):BullishBearishBullish
NET POSITION MOVEMENT INDEX:
– 6-Week Change in Strength Index:-0.31.6-6.3


Article By InvestMacroReceive our weekly COT Reports by Email

*COT Report: The COT data, released weekly to the public each Friday, is updated through the most recent Tuesday (data is 3 days old) and shows a quick view of how large speculators or non-commercials (for-profit traders) were positioned in the futures markets.

The CFTC categorizes trader positions according to commercial hedgers (traders who use futures contracts for hedging as part of the business), non-commercials (large traders who speculate to realize trading profits) and nonreportable traders (usually small traders/speculators) as well as their open interest (contracts open in the market at time of reporting).See CFTC criteria here.

COT Currency Speculator Sentiment rising for Euro & British Pound Sterling

By InvestMacro | COT | Data Tables | COT Leaders | Downloads | COT Newsletter

Here are the latest charts and statistics for the Commitment of Traders (COT) data published by the Commodities Futures Trading Commission (CFTC).

The latest COT data is updated through Tuesday January 18th and shows a quick view of how large traders (for-profit speculators and commercial entities) were positioned in the futures markets. All currency positions are in direct relation to the US dollar where, for example, a bet for the euro is a bet that the euro will rise versus the dollar while a bet against the euro will be a bet that the euro will decline versus the dollar.

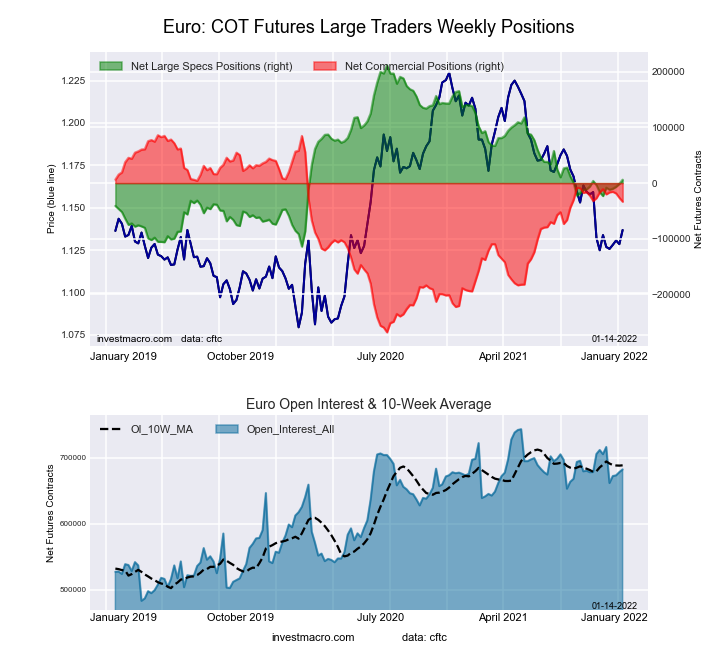
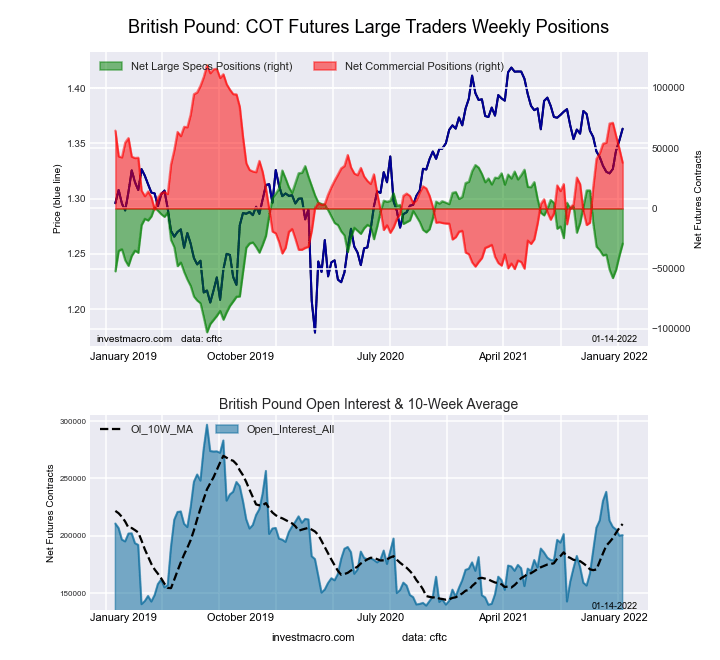
Highlighting the COT currency data is the trend changes in speculator sentiment we are seeing in the Euro and the British pound sterling. Speculators have been boosting their bets for the Euro and pound sterling over the past weeks and have now pushed their bets in both currencies to their best levels since September.

Euro positions have gained for five consecutive weeks (a 5-week total rise of +36,463 contracts) and have now been in bullish territory for two straight weeks after spending thirteen out of the past fourteen weeks in bearish territory. This week’s net position of +24,584 contracts marks the best position since September 14th when positions were in a downtrend and on their way into negative territory.

British pound speculator bets, meanwhile, have risen sharply with four straight weeks of gains (a 4-week rise by +57,439 contracts) and have now settled into a current position of just -247 net contracts. The net position had been at a multi-year bearish high of -57,686 contracts as recently as December 21st before a turnaround in sentiment.

Joining the Euro (18,579 contracts) and British pound sterling (28,919 contracts) with positive changes this week were the yen (6,646 contracts), New Zealand dollar (273 contracts), Canadian dollar (14,868 contracts), Australian dollar (3,032 contracts) and the Mexican peso (9,371 contracts).

The currencies with declining bets were the US Dollar Index (-1,458 contracts), Brazil real (-557 contracts), Swiss franc (-3,150 contracts), Russian ruble (-3,195 contracts) and Bitcoin (-172 contracts)


Data Snapshot of Forex Market Traders | Columns Legend
Jan-18-2022OIOI-IndexSpec-NetSpec-IndexCom-NetCOM-IndexSmalls-NetSmalls-Index
USD Index53,2837436,43489-42,39745,96382
EUR691,8828024,58443-50,4646125,88017
GBP183,23428-247742,84831-2,60150
JPY201,82056-80,8791799,74086-18,8619
CHF39,87114-10,8105113,79946-2,98954
CAD143,371267,49258-13,723476,23142
AUD181,13668-88,454398,51992-10,06528
NZD44,72733-8,3315710,62247-2,29126
MXN151,778274,92029-7,490702,57054
RUB45,413466,42229-7,2516982957
BRL32,09830-11,3695310,7594861074
Bitcoin11,46862-54991-22057126


US Dollar Index Futures:

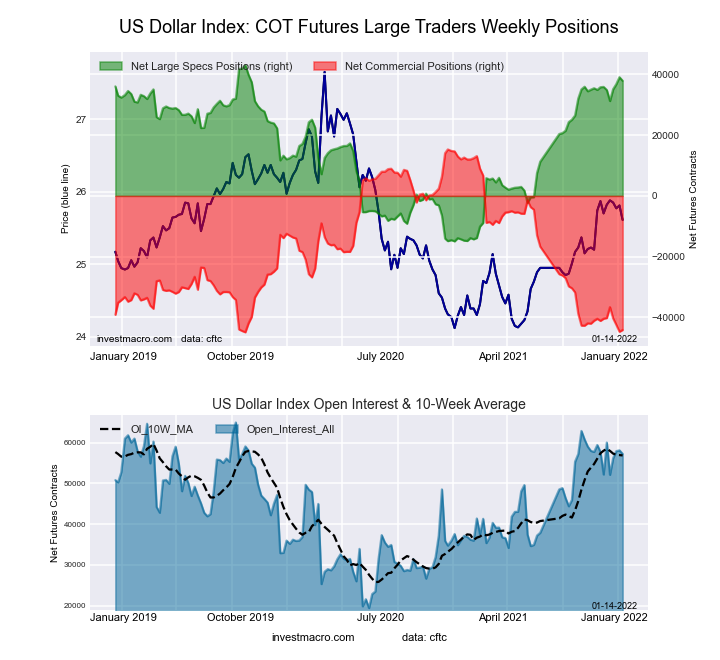
US Dollar Index Forex Futures COT ChartThe US Dollar Index large speculator standing this week was a net position of 36,434 contracts in the data reported through Tuesday. This was a weekly lowering of -1,458 contracts from the previous week which had a total of 37,892 net contracts.

This week’s current strength score (the trader positioning range over the past three years, measured from 0 to 100) shows the speculators are currently Bullish-Extreme with a score of 88.6 percent. The commercials are Bearish-Extreme with a score of 4.1 percent and the small traders (not shown in chart) are Bullish-Extreme with a score of 81.8 percent.

US DOLLAR INDEX StatisticsSPECULATORSCOMMERCIALSSMALL TRADERS
– Percent of Open Interest Longs:79.53.215.4
– Percent of Open Interest Shorts:11.182.74.2
– Net Position:36,434-42,3975,963
– Gross Longs:42,3691,6848,180
– Gross Shorts:5,93544,0812,217
– Long to Short Ratio:7.1 to 10.0 to 13.7 to 1
NET POSITION TREND:
– Strength Index Score (3 Year Range Pct):88.64.181.8
– Strength Index Reading (3 Year Range):Bullish-ExtremeBearish-ExtremeBullish-Extreme
NET POSITION MOVEMENT INDEX:
– 6-Week Change in Strength Index:2.7-3.66.8


Euro Currency Futures:

Euro Currency Futures COT ChartThe Euro Currency large speculator standing this week was a net position of 24,584 contracts in the data reported through Tuesday. This was a weekly gain of 18,579 contracts from the previous week which had a total of 6,005 net contracts.

This week’s current strength score (the trader positioning range over the past three years, measured from 0 to 100) shows the speculators are currently Bearish with a score of 42.5 percent. The commercials are Bullish with a score of 61.5 percent and the small traders (not shown in chart) are Bearish-Extreme with a score of 17.3 percent.

EURO Currency StatisticsSPECULATORSCOMMERCIALSSMALL TRADERS
– Percent of Open Interest Longs:30.656.311.5
– Percent of Open Interest Shorts:27.163.67.8
– Net Position:24,584-50,46425,880
– Gross Longs:211,901389,61779,656
– Gross Shorts:187,317440,08153,776
– Long to Short Ratio:1.1 to 10.9 to 11.5 to 1
NET POSITION TREND:
– Strength Index Score (3 Year Range Pct):42.561.517.3
– Strength Index Reading (3 Year Range):BearishBullishBearish-Extreme
NET POSITION MOVEMENT INDEX:
– 6-Week Change in Strength Index:10.1-8.6-4.3


British Pound Sterling Futures:

British Pound Sterling Futures COT ChartThe British Pound Sterling large speculator standing this week was a net position of -247 contracts in the data reported through Tuesday. This was a weekly gain of 28,919 contracts from the previous week which had a total of -29,166 net contracts.

This week’s current strength score (the trader positioning range over the past three years, measured from 0 to 100) shows the speculators are currently Bullish with a score of 73.8 percent. The commercials are Bearish with a score of 31.4 percent and the small traders (not shown in chart) are Bullish with a score of 50.3 percent.

BRITISH POUND StatisticsSPECULATORSCOMMERCIALSSMALL TRADERS
– Percent of Open Interest Longs:21.762.514.3
– Percent of Open Interest Shorts:21.860.915.8
– Net Position:-2472,848-2,601
– Gross Longs:39,760114,48626,267
– Gross Shorts:40,007111,63828,868
– Long to Short Ratio:1.0 to 11.0 to 10.9 to 1
NET POSITION TREND:
– Strength Index Score (3 Year Range Pct):73.831.450.3
– Strength Index Reading (3 Year Range):BullishBearishBullish
NET POSITION MOVEMENT INDEX:
– 6-Week Change in Strength Index:27.4-30.628.5


Japanese Yen Futures:

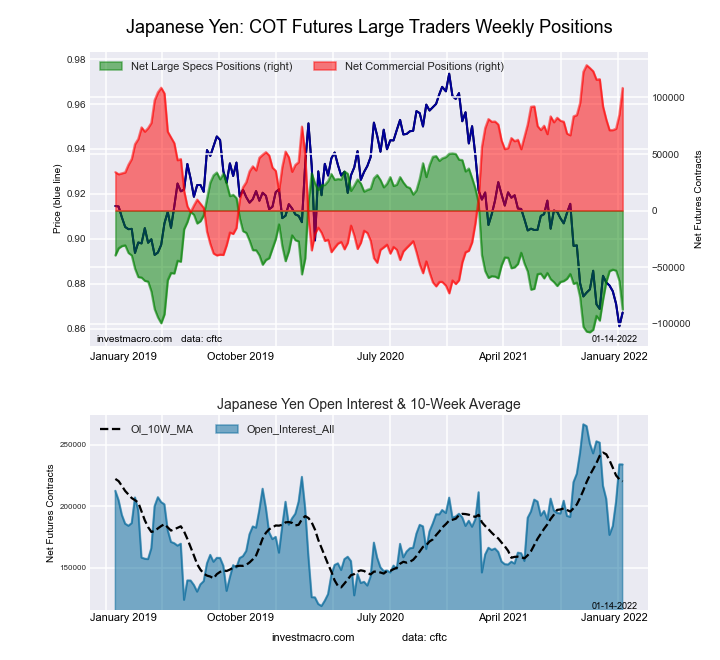
Japanese Yen Forex Futures COT ChartThe Japanese Yen large speculator standing this week was a net position of -80,879 contracts in the data reported through Tuesday. This was a weekly boost of 6,646 contracts from the previous week which had a total of -87,525 net contracts.

This week’s current strength score (the trader positioning range over the past three years, measured from 0 to 100) shows the speculators are currently Bearish-Extreme with a score of 16.9 percent. The commercials are Bullish-Extreme with a score of 85.7 percent and the small traders (not shown in chart) are Bearish-Extreme with a score of 9.0 percent.

JAPANESE YEN StatisticsSPECULATORSCOMMERCIALSSMALL TRADERS
– Percent of Open Interest Longs:4.086.18.7
– Percent of Open Interest Shorts:44.036.618.0
– Net Position:-80,87999,740-18,861
– Gross Longs:8,002173,70117,475
– Gross Shorts:88,88173,96136,336
– Long to Short Ratio:0.1 to 12.3 to 10.5 to 1
NET POSITION TREND:
– Strength Index Score (3 Year Range Pct):16.985.79.0
– Strength Index Reading (3 Year Range):Bearish-ExtremeBullish-ExtremeBearish-Extreme
NET POSITION MOVEMENT INDEX:
– 6-Week Change in Strength Index:-11.39.5-3.1


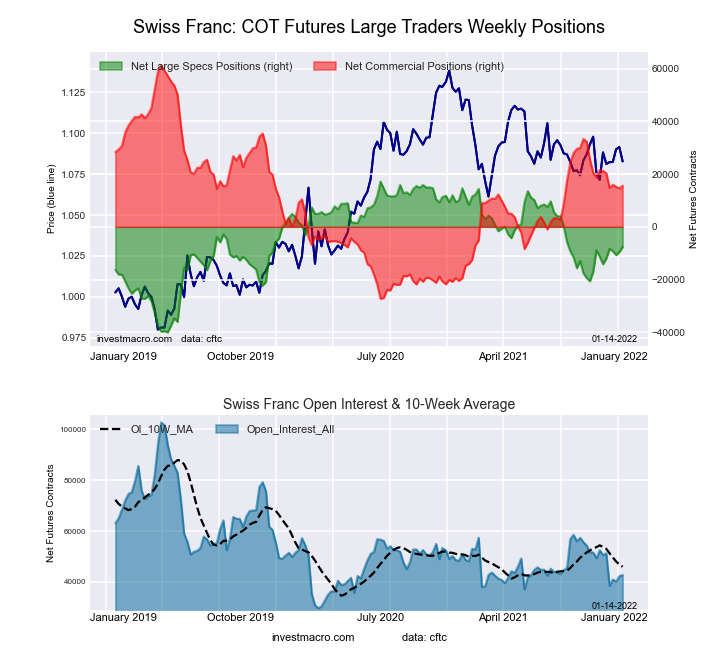
Swiss Franc Futures:

Swiss Franc Forex Futures COT ChartThe Swiss Franc large speculator standing this week was a net position of -10,810 contracts in the data reported through Tuesday. This was a weekly reduction of -3,150 contracts from the previous week which had a total of -7,660 net contracts.

This week’s current strength score (the trader positioning range over the past three years, measured from 0 to 100) shows the speculators are currently Bullish with a score of 51.1 percent. The commercials are Bearish with a score of 46.4 percent and the small traders (not shown in chart) are Bullish with a score of 54.5 percent.

SWISS FRANC StatisticsSPECULATORSCOMMERCIALSSMALL TRADERS
– Percent of Open Interest Longs:2.367.330.0
– Percent of Open Interest Shorts:29.432.737.5
– Net Position:-10,81013,799-2,989
– Gross Longs:92526,82811,951
– Gross Shorts:11,73513,02914,940
– Long to Short Ratio:0.1 to 12.1 to 10.8 to 1
NET POSITION TREND:
– Strength Index Score (3 Year Range Pct):51.146.454.5
– Strength Index Reading (3 Year Range):BullishBearishBullish
NET POSITION MOVEMENT INDEX:
– 6-Week Change in Strength Index:2.2-7.415.5


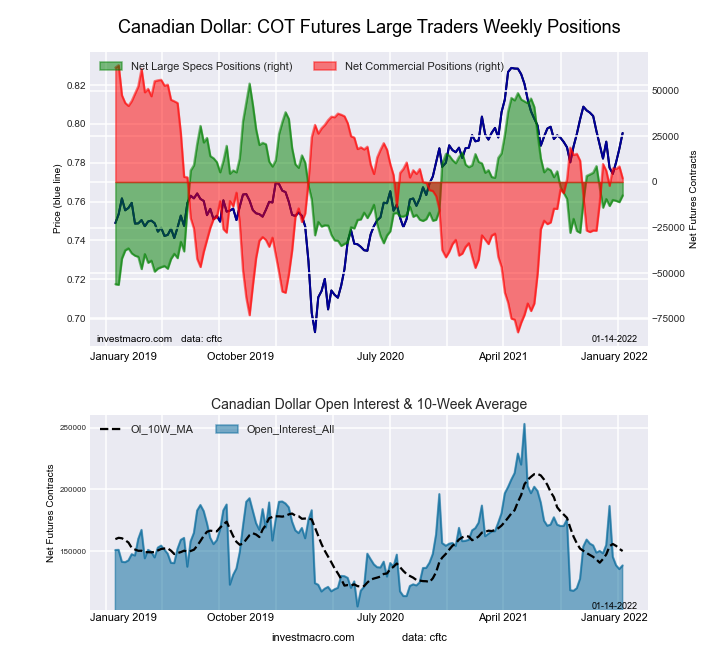
Canadian Dollar Futures:

Canadian Dollar Forex Futures COT ChartThe Canadian Dollar large speculator standing this week was a net position of 7,492 contracts in the data reported through Tuesday. This was a weekly advance of 14,868 contracts from the previous week which had a total of -7,376 net contracts.

This week’s current strength score (the trader positioning range over the past three years, measured from 0 to 100) shows the speculators are currently Bullish with a score of 57.9 percent. The commercials are Bearish with a score of 46.9 percent and the small traders (not shown in chart) are Bearish with a score of 42.2 percent.

CANADIAN DOLLAR StatisticsSPECULATORSCOMMERCIALSSMALL TRADERS
– Percent of Open Interest Longs:34.741.121.8
– Percent of Open Interest Shorts:29.550.717.5
– Net Position:7,492-13,7236,231
– Gross Longs:49,79258,92131,270
– Gross Shorts:42,30072,64425,039
– Long to Short Ratio:1.2 to 10.8 to 11.2 to 1
NET POSITION TREND:
– Strength Index Score (3 Year Range Pct):57.946.942.2
– Strength Index Reading (3 Year Range):BullishBearishBearish
NET POSITION MOVEMENT INDEX:
– 6-Week Change in Strength Index:15.3-13.56.0


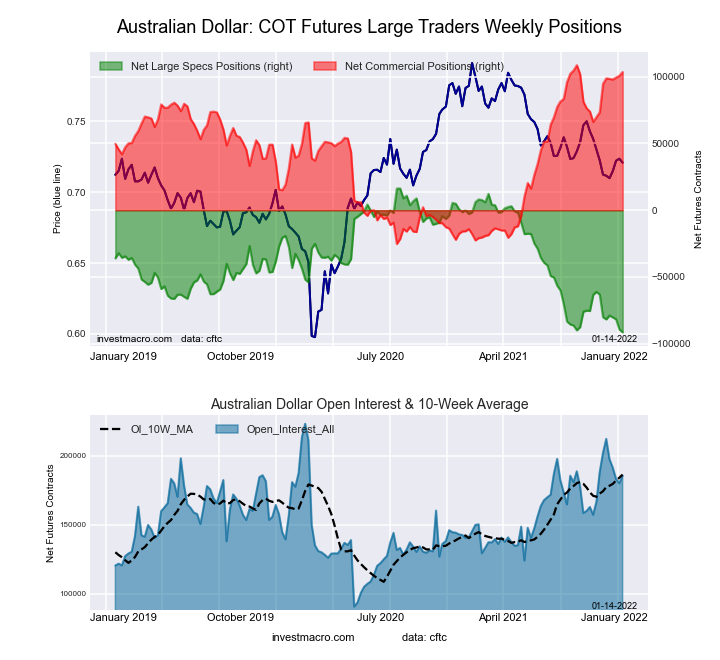
Australian Dollar Futures:

Australian Dollar Forex Futures COT ChartThe Australian Dollar large speculator standing this week was a net position of -88,454 contracts in the data reported through Tuesday. This was a weekly increase of 3,032 contracts from the previous week which had a total of -91,486 net contracts.

This week’s current strength score (the trader positioning range over the past three years, measured from 0 to 100) shows the speculators are currently Bearish-Extreme with a score of 2.8 percent. The commercials are Bullish-Extreme with a score of 92.4 percent and the small traders (not shown in chart) are Bearish with a score of 27.9 percent.

AUSTRALIAN DOLLAR StatisticsSPECULATORSCOMMERCIALSSMALL TRADERS
– Percent of Open Interest Longs:5.082.210.5
– Percent of Open Interest Shorts:53.827.916.1
– Net Position:-88,45498,519-10,065
– Gross Longs:9,051148,97819,008
– Gross Shorts:97,50550,45929,073
– Long to Short Ratio:0.1 to 13.0 to 10.7 to 1
NET POSITION TREND:
– Strength Index Score (3 Year Range Pct):2.892.427.9
– Strength Index Reading (3 Year Range):Bearish-ExtremeBullish-ExtremeBearish
NET POSITION MOVEMENT INDEX:
– 6-Week Change in Strength Index:-6.2-0.317.1


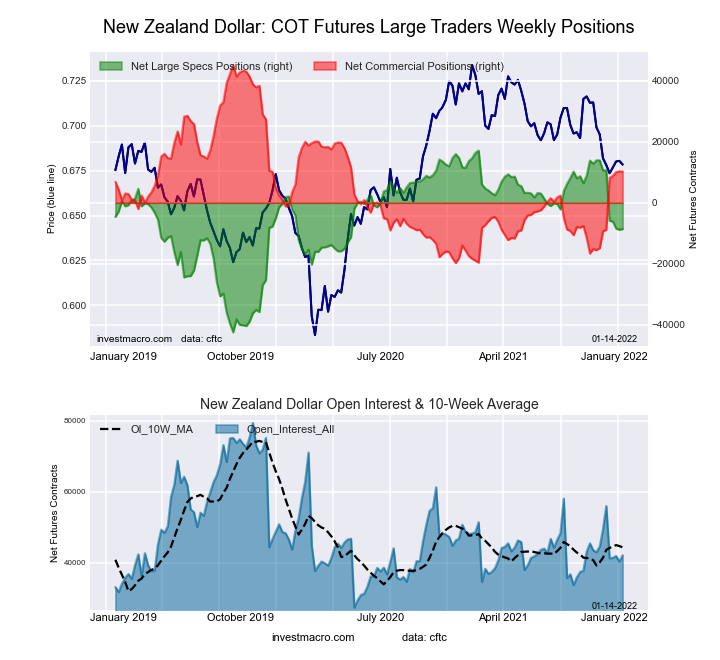
New Zealand Dollar Futures:

New Zealand Dollar Forex Futures COT ChartThe New Zealand Dollar large speculator standing this week was a net position of -8,331 contracts in the data reported through Tuesday. This was a weekly advance of 273 contracts from the previous week which had a total of -8,604 net contracts.

This week’s current strength score (the trader positioning range over the past three years, measured from 0 to 100) shows the speculators are currently Bullish with a score of 57.3 percent. The commercials are Bearish with a score of 46.8 percent and the small traders (not shown in chart) are Bearish with a score of 25.6 percent.

NEW ZEALAND DOLLAR StatisticsSPECULATORSCOMMERCIALSSMALL TRADERS
– Percent of Open Interest Longs:26.066.86.4
– Percent of Open Interest Shorts:44.643.011.5
– Net Position:-8,33110,622-2,291
– Gross Longs:11,61229,8762,851
– Gross Shorts:19,94319,2545,142
– Long to Short Ratio:0.6 to 11.6 to 10.6 to 1
NET POSITION TREND:
– Strength Index Score (3 Year Range Pct):57.346.825.6
– Strength Index Reading (3 Year Range):BullishBearishBearish
NET POSITION MOVEMENT INDEX:
– 6-Week Change in Strength Index:-31.930.0-5.2


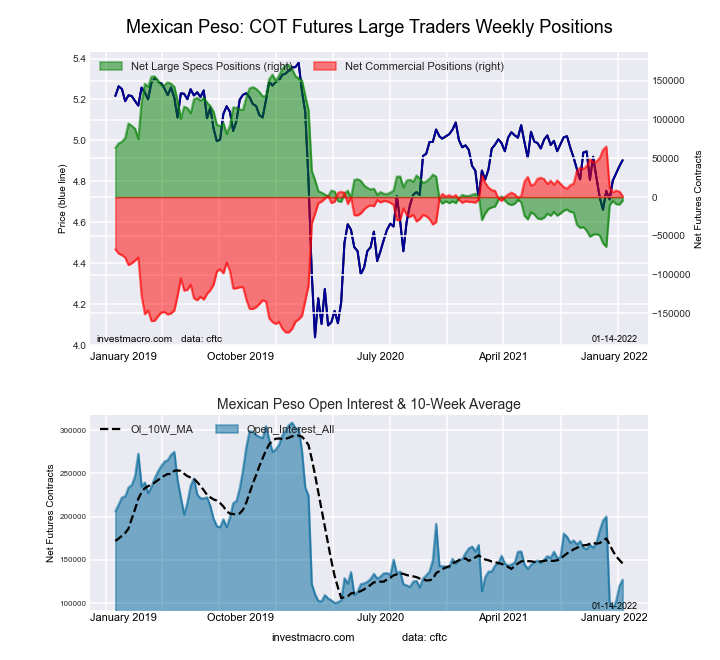
Mexican Peso Futures:

Mexican Peso Futures COT ChartThe Mexican Peso large speculator standing this week was a net position of 4,920 contracts in the data reported through Tuesday. This was a weekly increase of 9,371 contracts from the previous week which had a total of -4,451 net contracts.

This week’s current strength score (the trader positioning range over the past three years, measured from 0 to 100) shows the speculators are currently Bearish with a score of 29.4 percent. The commercials are Bullish with a score of 69.7 percent and the small traders (not shown in chart) are Bullish with a score of 53.9 percent.

MEXICAN PESO StatisticsSPECULATORSCOMMERCIALSSMALL TRADERS
– Percent of Open Interest Longs:49.746.13.9
– Percent of Open Interest Shorts:46.551.02.2
– Net Position:4,920-7,4902,570
– Gross Longs:75,46169,9425,901
– Gross Shorts:70,54177,4323,331
– Long to Short Ratio:1.1 to 10.9 to 11.8 to 1
NET POSITION TREND:
– Strength Index Score (3 Year Range Pct):29.469.753.9
– Strength Index Reading (3 Year Range):BearishBullishBullish
NET POSITION MOVEMENT INDEX:
– 6-Week Change in Strength Index:29.4-30.315.6


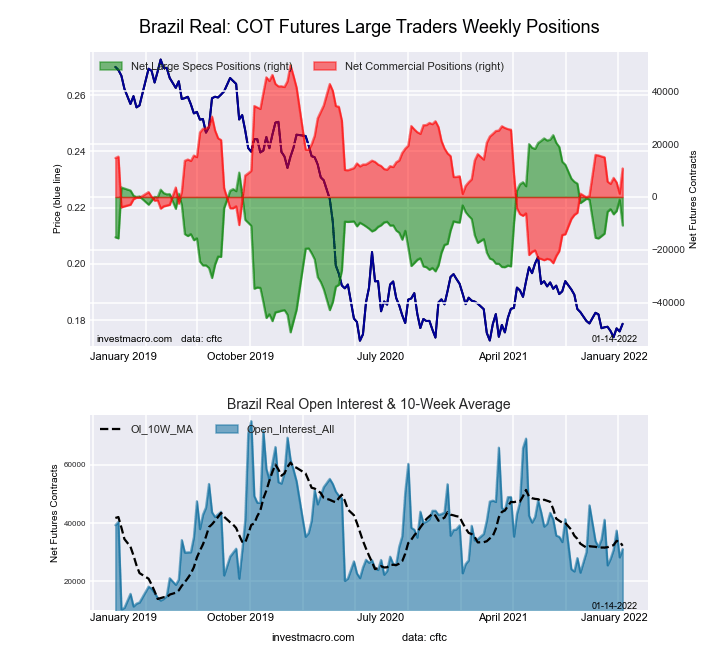
Brazilian Real Futures:

Brazil Real Futures COT ChartThe Brazilian Real large speculator standing this week was a net position of -11,369 contracts in the data reported through Tuesday. This was a weekly fall of -557 contracts from the previous week which had a total of -10,812 net contracts.

This week’s current strength score (the trader positioning range over the past three years, measured from 0 to 100) shows the speculators are currently Bullish with a score of 53.4 percent. The commercials are Bearish with a score of 47.8 percent and the small traders (not shown in chart) are Bullish with a score of 74.2 percent.

BRAZIL REAL StatisticsSPECULATORSCOMMERCIALSSMALL TRADERS
– Percent of Open Interest Longs:34.156.68.9
– Percent of Open Interest Shorts:69.623.17.0
– Net Position:-11,36910,759610
– Gross Longs:10,95818,1792,841
– Gross Shorts:22,3277,4202,231
– Long to Short Ratio:0.5 to 12.5 to 11.3 to 1
NET POSITION TREND:
– Strength Index Score (3 Year Range Pct):53.447.874.2
– Strength Index Reading (3 Year Range):BullishBearishBullish
NET POSITION MOVEMENT INDEX:
– 6-Week Change in Strength Index:-7.76.69.9


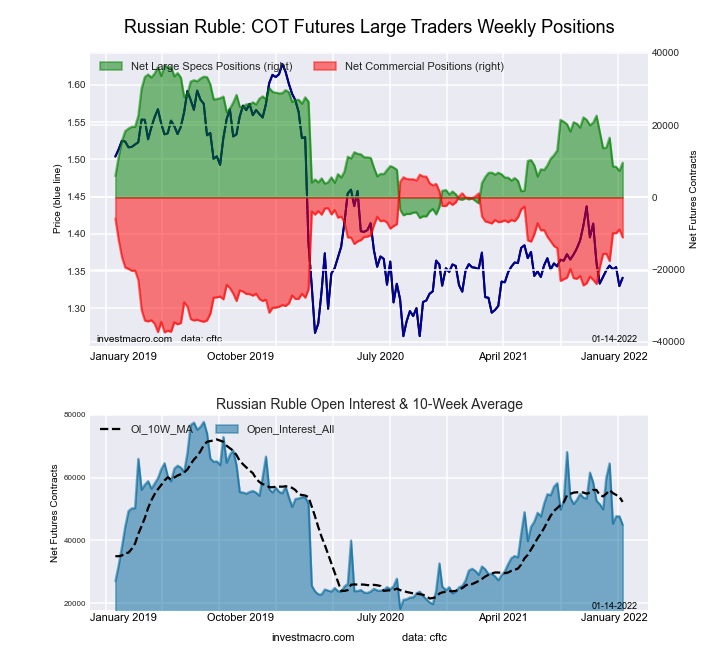
Russian Ruble Futures:

Russian Ruble Futures COT ChartThe Russian Ruble large speculator standing this week was a net position of 6,422 contracts in the data reported through Tuesday. This was a weekly decrease of -3,195 contracts from the previous week which had a total of 9,617 net contracts.

This week’s current strength score (the trader positioning range over the past three years, measured from 0 to 100) shows the speculators are currently Bearish with a score of 28.6 percent. The commercials are Bullish with a score of 68.9 percent and the small traders (not shown in chart) are Bullish with a score of 57.1 percent.

RUSSIAN RUBLE StatisticsSPECULATORSCOMMERCIALSSMALL TRADERS
– Percent of Open Interest Longs:35.360.04.6
– Percent of Open Interest Shorts:21.275.92.8
– Net Position:6,422-7,251829
– Gross Longs:16,03427,2332,101
– Gross Shorts:9,61234,4841,272
– Long to Short Ratio:1.7 to 10.8 to 11.7 to 1
NET POSITION TREND:
– Strength Index Score (3 Year Range Pct):28.668.957.1
– Strength Index Reading (3 Year Range):BearishBullishBullish
NET POSITION MOVEMENT INDEX:
– 6-Week Change in Strength Index:-17.519.1-25.4


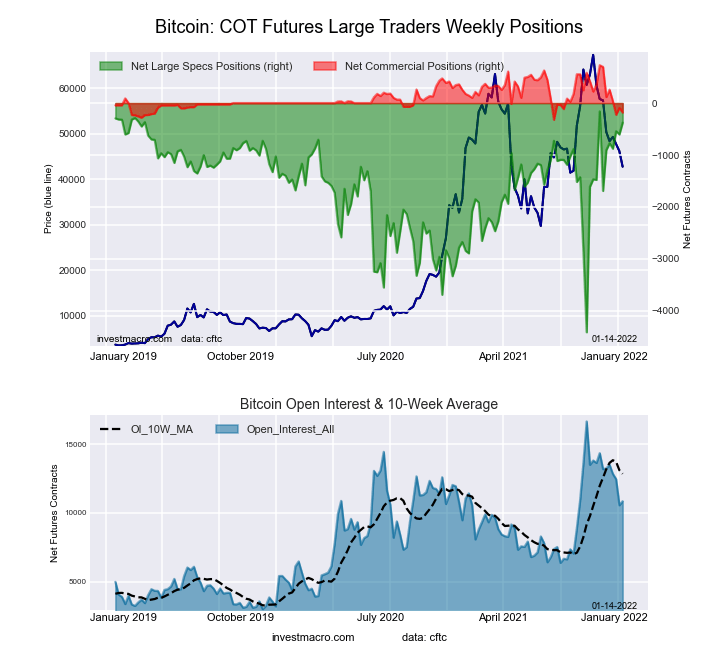
Bitcoin Futures:

Bitcoin Crypto Futures COT ChartThe Bitcoin large speculator standing this week was a net position of -549 contracts in the data reported through Tuesday. This was a weekly decline of -172 contracts from the previous week which had a total of -377 net contracts.

This week’s current strength score (the trader positioning range over the past three years, measured from 0 to 100) shows the speculators are currently Bullish-Extreme with a score of 90.9 percent. The commercials are Bearish with a score of 28.5 percent and the small traders (not shown in chart) are Bearish with a score of 25.9 percent.

BITCOIN StatisticsSPECULATORSCOMMERCIALSSMALL TRADERS
– Percent of Open Interest Longs:73.43.112.3
– Percent of Open Interest Shorts:78.23.37.3
– Net Position:-549-22571
– Gross Longs:8,4173551,407
– Gross Shorts:8,966377836
– Long to Short Ratio:0.9 to 10.9 to 11.7 to 1
NET POSITION TREND:
– Strength Index Score (3 Year Range Pct):90.928.525.9
– Strength Index Reading (3 Year Range):Bullish-ExtremeBearishBearish
NET POSITION MOVEMENT INDEX:
– 6-Week Change in Strength Index:8.4-13.2-5.0


Article By InvestMacroReceive our weekly COT Reports by Email

*COT Report: The COT data, released weekly to the public each Friday, is updated through the most recent Tuesday (data is 3 days old) and shows a quick view of how large speculators or non-commercials (for-profit traders) were positioned in the futures markets.

The CFTC categorizes trader positions according to commercial hedgers (traders who use futures contracts for hedging as part of the business), non-commercials (large traders who speculate to realize trading profits) and nonreportable traders (usually small traders/speculators) as well as their open interest (contracts open in the market at time of reporting).See CFTC criteria here.

COT Bonds Speculators sharply reduce 5-Year Treasury bearish bets for 2nd week

By InvestMacro | COT | Data Tables | COT Leaders | Downloads | COT Newsletter

Here are the latest charts and statistics for the Commitment of Traders (COT) data published by the Commodities Futures Trading Commission (CFTC).

The latest COT data is updated through Tuesday January 18th and shows a quick view of how large traders (for-profit speculators and commercial entities) were positioned in the futures markets.

Highlighting the COT bonds data is the retreat in the 5-Year Bond bearish bets over the past couple of weeks. Speculators have reduced their bearish bets for the 5-Year Bond sharply for two straight weeks and by a total of 185,701 contracts over that two-week time-frame. This has brought the total net speculator standing from -402,875 contracts on January 4th to -217,174 contracts on January 18th. The drop in bearish bets brings the overall speculator standing to the least bearish level since September 21st when positions totaled -147,423 contracts. Speculative positions have been trending more and more bearish since early September as sentiment for bonds in general has eroded.

Joining the 5-Year (82,483 contracts) in gaining this week were the 10-Year (72,397 contracts), Long US Bond (17,542 contracts) and the FedFunds (55,280 contracts) while decreasing bets for the week were seen in Eurodollar (-46,964 contracts), 2-Year Bond (-13,181 contracts), Ultra 10-Year (-18,214 contracts) and the Ultra US Bond (-28,819 contracts).


Data Snapshot of Bond Market Traders | Columns Legend
Jan-18-2022OIOI-IndexSpec-NetSpec-IndexCom-NetCOM-IndexSmalls-NetSmalls-Index
Eurodollar11,026,17345-1,827,29302,222,703100-395,41020
FedFunds1,708,63552-12,2743834,66064-22,3866
2-Year2,107,8491338,6369026,78826-65,4243
Long T-Bond1,219,35652-47,4967660,03739-12,54143
10-Year3,890,03757-271,44230538,66489-267,22216
5-Year3,826,11538-217,17443479,18876-262,0149


3-Month Eurodollars Futures:

Eurodollar Bonds Futures COT ChartThe 3-Month Eurodollars large speculator standing this week resulted in a net position of -1,827,293 contracts in the data reported through Tuesday. This was a weekly decline of -46,964 contracts from the previous week which had a total of -1,780,329 net contracts.

This week’s current strength score (the trader positioning range over the past three years, measured from 0 to 100) shows the speculators are currently Bearish-Extreme with a score of 0.0 percent. The commercials are Bullish-Extreme with a score of 100.0 percent and the small traders (not shown in chart) are Bearish-Extreme with a score of 19.8 percent.

3-Month Eurodollars StatisticsSPECULATORSCOMMERCIALSSMALL TRADERS
– Percent of Open Interest Longs:7.072.14.0
– Percent of Open Interest Shorts:23.651.97.6
– Net Position:-1,827,2932,222,703-395,410
– Gross Longs:773,6907,949,491440,653
– Gross Shorts:2,600,9835,726,788836,063
– Long to Short Ratio:0.3 to 11.4 to 10.5 to 1
NET POSITION TREND:
– Strength Index Score (3 Year Range Pct):0.0100.019.8
– Strength Index Reading (3 Year Range):Bearish-ExtremeBullish-ExtremeBearish-Extreme
NET POSITION MOVEMENT INDEX:
– 6-Week Change in Strength Index:-10.48.216.9


30-Day Federal Funds Futures:

Federal Funds 30-Day Bonds Futures COT ChartThe 30-Day Federal Funds large speculator standing this week resulted in a net position of -12,274 contracts in the data reported through Tuesday. This was a weekly boost of 55,280 contracts from the previous week which had a total of -67,554 net contracts.

This week’s current strength score (the trader positioning range over the past three years, measured from 0 to 100) shows the speculators are currently Bearish with a score of 38.1 percent. The commercials are Bullish with a score of 64.1 percent and the small traders (not shown in chart) are Bearish-Extreme with a score of 6.4 percent.

30-Day Federal Funds StatisticsSPECULATORSCOMMERCIALSSMALL TRADERS
– Percent of Open Interest Longs:5.776.11.4
– Percent of Open Interest Shorts:6.474.12.7
– Net Position:-12,27434,660-22,386
– Gross Longs:97,7551,300,61224,099
– Gross Shorts:110,0291,265,95246,485
– Long to Short Ratio:0.9 to 11.0 to 10.5 to 1
NET POSITION TREND:
– Strength Index Score (3 Year Range Pct):38.164.16.4
– Strength Index Reading (3 Year Range):BearishBullishBearish-Extreme
NET POSITION MOVEMENT INDEX:
– 6-Week Change in Strength Index:12.5-10.3-39.1


2-Year Treasury Note Futures:

2-Year Treasury Bonds Futures COT ChartThe 2-Year Treasury Note large speculator standing this week resulted in a net position of 38,636 contracts in the data reported through Tuesday. This was a weekly lowering of -13,181 contracts from the previous week which had a total of 51,817 net contracts.

This week’s current strength score (the trader positioning range over the past three years, measured from 0 to 100) shows the speculators are currently Bullish-Extreme with a score of 90.1 percent. The commercials are Bearish with a score of 25.7 percent and the small traders (not shown in chart) are Bearish-Extreme with a score of 3.3 percent.

2-Year Treasury Note StatisticsSPECULATORSCOMMERCIALSSMALL TRADERS
– Percent of Open Interest Longs:19.171.55.9
– Percent of Open Interest Shorts:17.370.29.0
– Net Position:38,63626,788-65,424
– Gross Longs:402,6021,506,177123,871
– Gross Shorts:363,9661,479,389189,295
– Long to Short Ratio:1.1 to 11.0 to 10.7 to 1
NET POSITION TREND:
– Strength Index Score (3 Year Range Pct):90.125.73.3
– Strength Index Reading (3 Year Range):Bullish-ExtremeBearishBearish-Extreme
NET POSITION MOVEMENT INDEX:
– 6-Week Change in Strength Index:1.21.1-5.7


5-Year Treasury Note Futures:

5-Year Treasury Bonds Futures COT ChartThe 5-Year Treasury Note large speculator standing this week resulted in a net position of -217,174 contracts in the data reported through Tuesday. This was a weekly advance of 82,483 contracts from the previous week which had a total of -299,657 net contracts.

This week’s current strength score (the trader positioning range over the past three years, measured from 0 to 100) shows the speculators are currently Bearish with a score of 43.0 percent. The commercials are Bullish with a score of 76.4 percent and the small traders (not shown in chart) are Bearish-Extreme with a score of 9.1 percent.

5-Year Treasury Note StatisticsSPECULATORSCOMMERCIALSSMALL TRADERS
– Percent of Open Interest Longs:9.281.26.8
– Percent of Open Interest Shorts:14.968.713.6
– Net Position:-217,174479,188-262,014
– Gross Longs:352,4443,107,310258,755
– Gross Shorts:569,6182,628,122520,769
– Long to Short Ratio:0.6 to 11.2 to 10.5 to 1
NET POSITION TREND:
– Strength Index Score (3 Year Range Pct):43.076.49.1
– Strength Index Reading (3 Year Range):BearishBullishBearish-Extreme
NET POSITION MOVEMENT INDEX:
– 6-Week Change in Strength Index:31.1-19.1-6.2


10-Year Treasury Note Futures:

10-Year Treasury Notes Bonds Futures COT ChartThe 10-Year Treasury Note large speculator standing this week resulted in a net position of -271,442 contracts in the data reported through Tuesday. This was a weekly boost of 72,397 contracts from the previous week which had a total of -343,839 net contracts.

This week’s current strength score (the trader positioning range over the past three years, measured from 0 to 100) shows the speculators are currently Bearish with a score of 30.2 percent. The commercials are Bullish-Extreme with a score of 89.2 percent and the small traders (not shown in chart) are Bearish-Extreme with a score of 16.4 percent.

10-Year Treasury Note StatisticsSPECULATORSCOMMERCIALSSMALL TRADERS
– Percent of Open Interest Longs:11.977.37.9
– Percent of Open Interest Shorts:18.863.514.8
– Net Position:-271,442538,664-267,222
– Gross Longs:461,2903,008,535307,390
– Gross Shorts:732,7322,469,871574,612
– Long to Short Ratio:0.6 to 11.2 to 10.5 to 1
NET POSITION TREND:
– Strength Index Score (3 Year Range Pct):30.289.216.4
– Strength Index Reading (3 Year Range):BearishBullish-ExtremeBearish-Extreme
NET POSITION MOVEMENT INDEX:
– 6-Week Change in Strength Index:-0.7-0.01.1


Ultra 10-Year Notes Futures:

Ultra 10-Year Treasury Notes Bonds Futures COT ChartThe Ultra 10-Year Notes large speculator standing this week resulted in a net position of 76,030 contracts in the data reported through Tuesday. This was a weekly reduction of -18,214 contracts from the previous week which had a total of 94,244 net contracts.

This week’s current strength score (the trader positioning range over the past three years, measured from 0 to 100) shows the speculators are currently Bearish with a score of 47.8 percent. The commercials are Bullish with a score of 73.5 percent and the small traders (not shown in chart) are Bearish-Extreme with a score of 7.0 percent.

Ultra 10-Year Notes StatisticsSPECULATORSCOMMERCIALSSMALL TRADERS
– Percent of Open Interest Longs:19.172.08.0
– Percent of Open Interest Shorts:13.664.521.0
– Net Position:76,030104,304-180,334
– Gross Longs:265,7901,003,270111,865
– Gross Shorts:189,760898,966292,199
– Long to Short Ratio:1.4 to 11.1 to 10.4 to 1
NET POSITION TREND:
– Strength Index Score (3 Year Range Pct):47.873.57.0
– Strength Index Reading (3 Year Range):BearishBullishBearish-Extreme
NET POSITION MOVEMENT INDEX:
– 6-Week Change in Strength Index:-9.914.0-7.4


US Treasury Bonds Futures:

US Year Treasury Notes Long Bonds Futures COT ChartThe US Treasury Bonds large speculator standing this week resulted in a net position of -47,496 contracts in the data reported through Tuesday. This was a weekly boost of 17,542 contracts from the previous week which had a total of -65,038 net contracts.

This week’s current strength score (the trader positioning range over the past three years, measured from 0 to 100) shows the speculators are currently Bullish with a score of 76.4 percent. The commercials are Bearish with a score of 39.3 percent and the small traders (not shown in chart) are Bearish with a score of 42.6 percent.

US Treasury Bonds StatisticsSPECULATORSCOMMERCIALSSMALL TRADERS
– Percent of Open Interest Longs:11.073.113.9
– Percent of Open Interest Shorts:14.968.214.9
– Net Position:-47,49660,037-12,541
– Gross Longs:133,654891,364169,177
– Gross Shorts:181,150831,327181,718
– Long to Short Ratio:0.7 to 11.1 to 10.9 to 1
NET POSITION TREND:
– Strength Index Score (3 Year Range Pct):76.439.342.6
– Strength Index Reading (3 Year Range):BullishBearishBearish
NET POSITION MOVEMENT INDEX:
– 6-Week Change in Strength Index:-0.411.2-27.0


Ultra US Treasury Bonds Futures:

Ultra US Year Treasury Notes Long Bonds Futures COT ChartThe Ultra US Treasury Bonds large speculator standing this week resulted in a net position of -338,350 contracts in the data reported through Tuesday. This was a weekly decline of -28,819 contracts from the previous week which had a total of -309,531 net contracts.

This week’s current strength score (the trader positioning range over the past three years, measured from 0 to 100) shows the speculators are currently Bearish with a score of 47.2 percent. The commercials are Bullish with a score of 62.8 percent and the small traders (not shown in chart) are Bullish with a score of 54.3 percent.

Ultra US Treasury Bonds StatisticsSPECULATORSCOMMERCIALSSMALL TRADERS
– Percent of Open Interest Longs:5.281.412.3
– Percent of Open Interest Shorts:31.757.79.5
– Net Position:-338,350302,04236,308
– Gross Longs:66,2401,037,064157,285
– Gross Shorts:404,590735,022120,977
– Long to Short Ratio:0.2 to 11.4 to 11.3 to 1
NET POSITION TREND:
– Strength Index Score (3 Year Range Pct):47.262.854.3
– Strength Index Reading (3 Year Range):BearishBullishBullish
NET POSITION MOVEMENT INDEX:
– 6-Week Change in Strength Index:-19.613.714.4


Article By InvestMacroReceive our weekly COT Reports by Email

*COT Report: The COT data, released weekly to the public each Friday, is updated through the most recent Tuesday (data is 3 days old) and shows a quick view of how large speculators or non-commercials (for-profit traders) were positioned in the futures markets.

The CFTC categorizes trader positions according to commercial hedgers (traders who use futures contracts for hedging as part of the business), non-commercials (large traders who speculate to realize trading profits) and nonreportable traders (usually small traders/speculators) as well as their open interest (contracts open in the market at time of reporting).See CFTC criteria here.

COT Metals Speculators renewing Copper bullish bets after previous retreat

By InvestMacro | COT | Data Tables | COT Leaders | Downloads | COT Newsletter

Here are the latest charts and statistics for the Commitment of Traders (COT) data published by the Commodities Futures Trading Commission (CFTC).

The latest COT data is updated through Tuesday January 18th and shows a quick view of how large traders (for-profit speculators and commercial entities) were positioned in the futures markets.

Highlighting the COT metals data is the recent turnaround in the Copper futures bets. Speculative positions in Copper rose this week for the third time in the past four weeks directly following a previous streak of nine weekly decreases in spec contracts. Those declines from October 26th to December 21st brought the Copper contracts to the lowest level in eighty-one weeks, dating back to June of 2020. Since December 21st, the Copper speculator positions have had a turnaround and risen by a total of 17,873 contracts. The overall Copper spec standing is currently back above the +20,000 contract level for the first time since November and sits at the highest net standing since November 9th.

Joining Copper (5,604 contracts) in falling this week were Silver (2,152 contracts) and Platinum (1,940 contracts) while the markets with lower speculator bets were Gold (-5,530 contracts) and Palladium (-331 contracts).


Data Snapshot of Commodity Market Traders | Columns Legend
Jan-18-2022OIOI-IndexSpec-NetSpec-IndexCom-NetCOM-IndexSmalls-NetSmalls-Index
WTI Crude2,059,56429385,78132-427,0525941,27173
Gold539,20430194,20750-221,0685026,86140
Silver148,7371529,70052-41,5405811,84012
Copper203,1982922,31058-30,538388,22873
Palladium9,37213-3,30933,40996-10039
Platinum57,321177,22913-12,911915,68241
Natural Gas1,169,18814-118,0474386,1745831,87360
Brent227,41361-20,2068417,211182,99550
Heating Oil367,6864214,82764-39,9352925,10885
Soybeans692,02220128,01562-92,19844-35,81712
Corn1,487,85819388,13880-342,68723-45,45117
Coffee264,3943263,78495-66,93773,15310
Sugar882,59813113,16860-127,0534413,88525
Wheat378,456234,840515,16046-10,00054


Gold Comex Futures:

Gold Futures COT ChartThe Gold Comex Futures large speculator standing this week totaled a net position of 194,207 contracts in the data reported through Tuesday. This was a weekly reduction of -5,530 contracts from the previous week which had a total of 199,737 net contracts.

This week’s current strength score (the trader positioning range over the past three years, measured from 0 to 100) shows the speculators are currently Bearish with a score of 49.6 percent. The commercials are Bullish with a score of 50.1 percent and the small traders (not shown in chart) are Bearish with a score of 40.4 percent.

Gold Futures StatisticsSPECULATORSCOMMERCIALSSMALL TRADERS
– Percent of Open Interest Longs:53.924.68.7
– Percent of Open Interest Shorts:17.965.63.7
– Net Position:194,207-221,06826,861
– Gross Longs:290,528132,76446,978
– Gross Shorts:96,321353,83220,117
– Long to Short Ratio:3.0 to 10.4 to 12.3 to 1
NET POSITION TREND:
– Strength Index Score (3 Year Range Pct):49.650.140.4
– Strength Index Reading (3 Year Range):BearishBullishBearish
NET POSITION MOVEMENT INDEX:
– 6-Week Change in Strength Index:-7.37.5-4.5


Silver Comex Futures:

Silver Futures COT ChartThe Silver Comex Futures large speculator standing this week totaled a net position of 29,700 contracts in the data reported through Tuesday. This was a weekly gain of 2,152 contracts from the previous week which had a total of 27,548 net contracts.

This week’s current strength score (the trader positioning range over the past three years, measured from 0 to 100) shows the speculators are currently Bullish with a score of 52.0 percent. The commercials are Bullish with a score of 58.1 percent and the small traders (not shown in chart) are Bearish-Extreme with a score of 11.8 percent.

Silver Futures StatisticsSPECULATORSCOMMERCIALSSMALL TRADERS
– Percent of Open Interest Longs:44.433.816.6
– Percent of Open Interest Shorts:24.461.88.7
– Net Position:29,700-41,54011,840
– Gross Longs:65,98550,33124,763
– Gross Shorts:36,28591,87112,923
– Long to Short Ratio:1.8 to 10.5 to 11.9 to 1
NET POSITION TREND:
– Strength Index Score (3 Year Range Pct):52.058.111.8
– Strength Index Reading (3 Year Range):BullishBullishBearish-Extreme
NET POSITION MOVEMENT INDEX:
– 6-Week Change in Strength Index:-0.11.6-8.6


Copper Grade #1 Futures:

Copper Futures COT ChartThe Copper Grade #1 Futures large speculator standing this week totaled a net position of 22,310 contracts in the data reported through Tuesday. This was a weekly advance of 5,604 contracts from the previous week which had a total of 16,706 net contracts.

This week’s current strength score (the trader positioning range over the past three years, measured from 0 to 100) shows the speculators are currently Bullish with a score of 58.4 percent. The commercials are Bearish with a score of 38.5 percent and the small traders (not shown in chart) are Bullish with a score of 72.9 percent.

Copper Futures StatisticsSPECULATORSCOMMERCIALSSMALL TRADERS
– Percent of Open Interest Longs:38.239.19.3
– Percent of Open Interest Shorts:27.254.15.3
– Net Position:22,310-30,5388,228
– Gross Longs:77,67379,45518,943
– Gross Shorts:55,363109,99310,715
– Long to Short Ratio:1.4 to 10.7 to 11.8 to 1
NET POSITION TREND:
– Strength Index Score (3 Year Range Pct):58.438.572.9
– Strength Index Reading (3 Year Range):BullishBearishBullish
NET POSITION MOVEMENT INDEX:
– 6-Week Change in Strength Index:10.9-11.27.0


Platinum Futures:

Platinum Futures COT ChartThe Platinum Futures large speculator standing this week totaled a net position of 7,229 contracts in the data reported through Tuesday. This was a weekly increase of 1,940 contracts from the previous week which had a total of 5,289 net contracts.

This week’s current strength score (the trader positioning range over the past three years, measured from 0 to 100) shows the speculators are currently Bearish-Extreme with a score of 12.8 percent. The commercials are Bullish-Extreme with a score of 90.6 percent and the small traders (not shown in chart) are Bearish with a score of 41.3 percent.

Platinum Futures StatisticsSPECULATORSCOMMERCIALSSMALL TRADERS
– Percent of Open Interest Longs:47.633.215.6
– Percent of Open Interest Shorts:35.055.75.7
– Net Position:7,229-12,9115,682
– Gross Longs:27,30419,0078,945
– Gross Shorts:20,07531,9183,263
– Long to Short Ratio:1.4 to 10.6 to 12.7 to 1
NET POSITION TREND:
– Strength Index Score (3 Year Range Pct):12.890.641.3
– Strength Index Reading (3 Year Range):Bearish-ExtremeBullish-ExtremeBearish
NET POSITION MOVEMENT INDEX:
– 6-Week Change in Strength Index:1.7-1.1-5.5


Palladium Futures:

Palladium Futures COT ChartThe Palladium Futures large speculator standing this week totaled a net position of -3,309 contracts in the data reported through Tuesday. This was a weekly decrease of -331 contracts from the previous week which had a total of -2,978 net contracts.

This week’s current strength score (the trader positioning range over the past three years, measured from 0 to 100) shows the speculators are currently Bearish-Extreme with a score of 2.5 percent. The commercials are Bullish-Extreme with a score of 96.2 percent and the small traders (not shown in chart) are Bearish with a score of 38.8 percent.

Palladium Futures StatisticsSPECULATORSCOMMERCIALSSMALL TRADERS
– Percent of Open Interest Longs:28.656.813.6
– Percent of Open Interest Shorts:63.920.414.7
– Net Position:-3,3093,409-100
– Gross Longs:2,6825,3231,275
– Gross Shorts:5,9911,9141,375
– Long to Short Ratio:0.4 to 12.8 to 10.9 to 1
NET POSITION TREND:
– Strength Index Score (3 Year Range Pct):2.596.238.8
– Strength Index Reading (3 Year Range):Bearish-ExtremeBullish-ExtremeBearish
NET POSITION MOVEMENT INDEX:
– 6-Week Change in Strength Index:-3.22.012.1


Article By InvestMacroReceive our weekly COT Reports by Email

*COT Report: The COT data, released weekly to the public each Friday, is updated through the most recent Tuesday (data is 3 days old) and shows a quick view of how large speculators or non-commercials (for-profit traders) were positioned in the futures markets.

The CFTC categorizes trader positions according to commercial hedgers (traders who use futures contracts for hedging as part of the business), non-commercials (large traders who speculate to realize trading profits) and nonreportable traders (usually small traders/speculators) as well as their open interest (contracts open in the market at time of reporting).See CFTC criteria here.

COT Energy Speculators boost WTI Crude Oil bullish bets for 2nd week as Oil price gains

By InvestMacro | COT | Data Tables | COT Leaders | Downloads | COT Newsletter

Here are the latest charts and statistics for the Commitment of Traders (COT) data published by the Commodities Futures Trading Commission (CFTC).

The latest COT data is updated through Tuesday January 18th and shows a quick view of how large traders (for-profit speculators and commercial entities) were positioned in the futures markets.

Highlighting the COT energy data is the renewed bullishness in the WTI Crude Oil futures bets over the past two weeks. The speculative net position in the WTI Crude Oil futures has jumped by over +25,000 contracts in each of the past two weeks (two-week total gain of +52,956 contracts) following eight straight weeks of declining speculator bets previously. This renewed push higher has brought the overall speculator bullish standing to its best level of the past seven weeks. The jump in WTI bets has coincided with a rise in the WTI Crude Oil prices that have reached their best levels since 2014 around the $87 per barrel threshold.

Joining WTI Crude Oil (25,276 contracts) in rising this week were Natural Gas (4,517 contracts), Gasoline (1,287 contracts) and the Bloomberg Commodity Index (5,328 contracts).

The energy markets with lower speculator bets this week were Brent Crude Oil (-3,515 contracts) and Heating Oil (-1,048 contracts).


Data Snapshot of Commodity Market Traders | Columns Legend
Jan-18-2022OIOI-IndexSpec-NetSpec-IndexCom-NetCOM-IndexSmalls-NetSmalls-Index
WTI Crude2,059,56429385,78132-427,0525941,27173
Gold539,20430194,20750-221,0685026,86140
Silver148,7371529,70052-41,5405811,84012
Copper203,1982922,31058-30,538388,22873
Palladium9,37213-3,30933,40996-10039
Platinum57,321177,22913-12,911915,68241
Natural Gas1,169,18814-118,0474386,1745831,87360
Brent227,41361-20,2068417,211182,99550
Heating Oil367,6864214,82764-39,9352925,10885
Soybeans692,02220128,01562-92,19844-35,81712
Corn1,487,85819388,13880-342,68723-45,45117
Coffee264,3943263,78495-66,93773,15310
Sugar882,59813113,16860-127,0534413,88525
Wheat378,456234,840515,16046-10,00054


WTI Crude Oil Futures:

WTI Crude Oil Futures COT ChartThe WTI Crude Oil Futures large speculator standing this week equaled a net position of 385,781 contracts in the data reported through Tuesday. This was a weekly advance of 25,276 contracts from the previous week which had a total of 360,505 net contracts.

This week’s current strength score (the trader positioning range over the past three years, measured from 0 to 100) shows the speculators are currently Bearish with a score of 32.4 percent. The commercials are Bullish with a score of 58.6 percent and the small traders (not shown in chart) are Bullish with a score of 73.2 percent.

WTI Crude Oil Futures StatisticsSPECULATORSCOMMERCIALSSMALL TRADERS
– Percent of Open Interest Longs:24.436.95.0
– Percent of Open Interest Shorts:5.757.63.0
– Net Position:385,781-427,05241,271
– Gross Longs:503,178759,825102,689
– Gross Shorts:117,3971,186,87761,418
– Long to Short Ratio:4.3 to 10.6 to 11.7 to 1
NET POSITION TREND:
– Strength Index Score (3 Year Range Pct):32.458.673.2
– Strength Index Reading (3 Year Range):BearishBullishBullish
NET POSITION MOVEMENT INDEX:
– 6-Week Change in Strength Index:6.2-8.611.4


Brent Crude Oil Futures:

Brent Last Day Crude Oil Futures COT ChartThe Brent Crude Oil Futures large speculator standing this week equaled a net position of -20,206 contracts in the data reported through Tuesday. This was a weekly reduction of -3,515 contracts from the previous week which had a total of -16,691 net contracts.

This week’s current strength score (the trader positioning range over the past three years, measured from 0 to 100) shows the speculators are currently Bullish-Extreme with a score of 83.7 percent. The commercials are Bearish-Extreme with a score of 17.9 percent and the small traders (not shown in chart) are Bearish with a score of 49.7 percent.

Brent Crude Oil Futures StatisticsSPECULATORSCOMMERCIALSSMALL TRADERS
– Percent of Open Interest Longs:18.642.73.6
– Percent of Open Interest Shorts:27.535.22.3
– Net Position:-20,20617,2112,995
– Gross Longs:42,37997,2048,286
– Gross Shorts:62,58579,9935,291
– Long to Short Ratio:0.7 to 11.2 to 11.6 to 1
NET POSITION TREND:
– Strength Index Score (3 Year Range Pct):83.717.949.7
– Strength Index Reading (3 Year Range):Bullish-ExtremeBearish-ExtremeBearish
NET POSITION MOVEMENT INDEX:
– 6-Week Change in Strength Index:0.40.2-4.7


Natural Gas Futures:

Natural Gas Futures COT ChartThe Natural Gas Futures large speculator standing this week equaled a net position of -118,047 contracts in the data reported through Tuesday. This was a weekly lift of 4,517 contracts from the previous week which had a total of -122,564 net contracts.

This week’s current strength score (the trader positioning range over the past three years, measured from 0 to 100) shows the speculators are currently Bearish with a score of 43.2 percent. The commercials are Bullish with a score of 58.0 percent and the small traders (not shown in chart) are Bullish with a score of 59.7 percent.

Natural Gas Futures StatisticsSPECULATORSCOMMERCIALSSMALL TRADERS
– Percent of Open Interest Longs:20.341.54.8
– Percent of Open Interest Shorts:30.434.22.1
– Net Position:-118,04786,17431,873
– Gross Longs:237,851485,72956,405
– Gross Shorts:355,898399,55524,532
– Long to Short Ratio:0.7 to 11.2 to 12.3 to 1
NET POSITION TREND:
– Strength Index Score (3 Year Range Pct):43.258.059.7
– Strength Index Reading (3 Year Range):BearishBullishBullish
NET POSITION MOVEMENT INDEX:
– 6-Week Change in Strength Index:4.3-4.2-3.0


Gasoline Blendstock Futures:

RBOB Gasoline Energy Futures COT ChartThe Gasoline Blendstock Futures large speculator standing this week equaled a net position of 60,789 contracts in the data reported through Tuesday. This was a weekly gain of 1,287 contracts from the previous week which had a total of 59,502 net contracts.

This week’s current strength score (the trader positioning range over the past three years, measured from 0 to 100) shows the speculators are currently Bearish with a score of 32.0 percent. The commercials are Bullish with a score of 69.7 percent and the small traders (not shown in chart) are Bullish with a score of 50.2 percent.

Nasdaq Mini Futures StatisticsSPECULATORSCOMMERCIALSSMALL TRADERS
– Percent of Open Interest Longs:29.049.06.2
– Percent of Open Interest Shorts:12.467.44.5
– Net Position:60,789-67,2656,476
– Gross Longs:105,959179,28722,808
– Gross Shorts:45,170246,55216,332
– Long to Short Ratio:2.3 to 10.7 to 11.4 to 1
NET POSITION TREND:
– Strength Index Score (3 Year Range Pct):32.069.750.2
– Strength Index Reading (3 Year Range):BearishBullishBullish
NET POSITION MOVEMENT INDEX:
– 6-Week Change in Strength Index:11.1-13.213.6


#2 Heating Oil NY-Harbor Futures:

NY Harbor Heating Oil Energy Futures COT ChartThe #2 Heating Oil NY-Harbor Futures large speculator standing this week equaled a net position of 14,827 contracts in the data reported through Tuesday. This was a weekly lowering of -1,048 contracts from the previous week which had a total of 15,875 net contracts.

This week’s current strength score (the trader positioning range over the past three years, measured from 0 to 100) shows the speculators are currently Bullish with a score of 64.2 percent. The commercials are Bearish with a score of 28.7 percent and the small traders (not shown in chart) are Bullish-Extreme with a score of 85.3 percent.

Heating Oil Futures StatisticsSPECULATORSCOMMERCIALSSMALL TRADERS
– Percent of Open Interest Longs:16.350.513.9
– Percent of Open Interest Shorts:12.261.47.1
– Net Position:14,827-39,93525,108
– Gross Longs:59,763185,76451,279
– Gross Shorts:44,936225,69926,171
– Long to Short Ratio:1.3 to 10.8 to 12.0 to 1
NET POSITION TREND:
– Strength Index Score (3 Year Range Pct):64.228.785.3
– Strength Index Reading (3 Year Range):BullishBearishBullish-Extreme
NET POSITION MOVEMENT INDEX:
– 6-Week Change in Strength Index:9.2-19.842.8


Bloomberg Commodity Index Futures:

Bloomberg Commodity Index Futures COT ChartThe Bloomberg Commodity Index Futures large speculator standing this week equaled a net position of -16,277 contracts in the data reported through Tuesday. This was a weekly boost of 5,328 contracts from the previous week which had a total of -21,605 net contracts.

This week’s current strength score (the trader positioning range over the past three years, measured from 0 to 100) shows the speculators are currently Bearish with a score of 45.2 percent. The commercials are Bullish with a score of 53.7 percent and the small traders (not shown in chart) are Bearish with a score of 39.7 percent.

Bloomberg Index Futures StatisticsSPECULATORSCOMMERCIALSSMALL TRADERS
– Percent of Open Interest Longs:62.633.81.2
– Percent of Open Interest Shorts:96.31.20.1
– Net Position:-16,27715,708569
– Gross Longs:30,23216,308595
– Gross Shorts:46,50960026
– Long to Short Ratio:0.7 to 127.2 to 122.9 to 1
NET POSITION TREND:
– Strength Index Score (3 Year Range Pct):45.253.739.7
– Strength Index Reading (3 Year Range):BearishBullishBearish
NET POSITION MOVEMENT INDEX:
– 6-Week Change in Strength Index:0.6-0.60.5


Article By InvestMacroReceive our weekly COT Reports by Email

*COT Report: The COT data, released weekly to the public each Friday, is updated through the most recent Tuesday (data is 3 days old) and shows a quick view of how large speculators or non-commercials (for-profit traders) were positioned in the futures markets.

The CFTC categorizes trader positions according to commercial hedgers (traders who use futures contracts for hedging as part of the business), non-commercials (large traders who speculate to realize trading profits) and nonreportable traders (usually small traders/speculators) as well as their open interest (contracts open in the market at time of reporting).See CFTC criteria here.

COT Soft Commodities Speculators drop Corn bullish bets for 3rd week to 10-week low

By InvestMacro | COT | Data Tables | COT Leaders | Downloads | COT Newsletter

Here are the latest charts and statistics for the Commitment of Traders (COT) data published by the Commodities Futures Trading Commission (CFTC).

The latest COT data is updated through Tuesday January 18th 2022 and shows a quick view of how large traders (for-profit speculators and commercial entities) were positioned in the futures markets.

Highlighting the COT soft commodities data is the recent declines in Corn futures bets. The speculative net position in the Corn futures has fallen for three straight weeks with a total drop by -70,038 contracts over that time-frame. This has brought the current net standing to the lowest level of the past ten weeks and under the +400,000 net contract level for the first time since November 30th. The Corn strength score (current speculator standing compared to past three years where above 80 is bullish extreme & below 20 is bearish extreme) also dipped and fell below the extreme bullish line of 80 percent this week (also first time in 10 weeks) to sit currently at 79.6 percent.

The soft commodities that saw higher speculator bets this week were Coffee (3,616 contracts), Soybean Oil (1,586 contracts), Live Cattle (1,742 contracts), Cotton (1,304 contracts), Cocoa (13,281 contracts), and Wheat (6,306 contracts).

Markets with lower speculator bets this week were Corn (-19,354 contracts), Sugar (-9,757 contracts), Lean Hogs (-2,349 contracts), Soybean Meal (-16,281 contracts) and Soybeans (-10,257 contracts).


Data Snapshot of Commodity Market Traders | Columns Legend
Jan-18-2022OIOI-IndexSpec-NetSpec-IndexCom-NetCOM-IndexSmalls-NetSmalls-Index
WTI Crude2,059,56429385,78132-427,0525941,27173
Gold539,20430194,20750-221,0685026,86140
Silver148,7371529,70052-41,5405811,84012
Copper203,1982922,31058-30,538388,22873
Palladium9,37213-3,30933,40996-10039
Platinum57,321177,22913-12,911915,68241
Natural Gas1,169,18814-118,0474386,1745831,87360
Brent227,41361-20,2068417,211182,99550
Heating Oil367,6864214,82764-39,9352925,10885
Soybeans692,02220128,01562-92,19844-35,81712
Corn1,487,85819388,13880-342,68723-45,45117
Coffee264,3943263,78495-66,93773,15310
Sugar882,59813113,16860-127,0534413,88525
Wheat378,456234,840515,16046-10,00054


CORN Futures:

CORN Futures COT ChartThe CORN large speculator standing this week equaled a net position of 388,138 contracts in the data reported through Tuesday. This was a weekly decline of -19,354 contracts from the previous week which had a total of 407,492 net contracts.

This week’s current strength score (the trader positioning range over the past three years, measured from 0 to 100) shows the speculators are currently Bullish with a score of 79.6 percent. The commercials are Bearish with a score of 23.1 percent and the small traders (not shown in chart) are Bearish-Extreme with a score of 16.9 percent.

CORN Futures StatisticsSPECULATORSCOMMERCIALSSMALL TRADERS
– Percent of Open Interest Longs:32.046.39.3
– Percent of Open Interest Shorts:5.969.312.4
– Net Position:388,138-342,687-45,451
– Gross Longs:476,449688,600138,491
– Gross Shorts:88,3111,031,287183,942
– Long to Short Ratio:5.4 to 10.7 to 10.8 to 1
NET POSITION TREND:
– Strength Index Score (3 Year Range Pct):79.623.116.9
– Strength Index Reading (3 Year Range):BullishBearishBearish-Extreme
NET POSITION MOVEMENT INDEX:
– 6-Week Change in Strength Index:-2.93.6-1.4


SUGAR Futures:

SUGAR Futures COT ChartThe SUGAR large speculator standing this week equaled a net position of 113,168 contracts in the data reported through Tuesday. This was a weekly decrease of -9,757 contracts from the previous week which had a total of 122,925 net contracts.

This week’s current strength score (the trader positioning range over the past three years, measured from 0 to 100) shows the speculators are currently Bullish with a score of 59.9 percent. The commercials are Bearish with a score of 44.1 percent and the small traders (not shown in chart) are Bearish with a score of 25.0 percent.

SUGAR Futures StatisticsSPECULATORSCOMMERCIALSSMALL TRADERS
– Percent of Open Interest Longs:21.854.48.5
– Percent of Open Interest Shorts:9.068.86.9
– Net Position:113,168-127,05313,885
– Gross Longs:192,577480,30274,979
– Gross Shorts:79,409607,35561,094
– Long to Short Ratio:2.4 to 10.8 to 11.2 to 1
NET POSITION TREND:
– Strength Index Score (3 Year Range Pct):59.944.125.0
– Strength Index Reading (3 Year Range):BullishBearishBearish
NET POSITION MOVEMENT INDEX:
– 6-Week Change in Strength Index:-16.017.9-20.0


COFFEE Futures:

COFFEE Futures COT ChartThe COFFEE large speculator standing this week equaled a net position of 63,784 contracts in the data reported through Tuesday. This was a weekly increase of 3,616 contracts from the previous week which had a total of 60,168 net contracts.

This week’s current strength score (the trader positioning range over the past three years, measured from 0 to 100) shows the speculators are currently Bullish-Extreme with a score of 94.9 percent. The commercials are Bearish-Extreme with a score of 7.4 percent and the small traders (not shown in chart) are Bearish-Extreme with a score of 10.1 percent.

COFFEE Futures StatisticsSPECULATORSCOMMERCIALSSMALL TRADERS
– Percent of Open Interest Longs:28.742.63.9
– Percent of Open Interest Shorts:4.668.02.8
– Net Position:63,784-66,9373,153
– Gross Longs:75,931112,76110,428
– Gross Shorts:12,147179,6987,275
– Long to Short Ratio:6.3 to 10.6 to 11.4 to 1
NET POSITION TREND:
– Strength Index Score (3 Year Range Pct):94.97.410.1
– Strength Index Reading (3 Year Range):Bullish-ExtremeBearish-ExtremeBearish-Extreme
NET POSITION MOVEMENT INDEX:
– 6-Week Change in Strength Index:1.0-1.1-0.7


SOYBEANS Futures:

SOYBEANS Futures COT ChartThe SOYBEANS large speculator standing this week equaled a net position of 128,015 contracts in the data reported through Tuesday. This was a weekly decline of -10,257 contracts from the previous week which had a total of 138,272 net contracts.

This week’s current strength score (the trader positioning range over the past three years, measured from 0 to 100) shows the speculators are currently Bullish with a score of 62.0 percent. The commercials are Bearish with a score of 44.1 percent and the small traders (not shown in chart) are Bearish-Extreme with a score of 12.2 percent.

SOYBEANS Futures StatisticsSPECULATORSCOMMERCIALSSMALL TRADERS
– Percent of Open Interest Longs:26.052.56.8
– Percent of Open Interest Shorts:7.565.911.9
– Net Position:128,015-92,198-35,817
– Gross Longs:179,661363,53646,718
– Gross Shorts:51,646455,73482,535
– Long to Short Ratio:3.5 to 10.8 to 10.6 to 1
NET POSITION TREND:
– Strength Index Score (3 Year Range Pct):62.044.112.2
– Strength Index Reading (3 Year Range):BullishBearishBearish-Extreme
NET POSITION MOVEMENT INDEX:
– 6-Week Change in Strength Index:16.9-16.31.8


SOYBEAN OIL Futures:

SOYBEAN OIL Futures COT ChartThe SOYBEAN OIL large speculator standing this week equaled a net position of 51,503 contracts in the data reported through Tuesday. This was a weekly gain of 1,586 contracts from the previous week which had a total of 49,917 net contracts.

This week’s current strength score (the trader positioning range over the past three years, measured from 0 to 100) shows the speculators are currently Bullish with a score of 51.6 percent. The commercials are Bearish with a score of 49.7 percent and the small traders (not shown in chart) are Bearish with a score of 45.5 percent.

SOYBEAN OIL Futures StatisticsSPECULATORSCOMMERCIALSSMALL TRADERS
– Percent of Open Interest Longs:24.550.78.3
– Percent of Open Interest Shorts:11.466.06.1
– Net Position:51,503-60,1008,597
– Gross Longs:96,428199,01932,509
– Gross Shorts:44,925259,11923,912
– Long to Short Ratio:2.1 to 10.8 to 11.4 to 1
NET POSITION TREND:
– Strength Index Score (3 Year Range Pct):51.649.745.5
– Strength Index Reading (3 Year Range):BullishBearishBearish
NET POSITION MOVEMENT INDEX:
– 6-Week Change in Strength Index:-5.92.720.7


SOYBEAN MEAL Futures:

SOYBEAN MEAL Futures COT ChartThe SOYBEAN MEAL large speculator standing this week equaled a net position of 80,893 contracts in the data reported through Tuesday. This was a weekly lowering of -16,281 contracts from the previous week which had a total of 97,174 net contracts.

This week’s current strength score (the trader positioning range over the past three years, measured from 0 to 100) shows the speculators are currently Bullish with a score of 76.2 percent. The commercials are Bearish with a score of 20.9 percent and the small traders (not shown in chart) are Bullish with a score of 79.2 percent.

SOYBEAN MEAL Futures StatisticsSPECULATORSCOMMERCIALSSMALL TRADERS
– Percent of Open Interest Longs:26.646.712.5
– Percent of Open Interest Shorts:6.972.96.0
– Net Position:80,893-107,97327,080
– Gross Longs:109,188191,87851,582
– Gross Shorts:28,295299,85124,502
– Long to Short Ratio:3.9 to 10.6 to 12.1 to 1
NET POSITION TREND:
– Strength Index Score (3 Year Range Pct):76.220.979.2
– Strength Index Reading (3 Year Range):BullishBearishBullish
NET POSITION MOVEMENT INDEX:
– 6-Week Change in Strength Index:16.5-18.921.6


LIVE CATTLE Futures:

LIVE CATTLE Futures COT ChartThe LIVE CATTLE large speculator standing this week equaled a net position of 63,562 contracts in the data reported through Tuesday. This was a weekly rise of 1,742 contracts from the previous week which had a total of 61,820 net contracts.

This week’s current strength score (the trader positioning range over the past three years, measured from 0 to 100) shows the speculators are currently Bearish with a score of 31.7 percent. The commercials are Bullish with a score of 60.1 percent and the small traders (not shown in chart) are Bullish with a score of 73.8 percent.

LIVE CATTLE Futures StatisticsSPECULATORSCOMMERCIALSSMALL TRADERS
– Percent of Open Interest Longs:33.938.510.8
– Percent of Open Interest Shorts:14.656.212.4
– Net Position:63,562-58,078-5,484
– Gross Longs:111,509126,60835,421
– Gross Shorts:47,947184,68640,905
– Long to Short Ratio:2.3 to 10.7 to 10.9 to 1
NET POSITION TREND:
– Strength Index Score (3 Year Range Pct):31.760.173.8
– Strength Index Reading (3 Year Range):BearishBullishBullish
NET POSITION MOVEMENT INDEX:
– 6-Week Change in Strength Index:-9.44.919.6


LEAN HOGS Futures:

LEAN HOGS Futures COT ChartThe LEAN HOGS large speculator standing this week equaled a net position of 48,305 contracts in the data reported through Tuesday. This was a weekly lowering of -2,349 contracts from the previous week which had a total of 50,654 net contracts.

This week’s current strength score (the trader positioning range over the past three years, measured from 0 to 100) shows the speculators are currently Bullish with a score of 60.9 percent. The commercials are Bearish with a score of 48.9 percent and the small traders (not shown in chart) are Bearish-Extreme with a score of 13.6 percent.

LEAN HOGS Futures StatisticsSPECULATORSCOMMERCIALSSMALL TRADERS
– Percent of Open Interest Longs:36.337.67.6
– Percent of Open Interest Shorts:14.752.314.5
– Net Position:48,305-32,883-15,422
– Gross Longs:81,05483,99316,970
– Gross Shorts:32,749116,87632,392
– Long to Short Ratio:2.5 to 10.7 to 10.5 to 1
NET POSITION TREND:
– Strength Index Score (3 Year Range Pct):60.948.913.6
– Strength Index Reading (3 Year Range):BullishBearishBearish-Extreme
NET POSITION MOVEMENT INDEX:
– 6-Week Change in Strength Index:-4.22.37.6


COTTON Futures:

COTTON Futures COT ChartThe COTTON large speculator standing this week equaled a net position of 95,126 contracts in the data reported through Tuesday. This was a weekly advance of 1,304 contracts from the previous week which had a total of 93,822 net contracts.

This week’s current strength score (the trader positioning range over the past three years, measured from 0 to 100) shows the speculators are currently Bullish-Extreme with a score of 83.3 percent. The commercials are Bearish-Extreme with a score of 14.7 percent and the small traders (not shown in chart) are Bullish-Extreme with a score of 95.5 percent.

COTTON Futures StatisticsSPECULATORSCOMMERCIALSSMALL TRADERS
– Percent of Open Interest Longs:43.734.08.5
– Percent of Open Interest Shorts:5.477.63.2
– Net Position:95,126-108,26013,134
– Gross Longs:108,44684,47021,002
– Gross Shorts:13,320192,7307,868
– Long to Short Ratio:8.1 to 10.4 to 12.7 to 1
NET POSITION TREND:
– Strength Index Score (3 Year Range Pct):83.314.795.5
– Strength Index Reading (3 Year Range):Bullish-ExtremeBearish-ExtremeBullish-Extreme
NET POSITION MOVEMENT INDEX:
– 6-Week Change in Strength Index:3.3-5.324.0


COCOA Futures:

COCOA Futures COT ChartThe COCOA large speculator standing this week equaled a net position of 28,214 contracts in the data reported through Tuesday. This was a weekly rise of 13,281 contracts from the previous week which had a total of 14,933 net contracts.

This week’s current strength score (the trader positioning range over the past three years, measured from 0 to 100) shows the speculators are currently Bearish with a score of 49.1 percent. The commercials are Bullish with a score of 51.4 percent and the small traders (not shown in chart) are Bearish with a score of 38.1 percent.

COCOA Futures StatisticsSPECULATORSCOMMERCIALSSMALL TRADERS
– Percent of Open Interest Longs:26.348.15.0
– Percent of Open Interest Shorts:14.660.93.9
– Net Position:28,214-30,8212,607
– Gross Longs:63,470116,40212,024
– Gross Shorts:35,256147,2239,417
– Long to Short Ratio:1.8 to 10.8 to 11.3 to 1
NET POSITION TREND:
– Strength Index Score (3 Year Range Pct):49.151.438.1
– Strength Index Reading (3 Year Range):BearishBullishBearish
NET POSITION MOVEMENT INDEX:
– 6-Week Change in Strength Index:34.0-34.514.9


WHEAT Futures:

WHEAT Futures COT ChartThe WHEAT large speculator standing this week equaled a net position of 4,840 contracts in the data reported through Tuesday. This was a weekly advance of 6,306 contracts from the previous week which had a total of -1,466 net contracts.

This week’s current strength score (the trader positioning range over the past three years, measured from 0 to 100) shows the speculators are currently Bullish with a score of 51.1 percent. The commercials are Bearish with a score of 45.9 percent and the small traders (not shown in chart) are Bullish with a score of 53.8 percent.

WHEAT Futures StatisticsSPECULATORSCOMMERCIALSSMALL TRADERS
– Percent of Open Interest Longs:28.241.08.0
– Percent of Open Interest Shorts:26.939.610.7
– Net Position:4,8405,160-10,000
– Gross Longs:106,763155,14430,339
– Gross Shorts:101,923149,98440,339
– Long to Short Ratio:1.0 to 11.0 to 10.8 to 1
NET POSITION TREND:
– Strength Index Score (3 Year Range Pct):51.145.953.8
– Strength Index Reading (3 Year Range):BullishBearishBullish
NET POSITION MOVEMENT INDEX:
– 6-Week Change in Strength Index:-9.213.2-13.0


Article By InvestMacroReceive our weekly COT Reports by Email

*COT Report: The COT data, released weekly to the public each Friday, is updated through the most recent Tuesday (data is 3 days old) and shows a quick view of how large speculators or non-commercials (for-profit traders) were positioned in the futures markets.

The CFTC categorizes trader positions according to commercial hedgers (traders who use futures contracts for hedging as part of the business), non-commercials (large traders who speculate to realize trading profits) and nonreportable traders (usually small traders/speculators) as well as their open interest (contracts open in the market at time of reporting).See CFTC criteria here.

COT Currency Speculators raise their Euro bets into bullish territory

By InvestMacro | COT | Data Tables | COT Leaders | Downloads | COT Newsletter

Here are the latest charts and statistics for the Commitment of Traders (COT) data published by the Commodities Futures Trading Commission (CFTC).

The latest COT data is updated through Tuesday January 11th 2022 and shows a quick view of how large traders (for-profit speculators and commercial entities) were positioned in the futures markets. All currency positions are in direct relation to the US dollar where, for example, a bet for the euro is a bet that the euro will rise versus the dollar while a bet against the euro will be a bet that the euro will decline versus the dollar.

Highlighting the COT currency data is the bounce back into bullish territory for the Euro in the currency futures contracts. Euro speculators boosted their bets for a fourth consecutive week this week and brought the overall speculator position into its first bullish standing in the past nine weeks (the current net position is now +6,005 contracts). Euro bets had spent from March 2020 through September 2021 in bullish territory with the Euro price reaching as high as 1.2350 before faltering. Speculator bets dropped into bearish territory in October as the euro was in the middle of a downtrend that reached a low of approximately 1.12 on November 24th. Since then, the euro has climbed back above 1.14 and the speculator positions have tipped their toes back into bullish territory. Could a bullish trend change follow?

Joining the Euro (7,559 contracts) with positive changes this week were the Swiss franc (1,869 contracts), British pound sterling (10,005 contracts), New Zealand dollar (241 contracts), Canadian dollar (3,649 contracts), Russian ruble (2,288 contracts), Bitcoin (227 contracts) and the Mexican peso (5,039 contracts).

The currencies with declining bets were the US Dollar Index (-1,186 contracts), yen (-25,263 contracts), Australian dollar (-2,120 contracts) and the Brazil real (-9,736 contracts).


Data Snapshot of Forex Market Traders | Columns Legend
Jan-11-2022OIOI-IndexSpec-NetSpec-IndexCom-NetCOM-IndexSmalls-NetSmalls-Index
USD Index57,2188337,89291-44,14616,25485
EUR682,293776,00537-33,3906627,38520
GBP200,49339-29,1665338,03252-8,86637
JPY234,00578-87,52513108,39290-20,8675
CHF42,71318-7,6605715,59948-7,93940
CAD138,57122-7,376441,996585,38040
AUD185,45372-91,4860103,60996-12,12323
NZD42,06628-8,6045710,30446-1,70032
MXN127,15515-4,451251,238733,21357
RUB44,981459,61736-11,074601,45774
BRL31,08729-10,8125410,84848-3666
Bitcoin10,85558-37795-182055926


US Dollar Index Futures:

US Dollar Index Forex Futures COT ChartThe US Dollar Index large speculator standing this week resulted in a net position of 37,892 contracts in the data reported through Tuesday. This was a weekly decrease of -1,186 contracts from the previous week which had a total of 39,078 net contracts.

This week’s current strength score (the trader positioning range over the past three years, measured from 0 to 100) shows the speculators are currently Bullish-Extreme with a score of 91.1 percent. The commercials are Bearish-Extreme with a score of 1.2 percent and the small traders (not shown in chart) are Bullish-Extreme with a score of 84.9 percent.

US DOLLAR INDEX StatisticsSPECULATORSCOMMERCIALSSMALL TRADERS
– Percent of Open Interest Longs:80.23.014.7
– Percent of Open Interest Shorts:13.980.23.7
– Net Position:37,892-44,1466,254
– Gross Longs:45,8721,7418,396
– Gross Shorts:7,98045,8872,142
– Long to Short Ratio:5.7 to 10.0 to 13.9 to 1
NET POSITION TREND:
– Strength Index Score (3 Year Range Pct):91.11.284.9
– Strength Index Reading (3 Year Range):Bullish-ExtremeBearish-ExtremeBullish-Extreme
NET POSITION MOVEMENT INDEX:
– 6-Week Change in Strength Index:3.5-6.218.5


Euro Currency Futures:

Euro Currency Futures COT ChartThe Euro Currency large speculator standing this week resulted in a net position of 6,005 contracts in the data reported through Tuesday. This was a weekly gain of 7,559 contracts from the previous week which had a total of -1,554 net contracts.

This week’s current strength score (the trader positioning range over the past three years, measured from 0 to 100) shows the speculators are currently Bearish with a score of 36.8 percent. The commercials are Bullish with a score of 66.3 percent and the small traders (not shown in chart) are Bearish-Extreme with a score of 19.8 percent.

EURO Currency StatisticsSPECULATORSCOMMERCIALSSMALL TRADERS
– Percent of Open Interest Longs:30.057.011.7
– Percent of Open Interest Shorts:29.161.97.7
– Net Position:6,005-33,39027,385
– Gross Longs:204,361389,19179,993
– Gross Shorts:198,356422,58152,608
– Long to Short Ratio:1.0 to 10.9 to 11.5 to 1
NET POSITION TREND:
– Strength Index Score (3 Year Range Pct):36.866.319.8
– Strength Index Reading (3 Year Range):BearishBullishBearish-Extreme
NET POSITION MOVEMENT INDEX:
– 6-Week Change in Strength Index:9.0-6.4-11.1


British Pound Sterling Futures:

British Pound Sterling Futures COT ChartThe British Pound Sterling large speculator standing this week resulted in a net position of -29,166 contracts in the data reported through Tuesday. This was a weekly rise of 10,005 contracts from the previous week which had a total of -39,171 net contracts.

This week’s current strength score (the trader positioning range over the past three years, measured from 0 to 100) shows the speculators are currently Bullish with a score of 53.0 percent. The commercials are Bullish with a score of 52.2 percent and the small traders (not shown in chart) are Bearish with a score of 37.3 percent.

BRITISH POUND StatisticsSPECULATORSCOMMERCIALSSMALL TRADERS
– Percent of Open Interest Longs:15.272.111.4
– Percent of Open Interest Shorts:29.853.115.8
– Net Position:-29,16638,032-8,866
– Gross Longs:30,506144,55022,846
– Gross Shorts:59,672106,51831,712
– Long to Short Ratio:0.5 to 11.4 to 10.7 to 1
NET POSITION TREND:
– Strength Index Score (3 Year Range Pct):53.052.237.3
– Strength Index Reading (3 Year Range):BullishBullishBearish
NET POSITION MOVEMENT INDEX:
– 6-Week Change in Strength Index:7.0-9.312.4


Japanese Yen Futures:

Japanese Yen Forex Futures COT ChartThe Japanese Yen large speculator standing this week resulted in a net position of -87,525 contracts in the data reported through Tuesday. This was a weekly fall of -25,263 contracts from the previous week which had a total of -62,262 net contracts.

This week’s current strength score (the trader positioning range over the past three years, measured from 0 to 100) shows the speculators are currently Bearish-Extreme with a score of 12.7 percent. The commercials are Bullish-Extreme with a score of 90.0 percent and the small traders (not shown in chart) are Bearish-Extreme with a score of 4.6 percent.

JAPANESE YEN StatisticsSPECULATORSCOMMERCIALSSMALL TRADERS
– Percent of Open Interest Longs:9.681.17.5
– Percent of Open Interest Shorts:47.034.716.5
– Net Position:-87,525108,392-20,867
– Gross Longs:22,364189,70817,631
– Gross Shorts:109,88981,31638,498
– Long to Short Ratio:0.2 to 12.3 to 10.5 to 1
NET POSITION TREND:
– Strength Index Score (3 Year Range Pct):12.790.04.6
– Strength Index Reading (3 Year Range):Bearish-ExtremeBullish-ExtremeBearish-Extreme
NET POSITION MOVEMENT INDEX:
– 6-Week Change in Strength Index:-5.58.1-16.8


Swiss Franc Futures:

Swiss Franc Forex Futures COT ChartThe Swiss Franc large speculator standing this week resulted in a net position of -7,660 contracts in the data reported through Tuesday. This was a weekly rise of 1,869 contracts from the previous week which had a total of -9,529 net contracts.

This week’s current strength score (the trader positioning range over the past three years, measured from 0 to 100) shows the speculators are currently Bullish with a score of 56.6 percent. The commercials are Bearish with a score of 48.4 percent and the small traders (not shown in chart) are Bearish with a score of 40.0 percent.

SWISS FRANC StatisticsSPECULATORSCOMMERCIALSSMALL TRADERS
– Percent of Open Interest Longs:10.765.323.7
– Percent of Open Interest Shorts:28.628.842.3
– Net Position:-7,66015,599-7,939
– Gross Longs:4,57127,89710,124
– Gross Shorts:12,23112,29818,063
– Long to Short Ratio:0.4 to 12.3 to 10.6 to 1
NET POSITION TREND:
– Strength Index Score (3 Year Range Pct):56.648.440.0
– Strength Index Reading (3 Year Range):BullishBearishBearish
NET POSITION MOVEMENT INDEX:
– 6-Week Change in Strength Index:11.4-6.3-2.8


Canadian Dollar Futures:

Canadian Dollar Forex Futures COT ChartThe Canadian Dollar large speculator standing this week resulted in a net position of -7,376 contracts in the data reported through Tuesday. This was a weekly gain of 3,649 contracts from the previous week which had a total of -11,025 net contracts.

This week’s current strength score (the trader positioning range over the past three years, measured from 0 to 100) shows the speculators are currently Bearish with a score of 44.4 percent. The commercials are Bullish with a score of 57.6 percent and the small traders (not shown in chart) are Bearish with a score of 40.5 percent.

CANADIAN DOLLAR StatisticsSPECULATORSCOMMERCIALSSMALL TRADERS
– Percent of Open Interest Longs:32.043.022.2
– Percent of Open Interest Shorts:37.341.518.3
– Net Position:-7,3761,9965,380
– Gross Longs:44,28459,56930,707
– Gross Shorts:51,66057,57325,327
– Long to Short Ratio:0.9 to 11.0 to 11.2 to 1
NET POSITION TREND:
– Strength Index Score (3 Year Range Pct):44.457.640.5
– Strength Index Reading (3 Year Range):BearishBullishBearish
NET POSITION MOVEMENT INDEX:
– 6-Week Change in Strength Index:6.1-5.42.3


Australian Dollar Futures:

Australian Dollar Forex Futures COT ChartThe Australian Dollar large speculator standing this week resulted in a net position of -91,486 contracts in the data reported through Tuesday. This was a weekly fall of -2,120 contracts from the previous week which had a total of -89,366 net contracts.

This week’s current strength score (the trader positioning range over the past three years, measured from 0 to 100) shows the speculators are currently Bearish-Extreme with a score of 0.0 percent. The commercials are Bullish-Extreme with a score of 96.2 percent and the small traders (not shown in chart) are Bearish with a score of 22.9 percent.

AUSTRALIAN DOLLAR StatisticsSPECULATORSCOMMERCIALSSMALL TRADERS
– Percent of Open Interest Longs:6.781.19.9
– Percent of Open Interest Shorts:56.025.216.5
– Net Position:-91,486103,609-12,123
– Gross Longs:12,383150,37518,406
– Gross Shorts:103,86946,76630,529
– Long to Short Ratio:0.1 to 13.2 to 10.6 to 1
NET POSITION TREND:
– Strength Index Score (3 Year Range Pct):0.096.222.9
– Strength Index Reading (3 Year Range):Bearish-ExtremeBullish-ExtremeBearish
NET POSITION MOVEMENT INDEX:
– 6-Week Change in Strength Index:-10.56.65.9


New Zealand Dollar Futures:

New Zealand Dollar Forex Futures COT ChartThe New Zealand Dollar large speculator standing this week resulted in a net position of -8,604 contracts in the data reported through Tuesday. This was a weekly increase of 241 contracts from the previous week which had a total of -8,845 net contracts.

This week’s current strength score (the trader positioning range over the past three years, measured from 0 to 100) shows the speculators are currently Bullish with a score of 56.8 percent. The commercials are Bearish with a score of 46.3 percent and the small traders (not shown in chart) are Bearish with a score of 32.4 percent.

NEW ZEALAND DOLLAR StatisticsSPECULATORSCOMMERCIALSSMALL TRADERS
– Percent of Open Interest Longs:26.165.77.1
– Percent of Open Interest Shorts:46.541.211.1
– Net Position:-8,60410,304-1,700
– Gross Longs:10,96027,6502,979
– Gross Shorts:19,56417,3464,679
– Long to Short Ratio:0.6 to 11.6 to 10.6 to 1
NET POSITION TREND:
– Strength Index Score (3 Year Range Pct):56.846.332.4
– Strength Index Reading (3 Year Range):BullishBearishBearish
NET POSITION MOVEMENT INDEX:
– 6-Week Change in Strength Index:-32.330.2-4.3


Mexican Peso Futures:

Mexican Peso Futures COT ChartThe Mexican Peso large speculator standing this week resulted in a net position of -4,451 contracts in the data reported through Tuesday. This was a weekly increase of 5,039 contracts from the previous week which had a total of -9,490 net contracts.

This week’s current strength score (the trader positioning range over the past three years, measured from 0 to 100) shows the speculators are currently Bearish with a score of 25.4 percent. The commercials are Bullish with a score of 73.3 percent and the small traders (not shown in chart) are Bullish with a score of 56.6 percent.

MEXICAN PESO StatisticsSPECULATORSCOMMERCIALSSMALL TRADERS
– Percent of Open Interest Longs:41.852.85.0
– Percent of Open Interest Shorts:45.351.92.4
– Net Position:-4,4511,2383,213
– Gross Longs:53,19467,1736,301
– Gross Shorts:57,64565,9353,088
– Long to Short Ratio:0.9 to 11.0 to 12.0 to 1
NET POSITION TREND:
– Strength Index Score (3 Year Range Pct):25.473.356.6
– Strength Index Reading (3 Year Range):BearishBullishBullish
NET POSITION MOVEMENT INDEX:
– 6-Week Change in Strength Index:23.6-25.019.4


Brazilian Real Futures:

Brazil Real Futures COT ChartThe Brazilian Real large speculator standing this week resulted in a net position of -10,812 contracts in the data reported through Tuesday. This was a weekly decrease of -9,736 contracts from the previous week which had a total of -1,076 net contracts.

This week’s current strength score (the trader positioning range over the past three years, measured from 0 to 100) shows the speculators are currently Bullish with a score of 54.2 percent. The commercials are Bearish with a score of 47.9 percent and the small traders (not shown in chart) are Bullish with a score of 66.4 percent.

BRAZIL REAL StatisticsSPECULATORSCOMMERCIALSSMALL TRADERS
– Percent of Open Interest Longs:23.566.98.8
– Percent of Open Interest Shorts:58.332.08.9
– Net Position:-10,81210,848-36
– Gross Longs:7,31220,8012,721
– Gross Shorts:18,1249,9532,757
– Long to Short Ratio:0.4 to 12.1 to 11.0 to 1
NET POSITION TREND:
– Strength Index Score (3 Year Range Pct):54.247.966.4
– Strength Index Reading (3 Year Range):BullishBearishBullish
NET POSITION MOVEMENT INDEX:
– 6-Week Change in Strength Index:4.1-5.614.4


Russian Ruble Futures:

Russian Ruble Futures COT ChartThe Russian Ruble large speculator standing this week resulted in a net position of 9,617 contracts in the data reported through Tuesday. This was a weekly gain of 2,288 contracts from the previous week which had a total of 7,329 net contracts.

This week’s current strength score (the trader positioning range over the past three years, measured from 0 to 100) shows the speculators are currently Bearish with a score of 36.2 percent. The commercials are Bullish with a score of 60.2 percent and the small traders (not shown in chart) are Bullish with a score of 74.1 percent.

RUSSIAN RUBLE StatisticsSPECULATORSCOMMERCIALSSMALL TRADERS
– Percent of Open Interest Longs:42.752.05.2
– Percent of Open Interest Shorts:21.376.62.0
– Net Position:9,617-11,0741,457
– Gross Longs:19,19123,4022,357
– Gross Shorts:9,57434,476900
– Long to Short Ratio:2.0 to 10.7 to 12.6 to 1
NET POSITION TREND:
– Strength Index Score (3 Year Range Pct):36.260.274.1
– Strength Index Reading (3 Year Range):BearishBullishBullish
NET POSITION MOVEMENT INDEX:
– 6-Week Change in Strength Index:-9.510.4-14.6


Bitcoin Futures:

Bitcoin Crypto Futures COT ChartThe Bitcoin large speculator standing this week resulted in a net position of -377 contracts in the data reported through Tuesday. This was a weekly boost of 227 contracts from the previous week which had a total of -604 net contracts.

This week’s current strength score (the trader positioning range over the past three years, measured from 0 to 100) shows the speculators are currently Bullish-Extreme with a score of 94.9 percent. The commercials are Bearish-Extreme with a score of 13.2 percent and the small traders (not shown in chart) are Bearish with a score of 25.6 percent.

BITCOIN StatisticsSPECULATORSCOMMERCIALSSMALL TRADERS
– Percent of Open Interest Longs:73.93.213.3
– Percent of Open Interest Shorts:77.44.98.1
– Net Position:-377-182559
– Gross Longs:8,0253471,441
– Gross Shorts:8,402529882
– Long to Short Ratio:1.0 to 10.7 to 11.6 to 1
NET POSITION TREND:
– Strength Index Score (3 Year Range Pct):94.913.225.6
– Strength Index Reading (3 Year Range):Bullish-ExtremeBearish-ExtremeBearish
NET POSITION MOVEMENT INDEX:
– 6-Week Change in Strength Index:30.9-83.7-9.9


Article By InvestMacroReceive our weekly COT Reports by Email

*COT Report: The COT data, released weekly to the public each Friday, is updated through the most recent Tuesday (data is 3 days old) and shows a quick view of how large speculators or non-commercials (for-profit traders) were positioned in the futures markets.

The CFTC categorizes trader positions according to commercial hedgers (traders who use futures contracts for hedging as part of the business), non-commercials (large traders who speculate to realize trading profits) and nonreportable traders (usually small traders/speculators) as well as their open interest (contracts open in the market at time of reporting).See CFTC criteria here.