
By InvestMacro | COT | Data Tables | COT Leaders | Downloads | COT Newsletter
Here are the latest charts and statistics for the Commitment of Traders (COT) data published by the Commodities Futures Trading Commission (CFTC).
The latest COT data is updated through Tuesday January 18th 2022 and shows a quick view of how large traders (for-profit speculators and commercial entities) were positioned in the futures markets.
Highlighting the COT soft commodities data is the recent declines in Corn futures bets. The speculative net position in the Corn futures has fallen for three straight weeks with a total drop by -70,038 contracts over that time-frame. This has brought the current net standing to the lowest level of the past ten weeks and under the +400,000 net contract level for the first time since November 30th. The Corn strength score (current speculator standing compared to past three years where above 80 is bullish extreme & below 20 is bearish extreme) also dipped and fell below the extreme bullish line of 80 percent this week (also first time in 10 weeks) to sit currently at 79.6 percent.
The soft commodities that saw higher speculator bets this week were Coffee (3,616 contracts), Soybean Oil (1,586 contracts), Live Cattle (1,742 contracts), Cotton (1,304 contracts), Cocoa (13,281 contracts), and Wheat (6,306 contracts).
Markets with lower speculator bets this week were Corn (-19,354 contracts), Sugar (-9,757 contracts), Lean Hogs (-2,349 contracts), Soybean Meal (-16,281 contracts) and Soybeans (-10,257 contracts).
Free Reports:
 Get our Weekly Commitment of Traders Reports - See where the biggest traders (Hedge Funds and Commercial Hedgers) are positioned in the futures markets on a weekly basis.
 Sign Up for Our Stock Market Newsletter – Get updated on News, Charts & Rankings of Public Companies when you join our Stocks Newsletter
| Jan-18-2022 | OI | OI-Index | Spec-Net | Spec-Index | Com-Net | COM-Index | Smalls-Net | Smalls-Index |
|---|---|---|---|---|---|---|---|---|
| WTI Crude | 2,059,564 | 29 | 385,781 | 32 | -427,052 | 59 | 41,271 | 73 |
| Gold | 539,204 | 30 | 194,207 | 50 | -221,068 | 50 | 26,861 | 40 |
| Silver | 148,737 | 15 | 29,700 | 52 | -41,540 | 58 | 11,840 | 12 |
| Copper | 203,198 | 29 | 22,310 | 58 | -30,538 | 38 | 8,228 | 73 |
| Palladium | 9,372 | 13 | -3,309 | 3 | 3,409 | 96 | -100 | 39 |
| Platinum | 57,321 | 17 | 7,229 | 13 | -12,911 | 91 | 5,682 | 41 |
| Natural Gas | 1,169,188 | 14 | -118,047 | 43 | 86,174 | 58 | 31,873 | 60 |
| Brent | 227,413 | 61 | -20,206 | 84 | 17,211 | 18 | 2,995 | 50 |
| Heating Oil | 367,686 | 42 | 14,827 | 64 | -39,935 | 29 | 25,108 | 85 |
| Soybeans | 692,022 | 20 | 128,015 | 62 | -92,198 | 44 | -35,817 | 12 |
| Corn | 1,487,858 | 19 | 388,138 | 80 | -342,687 | 23 | -45,451 | 17 |
| Coffee | 264,394 | 32 | 63,784 | 95 | -66,937 | 7 | 3,153 | 10 |
| Sugar | 882,598 | 13 | 113,168 | 60 | -127,053 | 44 | 13,885 | 25 |
| Wheat | 378,456 | 23 | 4,840 | 51 | 5,160 | 46 | -10,000 | 54 |
CORN Futures:
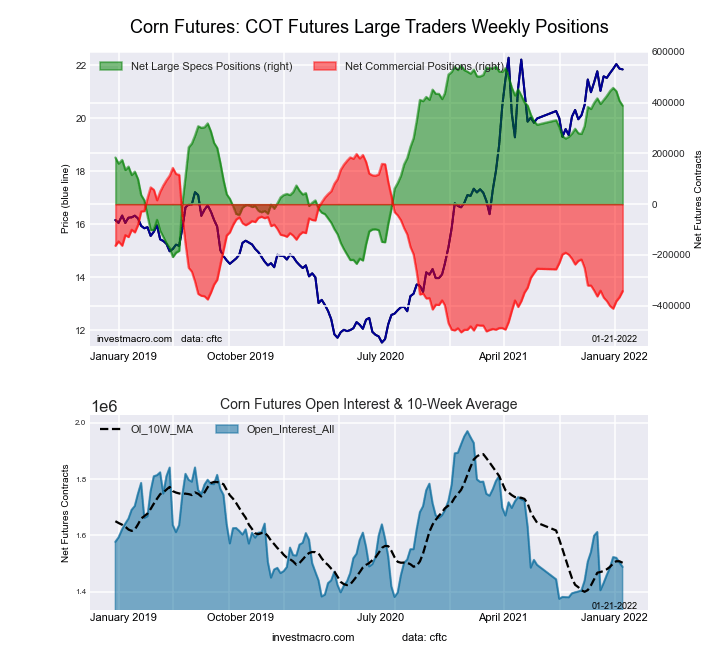 The CORN large speculator standing this week equaled a net position of 388,138 contracts in the data reported through Tuesday. This was a weekly decline of -19,354 contracts from the previous week which had a total of 407,492 net contracts.
This week’s current strength score (the trader positioning range over the past three years, measured from 0 to 100) shows the speculators are currently Bullish with a score of 79.6 percent. The commercials are Bearish with a score of 23.1 percent and the small traders (not shown in chart) are Bearish-Extreme with a score of 16.9 percent.
| CORN Futures Statistics | SPECULATORS | COMMERCIALS | SMALL TRADERS |
| – Percent of Open Interest Longs: | 32.0 | 46.3 | 9.3 |
| – Percent of Open Interest Shorts: | 5.9 | 69.3 | 12.4 |
| – Net Position: | 388,138 | -342,687 | -45,451 |
| – Gross Longs: | 476,449 | 688,600 | 138,491 |
| – Gross Shorts: | 88,311 | 1,031,287 | 183,942 |
| – Long to Short Ratio: | 5.4 to 1 | 0.7 to 1 | 0.8 to 1 |
| NET POSITION TREND: | |||
| – Strength Index Score (3 Year Range Pct): | 79.6 | 23.1 | 16.9 |
| – Strength Index Reading (3 Year Range): | Bullish | Bearish | Bearish-Extreme |
| NET POSITION MOVEMENT INDEX: | |||
| – 6-Week Change in Strength Index: | -2.9 | 3.6 | -1.4 |
SUGAR Futures:
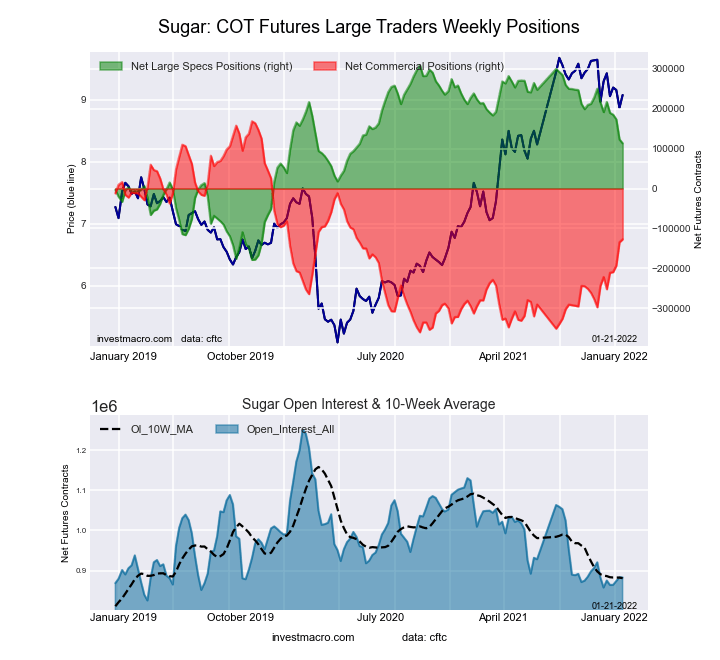 The SUGAR large speculator standing this week equaled a net position of 113,168 contracts in the data reported through Tuesday. This was a weekly decrease of -9,757 contracts from the previous week which had a total of 122,925 net contracts.
This week’s current strength score (the trader positioning range over the past three years, measured from 0 to 100) shows the speculators are currently Bullish with a score of 59.9 percent. The commercials are Bearish with a score of 44.1 percent and the small traders (not shown in chart) are Bearish with a score of 25.0 percent.
| SUGAR Futures Statistics | SPECULATORS | COMMERCIALS | SMALL TRADERS |
| – Percent of Open Interest Longs: | 21.8 | 54.4 | 8.5 |
| – Percent of Open Interest Shorts: | 9.0 | 68.8 | 6.9 |
| – Net Position: | 113,168 | -127,053 | 13,885 |
| – Gross Longs: | 192,577 | 480,302 | 74,979 |
| – Gross Shorts: | 79,409 | 607,355 | 61,094 |
| – Long to Short Ratio: | 2.4 to 1 | 0.8 to 1 | 1.2 to 1 |
| NET POSITION TREND: | |||
| – Strength Index Score (3 Year Range Pct): | 59.9 | 44.1 | 25.0 |
| – Strength Index Reading (3 Year Range): | Bullish | Bearish | Bearish |
| NET POSITION MOVEMENT INDEX: | |||
| – 6-Week Change in Strength Index: | -16.0 | 17.9 | -20.0 |
COFFEE Futures:
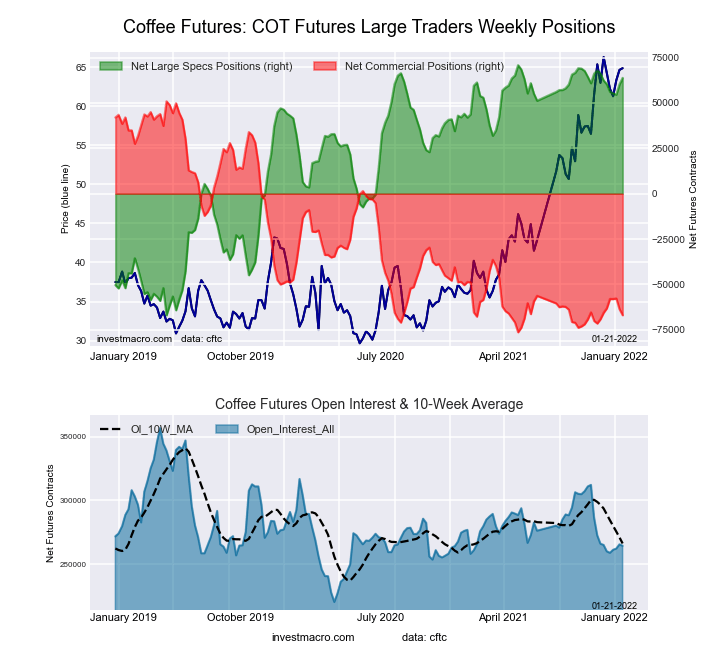 The COFFEE large speculator standing this week equaled a net position of 63,784 contracts in the data reported through Tuesday. This was a weekly increase of 3,616 contracts from the previous week which had a total of 60,168 net contracts.
This week’s current strength score (the trader positioning range over the past three years, measured from 0 to 100) shows the speculators are currently Bullish-Extreme with a score of 94.9 percent. The commercials are Bearish-Extreme with a score of 7.4 percent and the small traders (not shown in chart) are Bearish-Extreme with a score of 10.1 percent.
| COFFEE Futures Statistics | SPECULATORS | COMMERCIALS | SMALL TRADERS |
| – Percent of Open Interest Longs: | 28.7 | 42.6 | 3.9 |
| – Percent of Open Interest Shorts: | 4.6 | 68.0 | 2.8 |
| – Net Position: | 63,784 | -66,937 | 3,153 |
| – Gross Longs: | 75,931 | 112,761 | 10,428 |
| – Gross Shorts: | 12,147 | 179,698 | 7,275 |
| – Long to Short Ratio: | 6.3 to 1 | 0.6 to 1 | 1.4 to 1 |
| NET POSITION TREND: | |||
| – Strength Index Score (3 Year Range Pct): | 94.9 | 7.4 | 10.1 |
| – Strength Index Reading (3 Year Range): | Bullish-Extreme | Bearish-Extreme | Bearish-Extreme |
| NET POSITION MOVEMENT INDEX: | |||
| – 6-Week Change in Strength Index: | 1.0 | -1.1 | -0.7 |
SOYBEANS Futures:
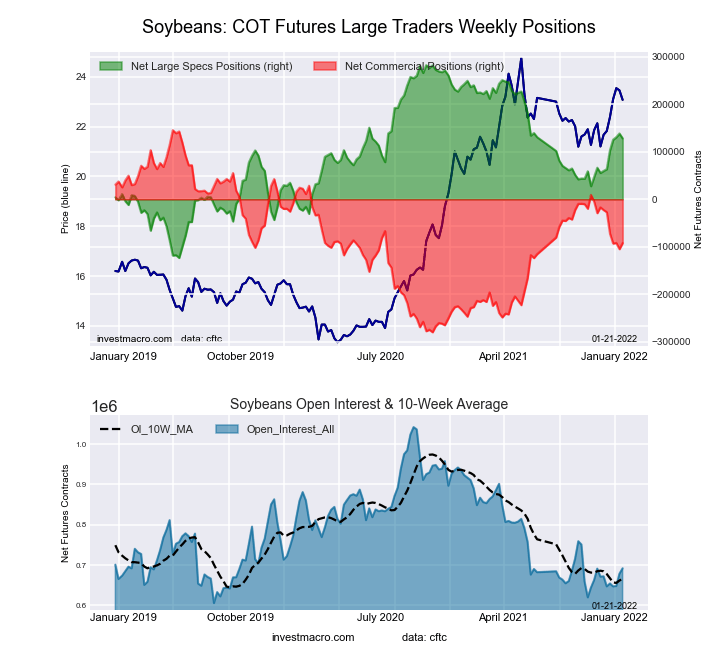 The SOYBEANS large speculator standing this week equaled a net position of 128,015 contracts in the data reported through Tuesday. This was a weekly decline of -10,257 contracts from the previous week which had a total of 138,272 net contracts.
This week’s current strength score (the trader positioning range over the past three years, measured from 0 to 100) shows the speculators are currently Bullish with a score of 62.0 percent. The commercials are Bearish with a score of 44.1 percent and the small traders (not shown in chart) are Bearish-Extreme with a score of 12.2 percent.
| SOYBEANS Futures Statistics | SPECULATORS | COMMERCIALS | SMALL TRADERS |
| – Percent of Open Interest Longs: | 26.0 | 52.5 | 6.8 |
| – Percent of Open Interest Shorts: | 7.5 | 65.9 | 11.9 |
| – Net Position: | 128,015 | -92,198 | -35,817 |
| – Gross Longs: | 179,661 | 363,536 | 46,718 |
| – Gross Shorts: | 51,646 | 455,734 | 82,535 |
| – Long to Short Ratio: | 3.5 to 1 | 0.8 to 1 | 0.6 to 1 |
| NET POSITION TREND: | |||
| – Strength Index Score (3 Year Range Pct): | 62.0 | 44.1 | 12.2 |
| – Strength Index Reading (3 Year Range): | Bullish | Bearish | Bearish-Extreme |
| NET POSITION MOVEMENT INDEX: | |||
| – 6-Week Change in Strength Index: | 16.9 | -16.3 | 1.8 |
SOYBEAN OIL Futures:
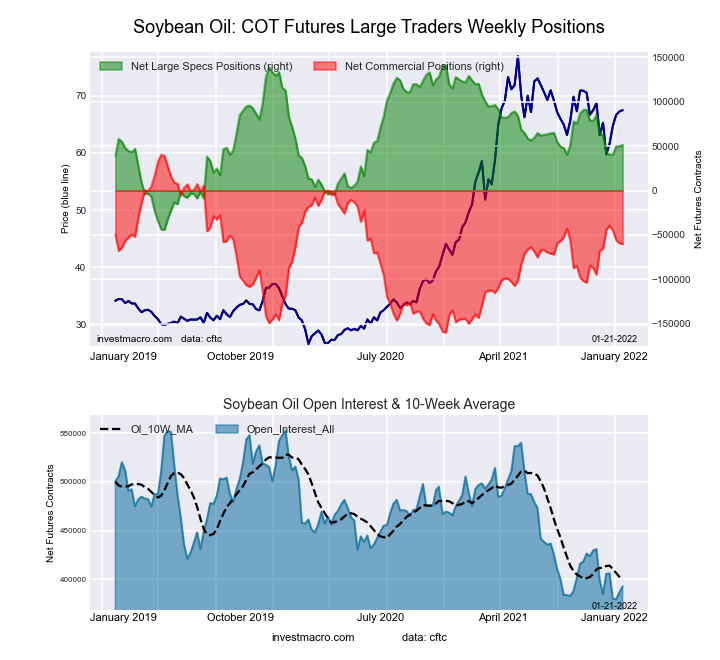 The SOYBEAN OIL large speculator standing this week equaled a net position of 51,503 contracts in the data reported through Tuesday. This was a weekly gain of 1,586 contracts from the previous week which had a total of 49,917 net contracts.
This week’s current strength score (the trader positioning range over the past three years, measured from 0 to 100) shows the speculators are currently Bullish with a score of 51.6 percent. The commercials are Bearish with a score of 49.7 percent and the small traders (not shown in chart) are Bearish with a score of 45.5 percent.
| SOYBEAN OIL Futures Statistics | SPECULATORS | COMMERCIALS | SMALL TRADERS |
| – Percent of Open Interest Longs: | 24.5 | 50.7 | 8.3 |
| – Percent of Open Interest Shorts: | 11.4 | 66.0 | 6.1 |
| – Net Position: | 51,503 | -60,100 | 8,597 |
| – Gross Longs: | 96,428 | 199,019 | 32,509 |
| – Gross Shorts: | 44,925 | 259,119 | 23,912 |
| – Long to Short Ratio: | 2.1 to 1 | 0.8 to 1 | 1.4 to 1 |
| NET POSITION TREND: | |||
| – Strength Index Score (3 Year Range Pct): | 51.6 | 49.7 | 45.5 |
| – Strength Index Reading (3 Year Range): | Bullish | Bearish | Bearish |
| NET POSITION MOVEMENT INDEX: | |||
| – 6-Week Change in Strength Index: | -5.9 | 2.7 | 20.7 |
SOYBEAN MEAL Futures:
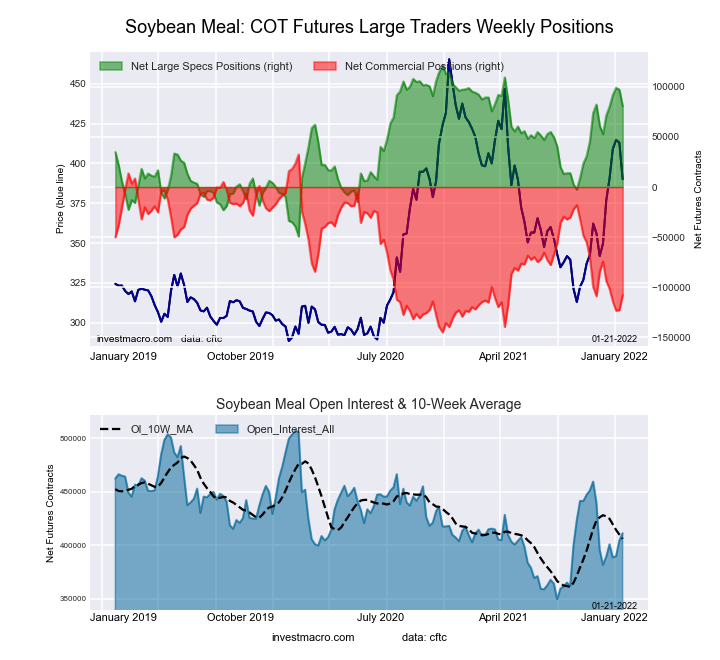 The SOYBEAN MEAL large speculator standing this week equaled a net position of 80,893 contracts in the data reported through Tuesday. This was a weekly lowering of -16,281 contracts from the previous week which had a total of 97,174 net contracts.
This week’s current strength score (the trader positioning range over the past three years, measured from 0 to 100) shows the speculators are currently Bullish with a score of 76.2 percent. The commercials are Bearish with a score of 20.9 percent and the small traders (not shown in chart) are Bullish with a score of 79.2 percent.
| SOYBEAN MEAL Futures Statistics | SPECULATORS | COMMERCIALS | SMALL TRADERS |
| – Percent of Open Interest Longs: | 26.6 | 46.7 | 12.5 |
| – Percent of Open Interest Shorts: | 6.9 | 72.9 | 6.0 |
| – Net Position: | 80,893 | -107,973 | 27,080 |
| – Gross Longs: | 109,188 | 191,878 | 51,582 |
| – Gross Shorts: | 28,295 | 299,851 | 24,502 |
| – Long to Short Ratio: | 3.9 to 1 | 0.6 to 1 | 2.1 to 1 |
| NET POSITION TREND: | |||
| – Strength Index Score (3 Year Range Pct): | 76.2 | 20.9 | 79.2 |
| – Strength Index Reading (3 Year Range): | Bullish | Bearish | Bullish |
| NET POSITION MOVEMENT INDEX: | |||
| – 6-Week Change in Strength Index: | 16.5 | -18.9 | 21.6 |
LIVE CATTLE Futures:
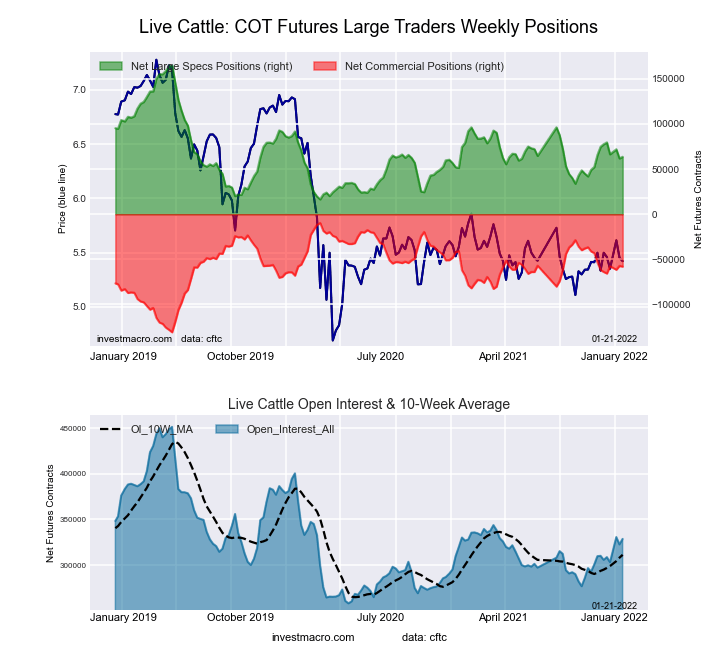 The LIVE CATTLE large speculator standing this week equaled a net position of 63,562 contracts in the data reported through Tuesday. This was a weekly rise of 1,742 contracts from the previous week which had a total of 61,820 net contracts.
This week’s current strength score (the trader positioning range over the past three years, measured from 0 to 100) shows the speculators are currently Bearish with a score of 31.7 percent. The commercials are Bullish with a score of 60.1 percent and the small traders (not shown in chart) are Bullish with a score of 73.8 percent.
| LIVE CATTLE Futures Statistics | SPECULATORS | COMMERCIALS | SMALL TRADERS |
| – Percent of Open Interest Longs: | 33.9 | 38.5 | 10.8 |
| – Percent of Open Interest Shorts: | 14.6 | 56.2 | 12.4 |
| – Net Position: | 63,562 | -58,078 | -5,484 |
| – Gross Longs: | 111,509 | 126,608 | 35,421 |
| – Gross Shorts: | 47,947 | 184,686 | 40,905 |
| – Long to Short Ratio: | 2.3 to 1 | 0.7 to 1 | 0.9 to 1 |
| NET POSITION TREND: | |||
| – Strength Index Score (3 Year Range Pct): | 31.7 | 60.1 | 73.8 |
| – Strength Index Reading (3 Year Range): | Bearish | Bullish | Bullish |
| NET POSITION MOVEMENT INDEX: | |||
| – 6-Week Change in Strength Index: | -9.4 | 4.9 | 19.6 |
LEAN HOGS Futures:
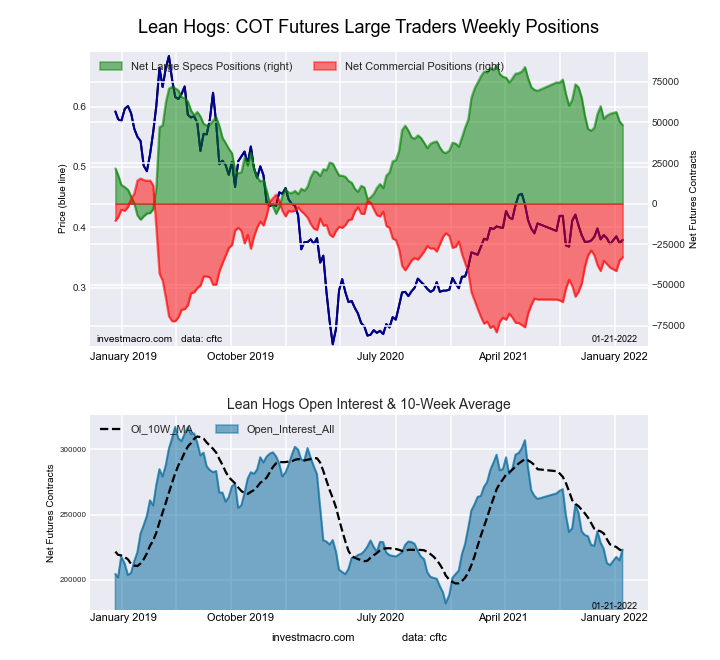 The LEAN HOGS large speculator standing this week equaled a net position of 48,305 contracts in the data reported through Tuesday. This was a weekly lowering of -2,349 contracts from the previous week which had a total of 50,654 net contracts.
This week’s current strength score (the trader positioning range over the past three years, measured from 0 to 100) shows the speculators are currently Bullish with a score of 60.9 percent. The commercials are Bearish with a score of 48.9 percent and the small traders (not shown in chart) are Bearish-Extreme with a score of 13.6 percent.
| LEAN HOGS Futures Statistics | SPECULATORS | COMMERCIALS | SMALL TRADERS |
| – Percent of Open Interest Longs: | 36.3 | 37.6 | 7.6 |
| – Percent of Open Interest Shorts: | 14.7 | 52.3 | 14.5 |
| – Net Position: | 48,305 | -32,883 | -15,422 |
| – Gross Longs: | 81,054 | 83,993 | 16,970 |
| – Gross Shorts: | 32,749 | 116,876 | 32,392 |
| – Long to Short Ratio: | 2.5 to 1 | 0.7 to 1 | 0.5 to 1 |
| NET POSITION TREND: | |||
| – Strength Index Score (3 Year Range Pct): | 60.9 | 48.9 | 13.6 |
| – Strength Index Reading (3 Year Range): | Bullish | Bearish | Bearish-Extreme |
| NET POSITION MOVEMENT INDEX: | |||
| – 6-Week Change in Strength Index: | -4.2 | 2.3 | 7.6 |
COTTON Futures:
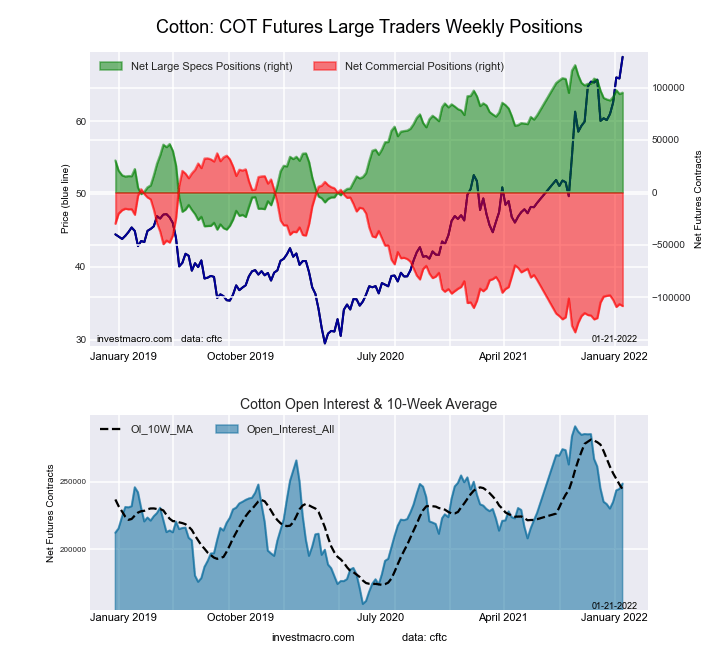 The COTTON large speculator standing this week equaled a net position of 95,126 contracts in the data reported through Tuesday. This was a weekly advance of 1,304 contracts from the previous week which had a total of 93,822 net contracts.
This week’s current strength score (the trader positioning range over the past three years, measured from 0 to 100) shows the speculators are currently Bullish-Extreme with a score of 83.3 percent. The commercials are Bearish-Extreme with a score of 14.7 percent and the small traders (not shown in chart) are Bullish-Extreme with a score of 95.5 percent.
| COTTON Futures Statistics | SPECULATORS | COMMERCIALS | SMALL TRADERS |
| – Percent of Open Interest Longs: | 43.7 | 34.0 | 8.5 |
| – Percent of Open Interest Shorts: | 5.4 | 77.6 | 3.2 |
| – Net Position: | 95,126 | -108,260 | 13,134 |
| – Gross Longs: | 108,446 | 84,470 | 21,002 |
| – Gross Shorts: | 13,320 | 192,730 | 7,868 |
| – Long to Short Ratio: | 8.1 to 1 | 0.4 to 1 | 2.7 to 1 |
| NET POSITION TREND: | |||
| – Strength Index Score (3 Year Range Pct): | 83.3 | 14.7 | 95.5 |
| – Strength Index Reading (3 Year Range): | Bullish-Extreme | Bearish-Extreme | Bullish-Extreme |
| NET POSITION MOVEMENT INDEX: | |||
| – 6-Week Change in Strength Index: | 3.3 | -5.3 | 24.0 |
COCOA Futures:
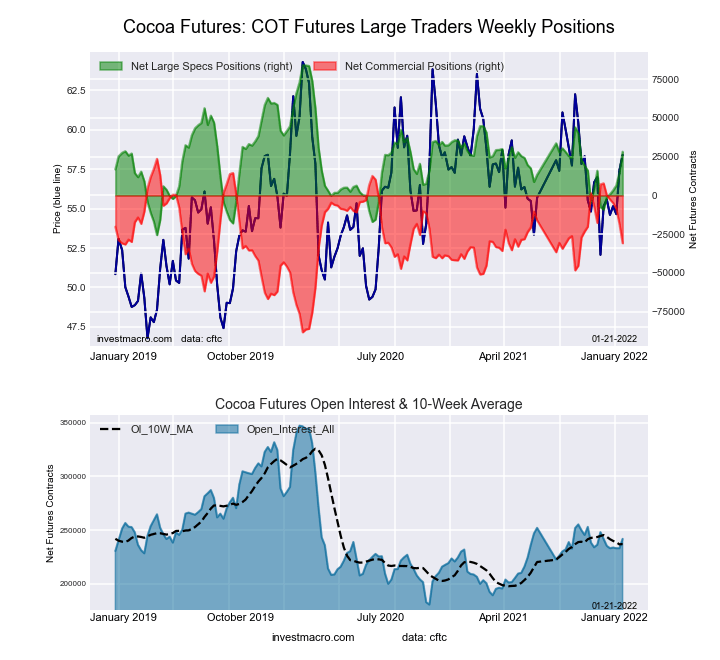 The COCOA large speculator standing this week equaled a net position of 28,214 contracts in the data reported through Tuesday. This was a weekly rise of 13,281 contracts from the previous week which had a total of 14,933 net contracts.
This week’s current strength score (the trader positioning range over the past three years, measured from 0 to 100) shows the speculators are currently Bearish with a score of 49.1 percent. The commercials are Bullish with a score of 51.4 percent and the small traders (not shown in chart) are Bearish with a score of 38.1 percent.
| COCOA Futures Statistics | SPECULATORS | COMMERCIALS | SMALL TRADERS |
| – Percent of Open Interest Longs: | 26.3 | 48.1 | 5.0 |
| – Percent of Open Interest Shorts: | 14.6 | 60.9 | 3.9 |
| – Net Position: | 28,214 | -30,821 | 2,607 |
| – Gross Longs: | 63,470 | 116,402 | 12,024 |
| – Gross Shorts: | 35,256 | 147,223 | 9,417 |
| – Long to Short Ratio: | 1.8 to 1 | 0.8 to 1 | 1.3 to 1 |
| NET POSITION TREND: | |||
| – Strength Index Score (3 Year Range Pct): | 49.1 | 51.4 | 38.1 |
| – Strength Index Reading (3 Year Range): | Bearish | Bullish | Bearish |
| NET POSITION MOVEMENT INDEX: | |||
| – 6-Week Change in Strength Index: | 34.0 | -34.5 | 14.9 |
WHEAT Futures:
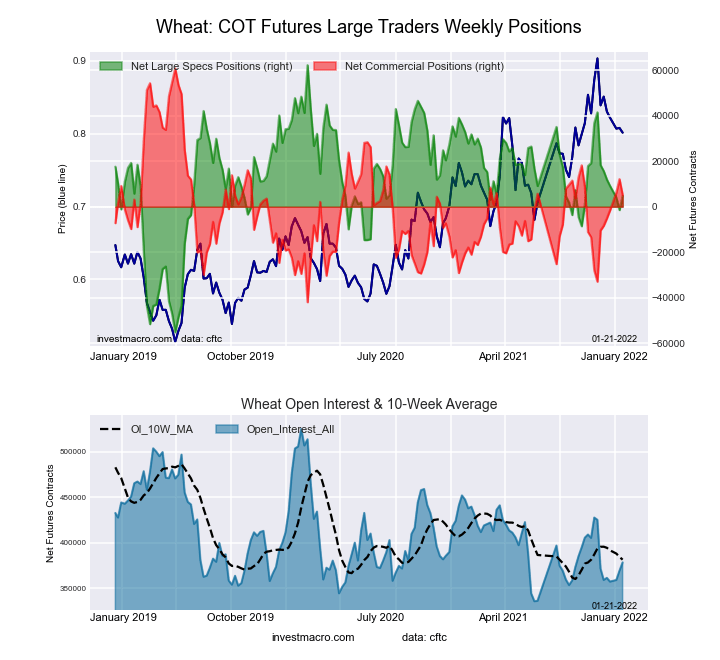 The WHEAT large speculator standing this week equaled a net position of 4,840 contracts in the data reported through Tuesday. This was a weekly advance of 6,306 contracts from the previous week which had a total of -1,466 net contracts.
This week’s current strength score (the trader positioning range over the past three years, measured from 0 to 100) shows the speculators are currently Bullish with a score of 51.1 percent. The commercials are Bearish with a score of 45.9 percent and the small traders (not shown in chart) are Bullish with a score of 53.8 percent.
| WHEAT Futures Statistics | SPECULATORS | COMMERCIALS | SMALL TRADERS |
| – Percent of Open Interest Longs: | 28.2 | 41.0 | 8.0 |
| – Percent of Open Interest Shorts: | 26.9 | 39.6 | 10.7 |
| – Net Position: | 4,840 | 5,160 | -10,000 |
| – Gross Longs: | 106,763 | 155,144 | 30,339 |
| – Gross Shorts: | 101,923 | 149,984 | 40,339 |
| – Long to Short Ratio: | 1.0 to 1 | 1.0 to 1 | 0.8 to 1 |
| NET POSITION TREND: | |||
| – Strength Index Score (3 Year Range Pct): | 51.1 | 45.9 | 53.8 |
| – Strength Index Reading (3 Year Range): | Bullish | Bearish | Bullish |
| NET POSITION MOVEMENT INDEX: | |||
| – 6-Week Change in Strength Index: | -9.2 | 13.2 | -13.0 |
Article By InvestMacro – Receive our weekly COT Reports by Email
*COT Report: The COT data, released weekly to the public each Friday, is updated through the most recent Tuesday (data is 3 days old) and shows a quick view of how large speculators or non-commercials (for-profit traders) were positioned in the futures markets.
The CFTC categorizes trader positions according to commercial hedgers (traders who use futures contracts for hedging as part of the business), non-commercials (large traders who speculate to realize trading profits) and nonreportable traders (usually small traders/speculators) as well as their open interest (contracts open in the market at time of reporting).See CFTC criteria here.

- COT Metals Charts: Weekly Speculator Bets led by Copper & Steel Jul 18, 2026
- COT Bonds Charts: Weekly Speculator Bets led by 2-Year, SOFR 3M & 5-Year Bonds Jul 18, 2026
- COT Energy Charts: Weekly Speculator Bets led by Brent Oil & Heating Oil Jul 18, 2026
- COT Soft Commodities Charts: Weekly Speculator Bets led by Wheat, Corn & Soybean Meal Jul 18, 2026
- The Bank of Canada kept its interest rate unchanged. Platinum prices reached a three‑week high Jul 16, 2026
- Stock indices rose after the release of US inflation data. China’s GDP slowed sharply Jul 15, 2026
- GBP/USD Awaits Political News: What Will Happen Next Jul 15, 2026
- USD/JPY Holds at Highs: Pressure Lingers on Yen Jul 14, 2026
- Oil prices jumped 4% amid a new wave of escalation between the US and Iran Jul 13, 2026
- EUR/USD: US Inflation Will Determine Everything Jul 13, 2026