
By InvestMacro | COT | Data Tables | COT Leaders | Downloads | COT Newsletter
Here are the latest charts and statistics for the Commitment of Traders (COT) data published by the Commodities Futures Trading Commission (CFTC).
The latest COT data is updated through Tuesday January 18th and shows a quick view of how large traders (for-profit speculators and commercial entities) were positioned in the futures markets.
Highlighting the COT metals data is the recent turnaround in the Copper futures bets. Speculative positions in Copper rose this week for the third time in the past four weeks directly following a previous streak of nine weekly decreases in spec contracts. Those declines from October 26th to December 21st brought the Copper contracts to the lowest level in eighty-one weeks, dating back to June of 2020. Since December 21st, the Copper speculator positions have had a turnaround and risen by a total of 17,873 contracts. The overall Copper spec standing is currently back above the +20,000 contract level for the first time since November and sits at the highest net standing since November 9th.
Joining Copper (5,604 contracts) in falling this week were Silver (2,152 contracts) and Platinum (1,940 contracts) while the markets with lower speculator bets were Gold (-5,530 contracts) and Palladium (-331 contracts).
| Jan-18-2022 | OI | OI-Index | Spec-Net | Spec-Index | Com-Net | COM-Index | Smalls-Net | Smalls-Index |
|---|---|---|---|---|---|---|---|---|
| WTI Crude | 2,059,564 | 29 | 385,781 | 32 | -427,052 | 59 | 41,271 | 73 |
| Gold | 539,204 | 30 | 194,207 | 50 | -221,068 | 50 | 26,861 | 40 |
| Silver | 148,737 | 15 | 29,700 | 52 | -41,540 | 58 | 11,840 | 12 |
| Copper | 203,198 | 29 | 22,310 | 58 | -30,538 | 38 | 8,228 | 73 |
| Palladium | 9,372 | 13 | -3,309 | 3 | 3,409 | 96 | -100 | 39 |
| Platinum | 57,321 | 17 | 7,229 | 13 | -12,911 | 91 | 5,682 | 41 |
| Natural Gas | 1,169,188 | 14 | -118,047 | 43 | 86,174 | 58 | 31,873 | 60 |
| Brent | 227,413 | 61 | -20,206 | 84 | 17,211 | 18 | 2,995 | 50 |
| Heating Oil | 367,686 | 42 | 14,827 | 64 | -39,935 | 29 | 25,108 | 85 |
| Soybeans | 692,022 | 20 | 128,015 | 62 | -92,198 | 44 | -35,817 | 12 |
| Corn | 1,487,858 | 19 | 388,138 | 80 | -342,687 | 23 | -45,451 | 17 |
| Coffee | 264,394 | 32 | 63,784 | 95 | -66,937 | 7 | 3,153 | 10 |
| Sugar | 882,598 | 13 | 113,168 | 60 | -127,053 | 44 | 13,885 | 25 |
| Wheat | 378,456 | 23 | 4,840 | 51 | 5,160 | 46 | -10,000 | 54 |
Free Reports:
 Sign Up for Our Stock Market Newsletter – Get updated on News, Charts & Rankings of Public Companies when you join our Stocks Newsletter
 Get our Weekly Commitment of Traders Reports - See where the biggest traders (Hedge Funds and Commercial Hedgers) are positioned in the futures markets on a weekly basis.
Gold Comex Futures:
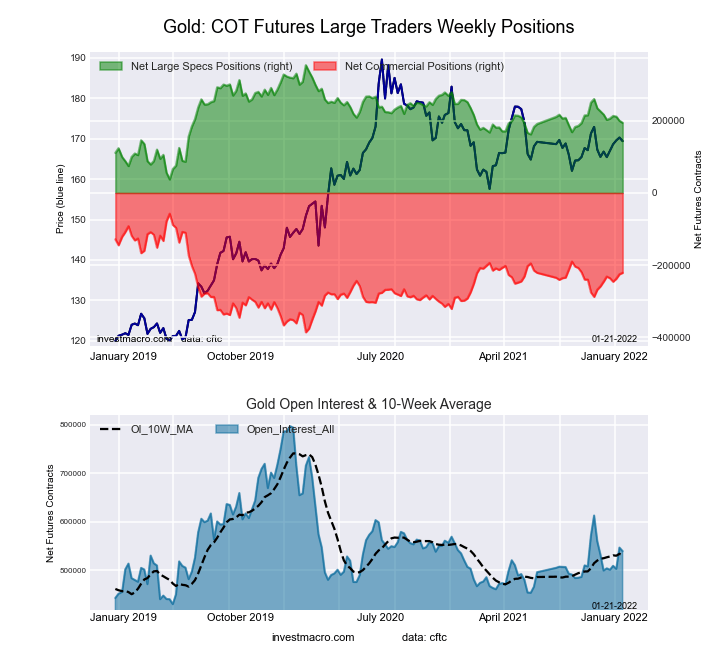 The Gold Comex Futures large speculator standing this week totaled a net position of 194,207 contracts in the data reported through Tuesday. This was a weekly reduction of -5,530 contracts from the previous week which had a total of 199,737 net contracts.
This week’s current strength score (the trader positioning range over the past three years, measured from 0 to 100) shows the speculators are currently Bearish with a score of 49.6 percent. The commercials are Bullish with a score of 50.1 percent and the small traders (not shown in chart) are Bearish with a score of 40.4 percent.
| Gold Futures Statistics | SPECULATORS | COMMERCIALS | SMALL TRADERS |
| – Percent of Open Interest Longs: | 53.9 | 24.6 | 8.7 |
| – Percent of Open Interest Shorts: | 17.9 | 65.6 | 3.7 |
| – Net Position: | 194,207 | -221,068 | 26,861 |
| – Gross Longs: | 290,528 | 132,764 | 46,978 |
| – Gross Shorts: | 96,321 | 353,832 | 20,117 |
| – Long to Short Ratio: | 3.0 to 1 | 0.4 to 1 | 2.3 to 1 |
| NET POSITION TREND: | |||
| – Strength Index Score (3 Year Range Pct): | 49.6 | 50.1 | 40.4 |
| – Strength Index Reading (3 Year Range): | Bearish | Bullish | Bearish |
| NET POSITION MOVEMENT INDEX: | |||
| – 6-Week Change in Strength Index: | -7.3 | 7.5 | -4.5 |
Silver Comex Futures:
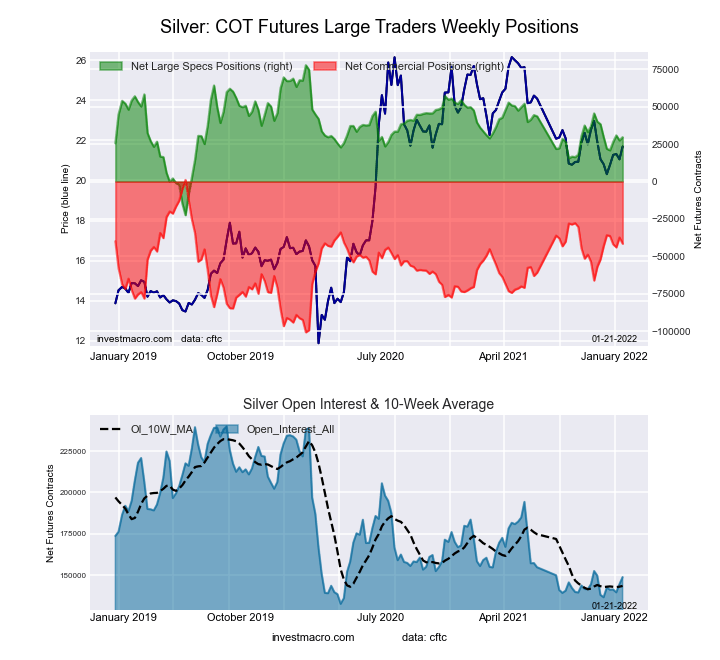 The Silver Comex Futures large speculator standing this week totaled a net position of 29,700 contracts in the data reported through Tuesday. This was a weekly gain of 2,152 contracts from the previous week which had a total of 27,548 net contracts.
This week’s current strength score (the trader positioning range over the past three years, measured from 0 to 100) shows the speculators are currently Bullish with a score of 52.0 percent. The commercials are Bullish with a score of 58.1 percent and the small traders (not shown in chart) are Bearish-Extreme with a score of 11.8 percent.
| Silver Futures Statistics | SPECULATORS | COMMERCIALS | SMALL TRADERS |
| – Percent of Open Interest Longs: | 44.4 | 33.8 | 16.6 |
| – Percent of Open Interest Shorts: | 24.4 | 61.8 | 8.7 |
| – Net Position: | 29,700 | -41,540 | 11,840 |
| – Gross Longs: | 65,985 | 50,331 | 24,763 |
| – Gross Shorts: | 36,285 | 91,871 | 12,923 |
| – Long to Short Ratio: | 1.8 to 1 | 0.5 to 1 | 1.9 to 1 |
| NET POSITION TREND: | |||
| – Strength Index Score (3 Year Range Pct): | 52.0 | 58.1 | 11.8 |
| – Strength Index Reading (3 Year Range): | Bullish | Bullish | Bearish-Extreme |
| NET POSITION MOVEMENT INDEX: | |||
| – 6-Week Change in Strength Index: | -0.1 | 1.6 | -8.6 |
Copper Grade #1 Futures:
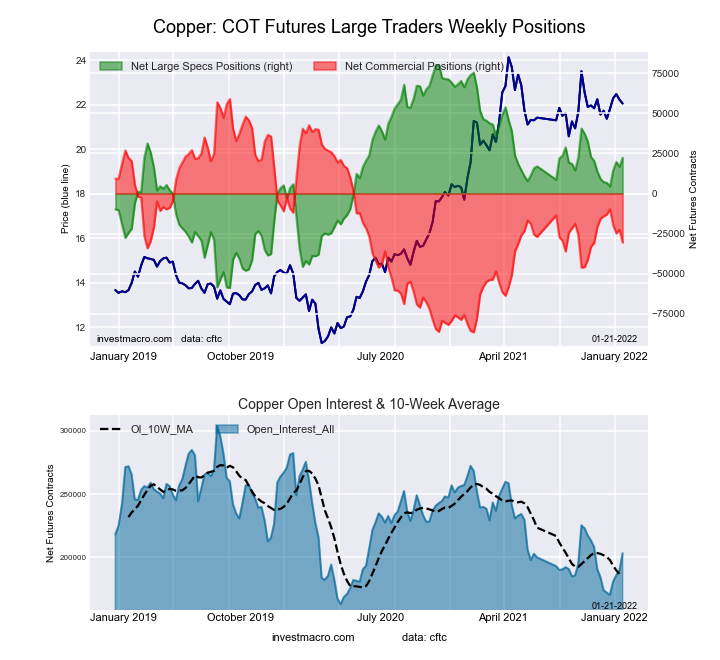 The Copper Grade #1 Futures large speculator standing this week totaled a net position of 22,310 contracts in the data reported through Tuesday. This was a weekly advance of 5,604 contracts from the previous week which had a total of 16,706 net contracts.
This week’s current strength score (the trader positioning range over the past three years, measured from 0 to 100) shows the speculators are currently Bullish with a score of 58.4 percent. The commercials are Bearish with a score of 38.5 percent and the small traders (not shown in chart) are Bullish with a score of 72.9 percent.
| Copper Futures Statistics | SPECULATORS | COMMERCIALS | SMALL TRADERS |
| – Percent of Open Interest Longs: | 38.2 | 39.1 | 9.3 |
| – Percent of Open Interest Shorts: | 27.2 | 54.1 | 5.3 |
| – Net Position: | 22,310 | -30,538 | 8,228 |
| – Gross Longs: | 77,673 | 79,455 | 18,943 |
| – Gross Shorts: | 55,363 | 109,993 | 10,715 |
| – Long to Short Ratio: | 1.4 to 1 | 0.7 to 1 | 1.8 to 1 |
| NET POSITION TREND: | |||
| – Strength Index Score (3 Year Range Pct): | 58.4 | 38.5 | 72.9 |
| – Strength Index Reading (3 Year Range): | Bullish | Bearish | Bullish |
| NET POSITION MOVEMENT INDEX: | |||
| – 6-Week Change in Strength Index: | 10.9 | -11.2 | 7.0 |
Platinum Futures:
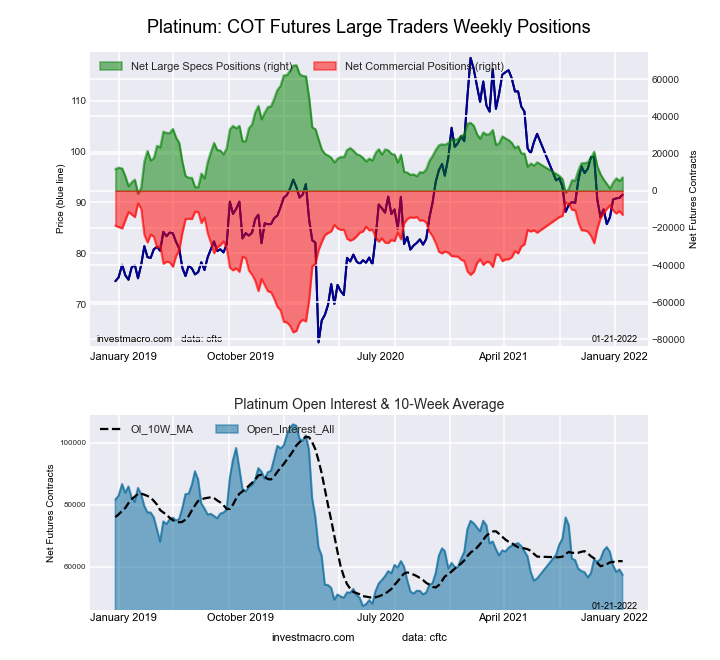 The Platinum Futures large speculator standing this week totaled a net position of 7,229 contracts in the data reported through Tuesday. This was a weekly increase of 1,940 contracts from the previous week which had a total of 5,289 net contracts.
This week’s current strength score (the trader positioning range over the past three years, measured from 0 to 100) shows the speculators are currently Bearish-Extreme with a score of 12.8 percent. The commercials are Bullish-Extreme with a score of 90.6 percent and the small traders (not shown in chart) are Bearish with a score of 41.3 percent.
| Platinum Futures Statistics | SPECULATORS | COMMERCIALS | SMALL TRADERS |
| – Percent of Open Interest Longs: | 47.6 | 33.2 | 15.6 |
| – Percent of Open Interest Shorts: | 35.0 | 55.7 | 5.7 |
| – Net Position: | 7,229 | -12,911 | 5,682 |
| – Gross Longs: | 27,304 | 19,007 | 8,945 |
| – Gross Shorts: | 20,075 | 31,918 | 3,263 |
| – Long to Short Ratio: | 1.4 to 1 | 0.6 to 1 | 2.7 to 1 |
| NET POSITION TREND: | |||
| – Strength Index Score (3 Year Range Pct): | 12.8 | 90.6 | 41.3 |
| – Strength Index Reading (3 Year Range): | Bearish-Extreme | Bullish-Extreme | Bearish |
| NET POSITION MOVEMENT INDEX: | |||
| – 6-Week Change in Strength Index: | 1.7 | -1.1 | -5.5 |
Palladium Futures:
 The Palladium Futures large speculator standing this week totaled a net position of -3,309 contracts in the data reported through Tuesday. This was a weekly decrease of -331 contracts from the previous week which had a total of -2,978 net contracts.
This week’s current strength score (the trader positioning range over the past three years, measured from 0 to 100) shows the speculators are currently Bearish-Extreme with a score of 2.5 percent. The commercials are Bullish-Extreme with a score of 96.2 percent and the small traders (not shown in chart) are Bearish with a score of 38.8 percent.
| Palladium Futures Statistics | SPECULATORS | COMMERCIALS | SMALL TRADERS |
| – Percent of Open Interest Longs: | 28.6 | 56.8 | 13.6 |
| – Percent of Open Interest Shorts: | 63.9 | 20.4 | 14.7 |
| – Net Position: | -3,309 | 3,409 | -100 |
| – Gross Longs: | 2,682 | 5,323 | 1,275 |
| – Gross Shorts: | 5,991 | 1,914 | 1,375 |
| – Long to Short Ratio: | 0.4 to 1 | 2.8 to 1 | 0.9 to 1 |
| NET POSITION TREND: | |||
| – Strength Index Score (3 Year Range Pct): | 2.5 | 96.2 | 38.8 |
| – Strength Index Reading (3 Year Range): | Bearish-Extreme | Bullish-Extreme | Bearish |
| NET POSITION MOVEMENT INDEX: | |||
| – 6-Week Change in Strength Index: | -3.2 | 2.0 | 12.1 |
Article By InvestMacro – Receive our weekly COT Reports by Email
*COT Report: The COT data, released weekly to the public each Friday, is updated through the most recent Tuesday (data is 3 days old) and shows a quick view of how large speculators or non-commercials (for-profit traders) were positioned in the futures markets.
The CFTC categorizes trader positions according to commercial hedgers (traders who use futures contracts for hedging as part of the business), non-commercials (large traders who speculate to realize trading profits) and nonreportable traders (usually small traders/speculators) as well as their open interest (contracts open in the market at time of reporting).See CFTC criteria here.

- COT Metals Charts: Weekly Speculator Bets led by Copper & Steel Jul 18, 2026
- COT Bonds Charts: Weekly Speculator Bets led by 2-Year, SOFR 3M & 5-Year Bonds Jul 18, 2026
- COT Energy Charts: Weekly Speculator Bets led by Brent Oil & Heating Oil Jul 18, 2026
- COT Soft Commodities Charts: Weekly Speculator Bets led by Wheat, Corn & Soybean Meal Jul 18, 2026
- The Bank of Canada kept its interest rate unchanged. Platinum prices reached a three‑week high Jul 16, 2026
- Stock indices rose after the release of US inflation data. China’s GDP slowed sharply Jul 15, 2026
- GBP/USD Awaits Political News: What Will Happen Next Jul 15, 2026
- USD/JPY Holds at Highs: Pressure Lingers on Yen Jul 14, 2026
- Oil prices jumped 4% amid a new wave of escalation between the US and Iran Jul 13, 2026
- EUR/USD: US Inflation Will Determine Everything Jul 13, 2026