
By InvestMacro

Here are the latest charts and statistics for the Commitment of Traders (COT) data published by the Commodities Futures Trading Commission (CFTC).
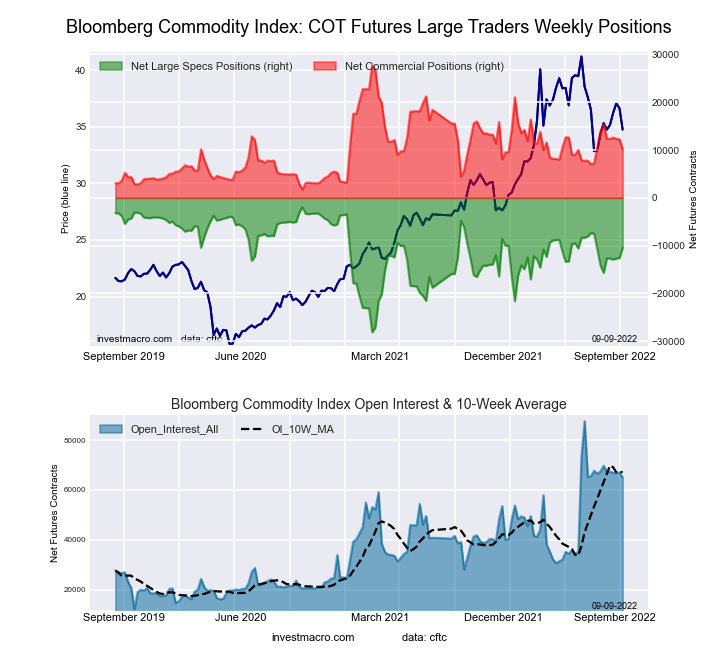
The latest COT data is updated through Tuesday September 13th and shows a quick view of how large traders (for-profit speculators and commercial entities) were positioned in the futures markets.
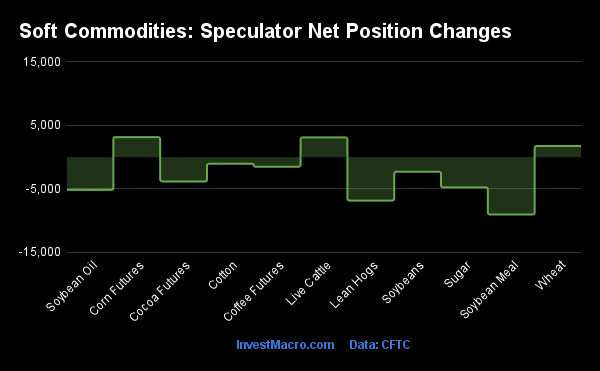
Weekly Speculator Changes led higher by Soybeans, Sugar and Corn
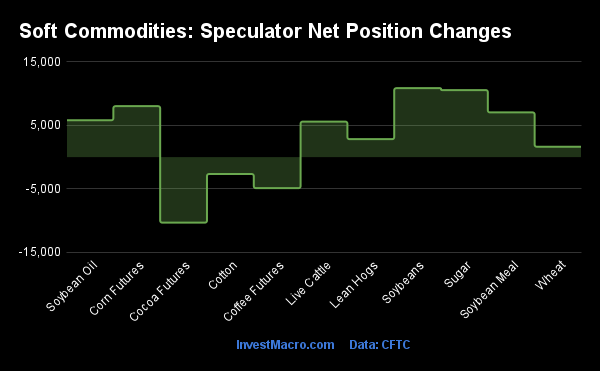
COT soft commodities speculator bets were mostly higher this week as eight out of the eleven soft commodities markets we cover had higher positioning this week while XX markets had lower contracts.
Leading the gains for soft commodities markets was Soybeans (10,859 contracts) and Sugar (10,559 contracts) with Corn (8,022 contracts), Soybean Meal (7,042 contracts), Soybean Oil (5,799 contracts), Live Cattle (5,590 contracts), Lean Hogs (2,821 contracts) and Wheat (1,631 contracts) also showing a positive weeks.
The softs markets leading the declines in speculator bets this week were Cocoa (-10,338 contracts) and Coffee (-4,901 contracts) with Cotton (-2,672 contracts) also registering lower bets on the week.
| Sep-13-2022 | OI | OI-Index | Spec-Net | Spec-Index | Com-Net | COM-Index | Smalls-Net | Smalls-Index |
|---|---|---|---|---|---|---|---|---|
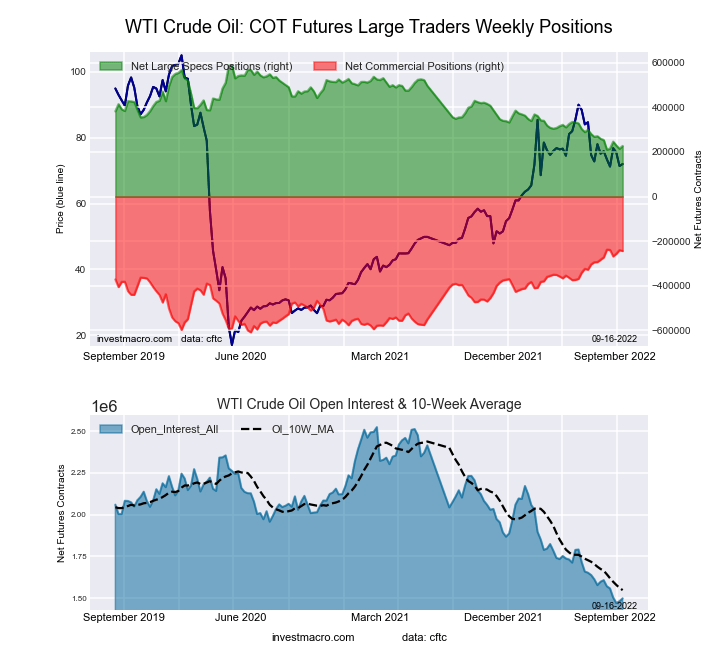
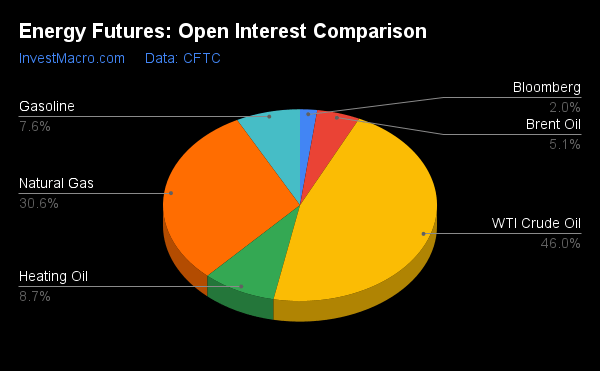
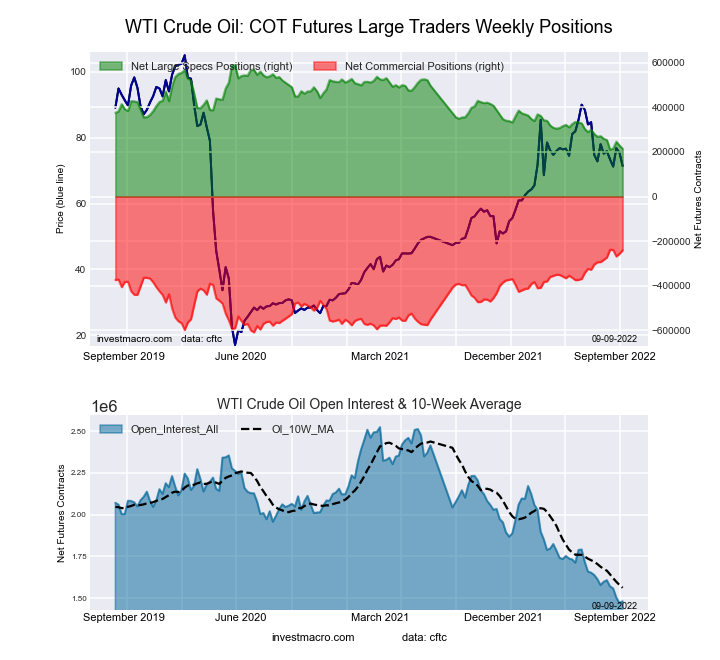
| WTI Crude | 1,498,059 | 3 | 227,057 | 4 | -244,007 | 98 | 16,950 | 28 |
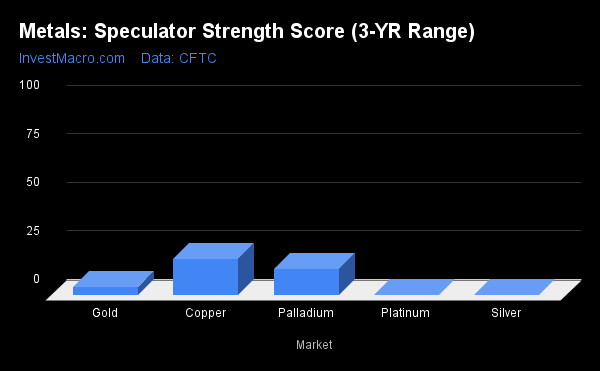
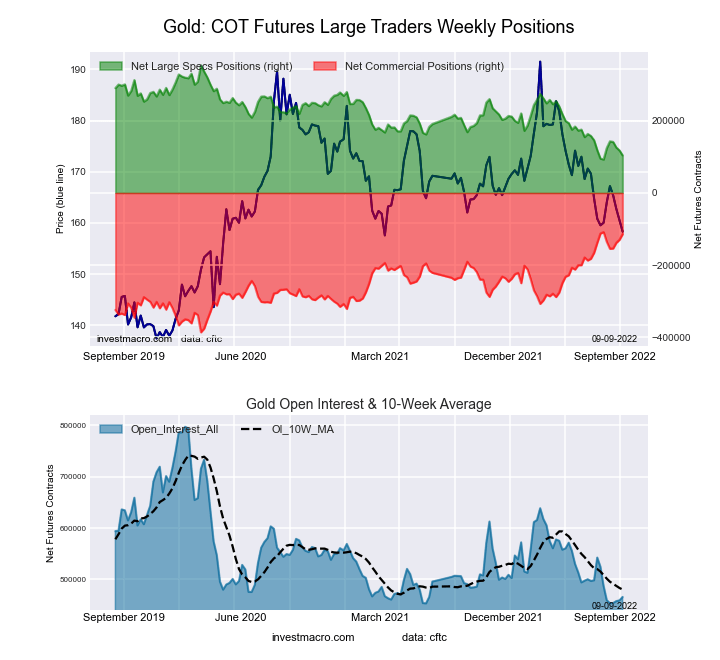
| Gold | 463,674 | 3 | 97,344 | 2 | -110,938 | 99 | 13,594 | 9 |
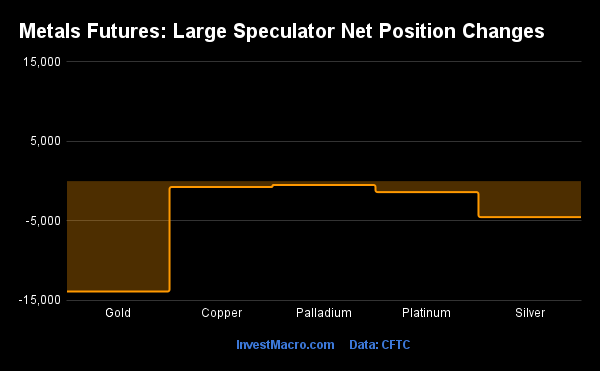
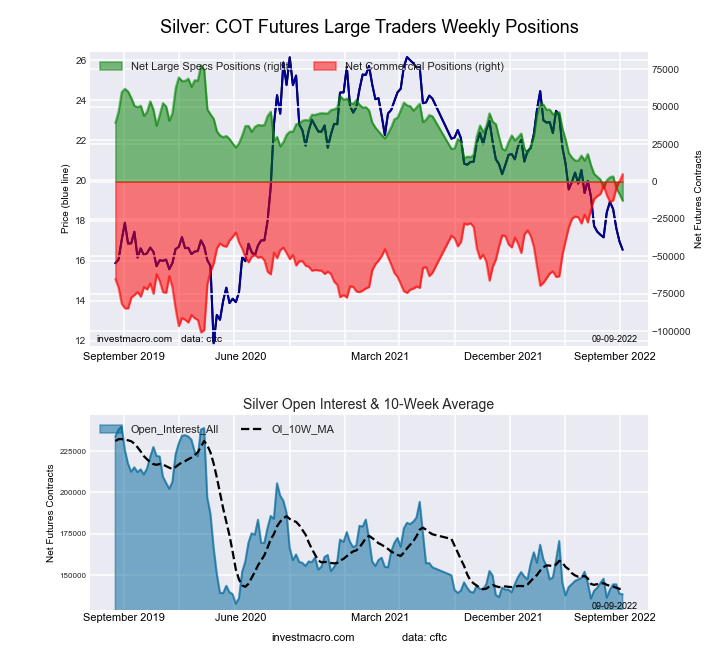
| Silver | 135,530 | 3 | -4,640 | 9 | -2,551 | 93 | 7,191 | 4 |
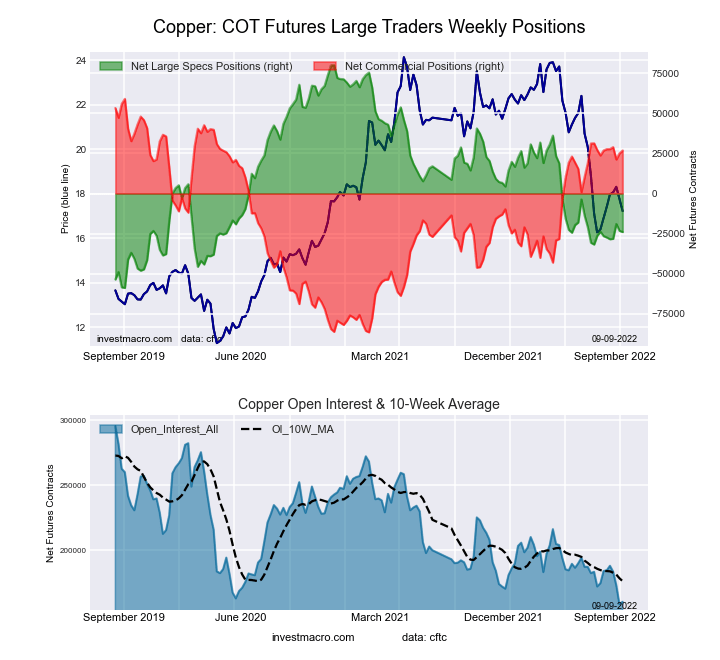
| Copper | 157,900 | 0 | -18,986 | 23 | 20,512 | 80 | -1,526 | 16 |
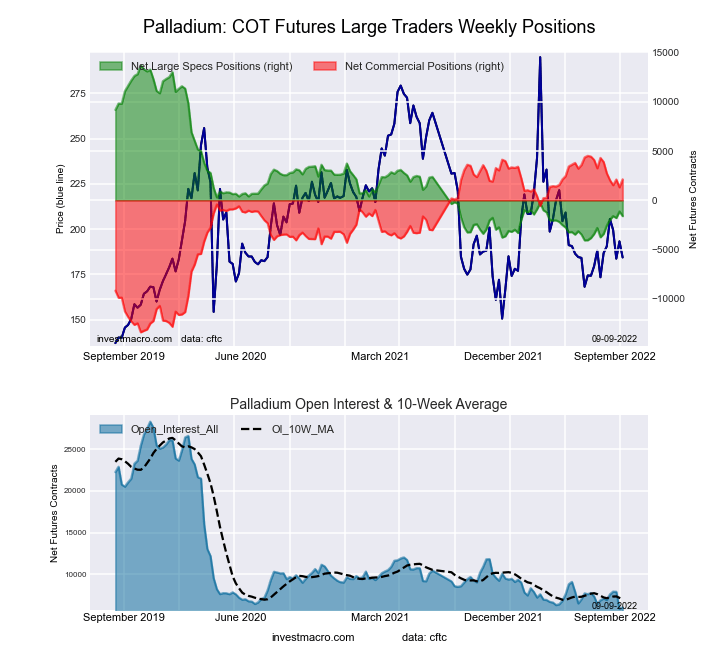
| Palladium | 6,085 | 1 | -1,273 | 16 | 1,455 | 83 | -182 | 33 |
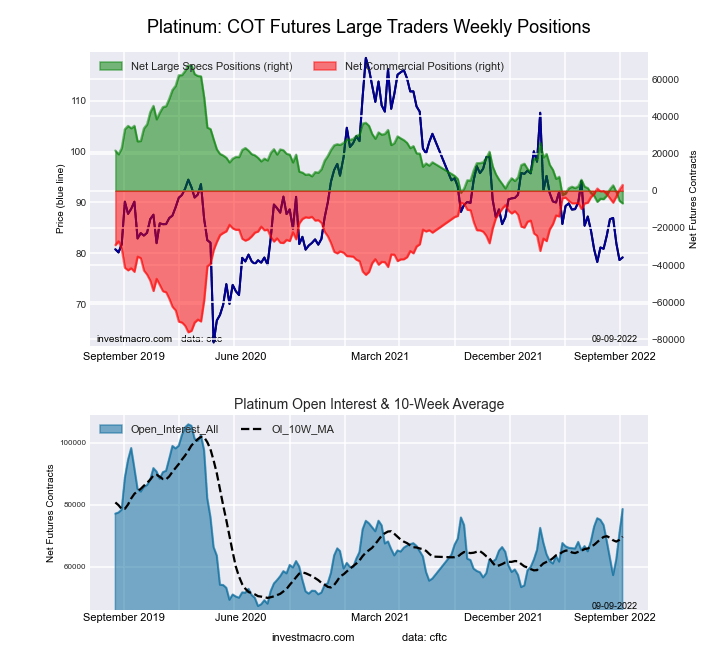
| Platinum | 68,574 | 36 | -1,879 | 7 | -2,051 | 93 | 3,930 | 17 |
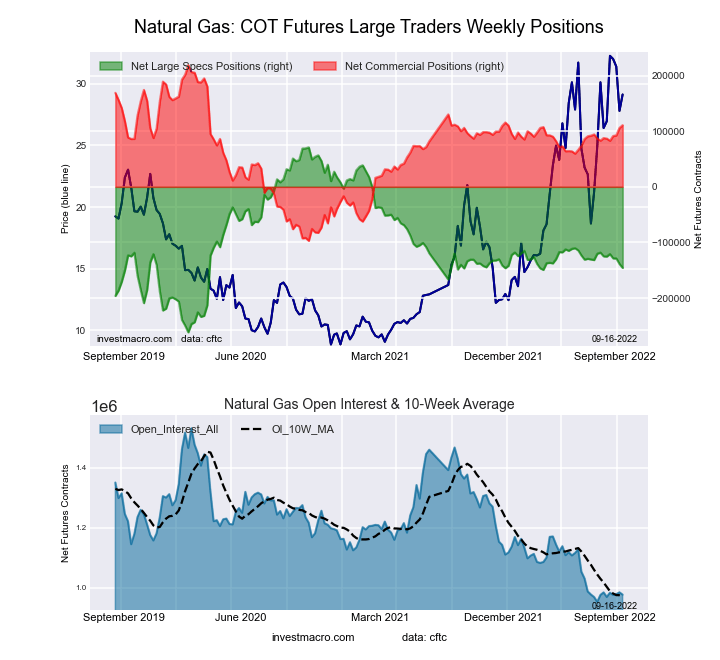
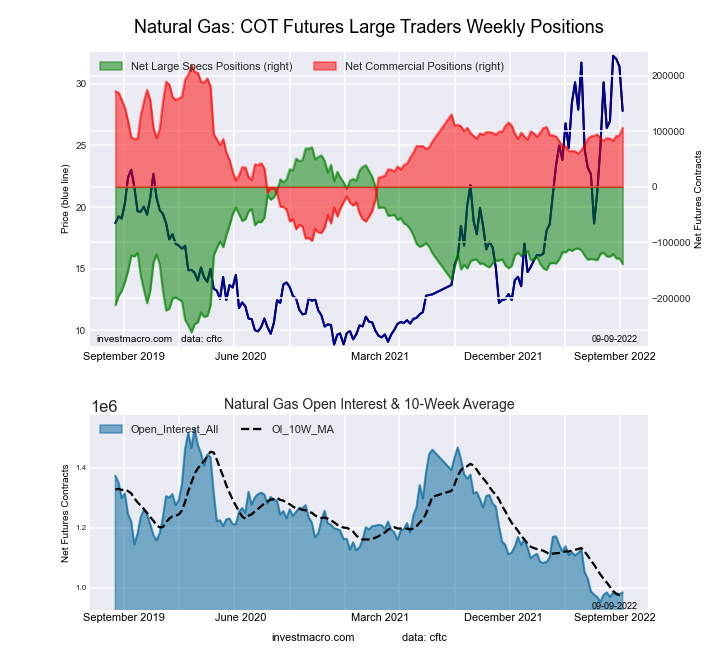
| Natural Gas | 977,116 | 4 | -145,715 | 35 | 110,794 | 66 | 34,921 | 63 |
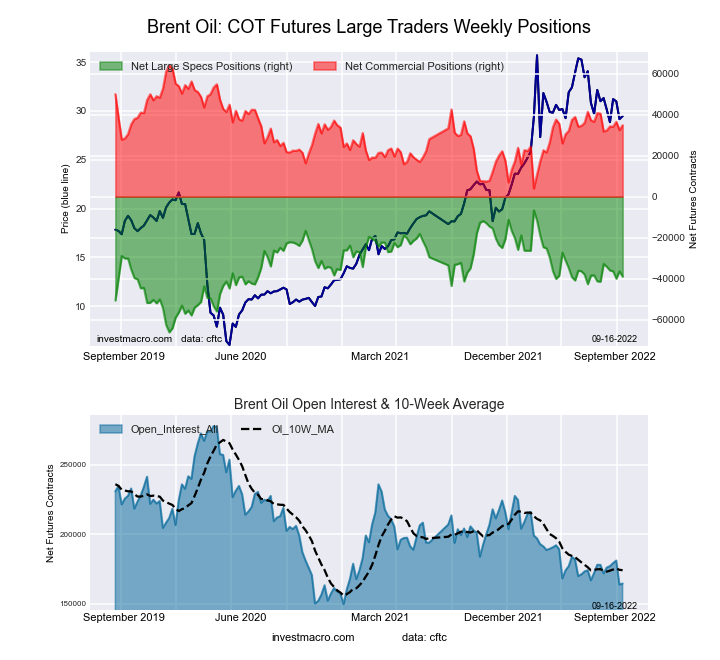
| Brent | 164,415 | 12 | -39,023 | 46 | 34,919 | 51 | 4,104 | 65 |
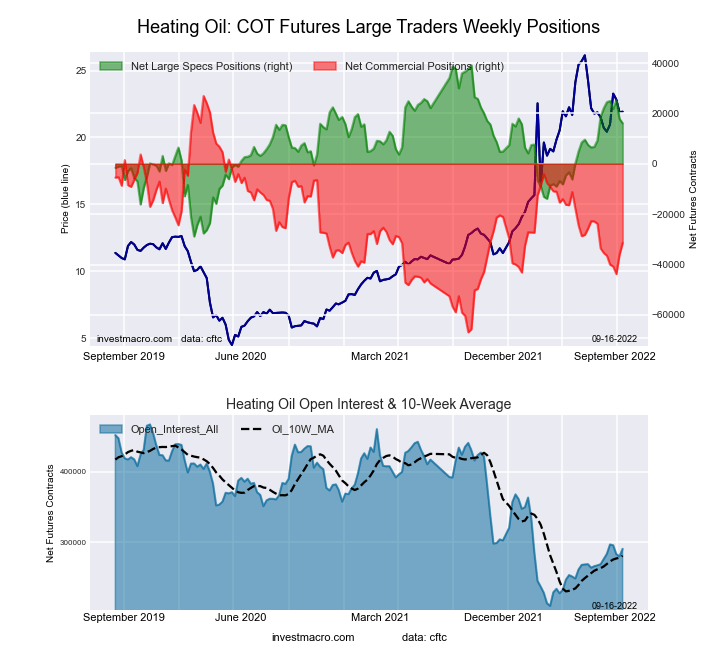
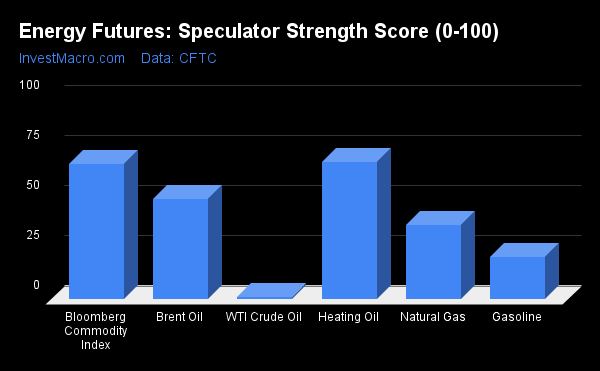
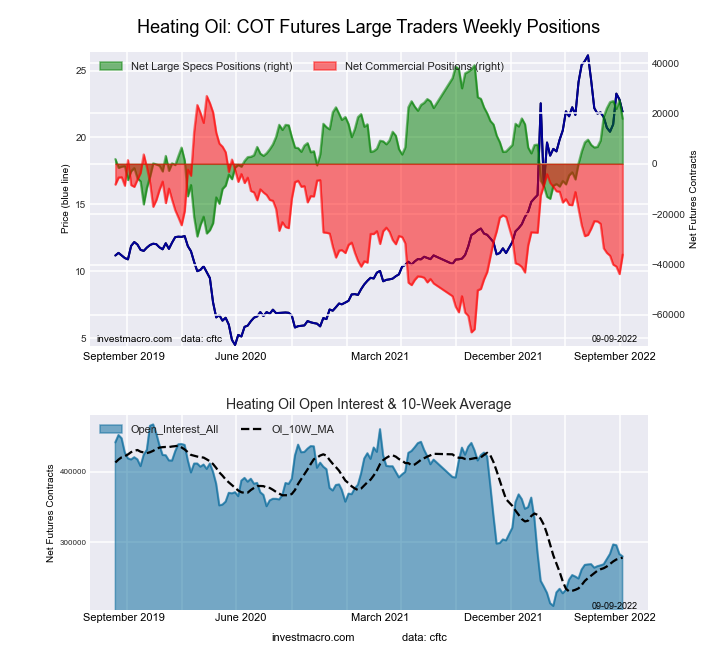
| Heating Oil | 290,916 | 31 | 16,064 | 66 | -31,353 | 38 | 15,289 | 51 |
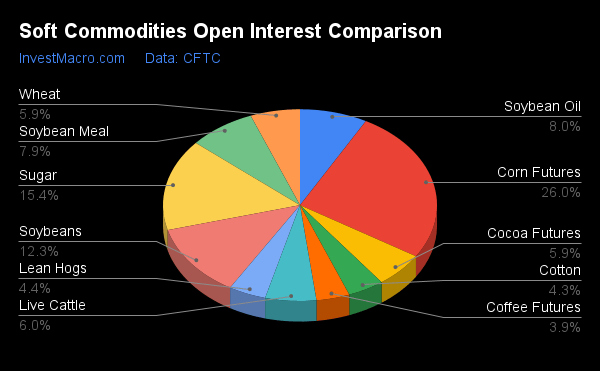
| Soybeans | 643,018 | 15 | 92,110 | 42 | -61,424 | 68 | -30,686 | 19 |
| Corn | 1,310,411 | 6 | 294,569 | 68 | -234,179 | 39 | -60,390 | 8 |
| Coffee | 197,657 | 10 | 42,267 | 75 | -44,360 | 29 | 2,093 | 19 |
| Sugar | 751,873 | 9 | 68,330 | 51 | -79,426 | 53 | 11,096 | 22 |
| Wheat | 287,046 | 0 | -8,128 | 8 | 12,977 | 78 | -4,849 | 85 |
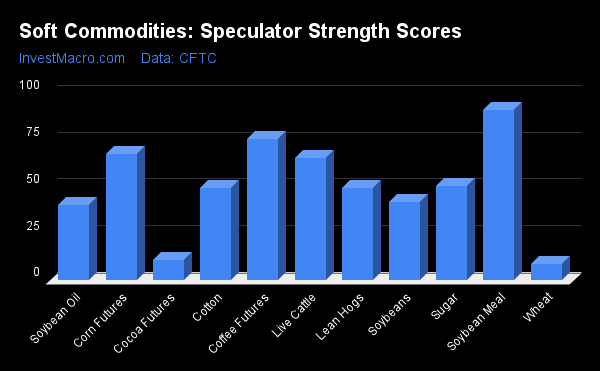
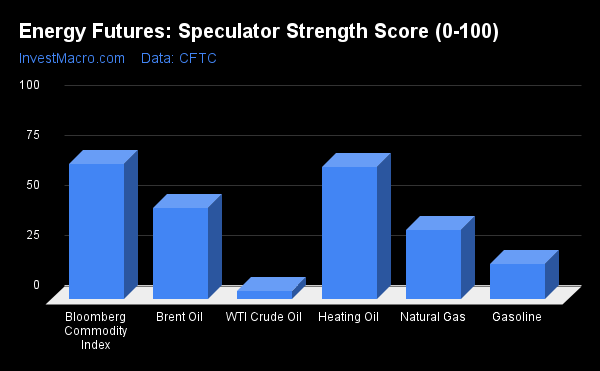
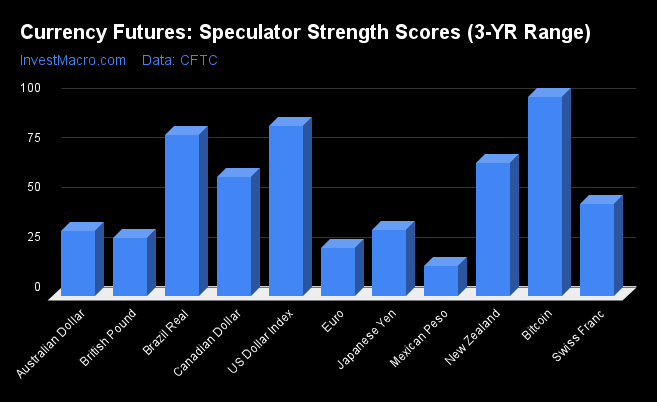
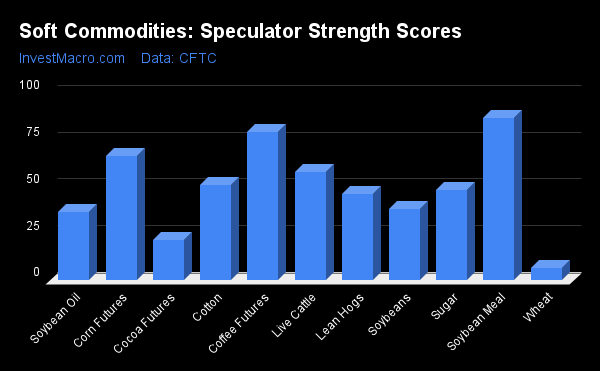
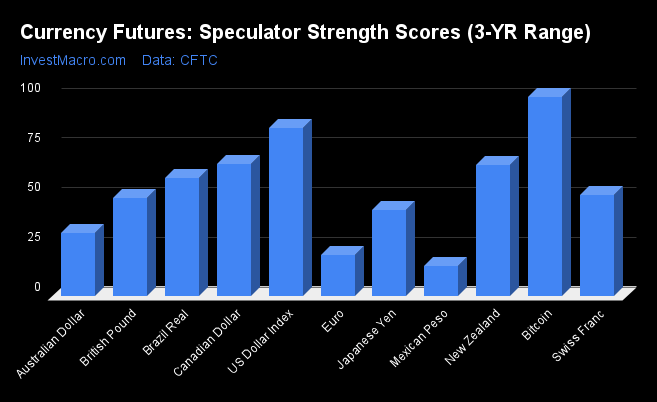
Strength Scores
Strength Scores (a normalized measure of Speculator positions over a 3-Year range, from 0 to 100 where above 80 is extreme bullish and below 20 is extreme bearish) showed that Soybean Meal (91.0 percent) leads the soft commodity markets and is in a bullish extreme position (above 80 percent). Coffee (75.4 percent) and Corn (67.7 percent) come in as the next highest soft commodity markets in strength scores.
On the downside, Wheat (8.5 percent) and Cocoa (11.0 percent) come in as the lowest strength scores are both in bearish extreme levels (below 20 percent).
Strength Statistics:
Corn (67.7 percent) vs Corn previous week (66.6 percent)
Sugar (50.7 percent) vs Sugar previous week (48.5 percent)
Coffee (75.4 percent) vs Coffee previous week (79.6 percent)
Soybeans (41.7 percent) vs Soybeans previous week (38.3 percent)
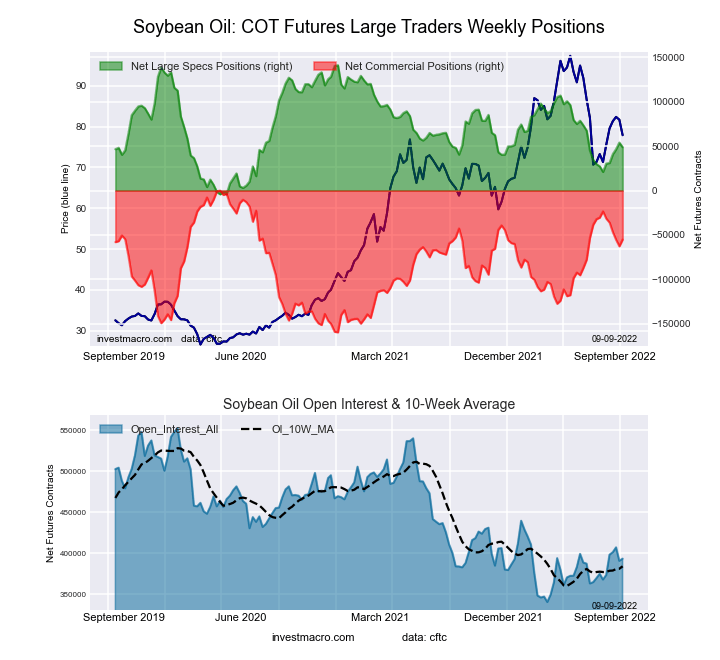
Soybean Oil (40.4 percent) vs Soybean Oil previous week (36.4 percent)
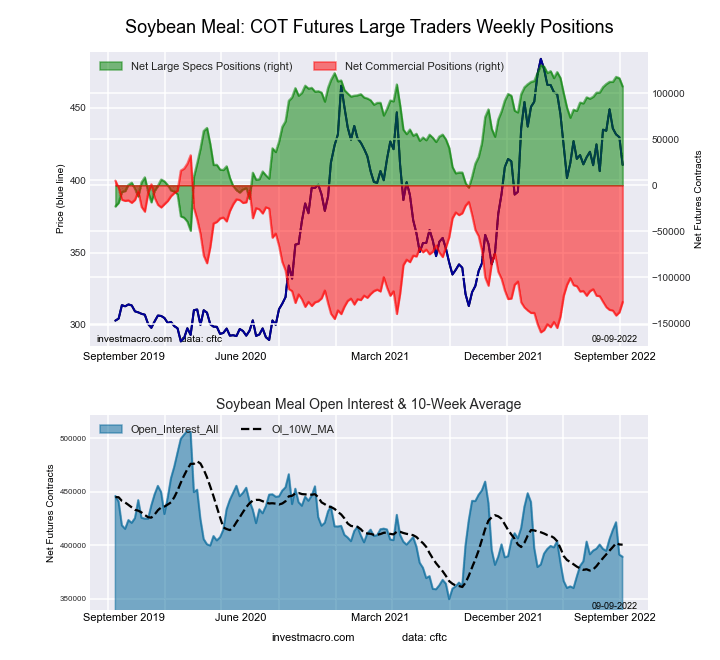
Soybean Meal (91.0 percent) vs Soybean Meal previous week (87.1 percent)
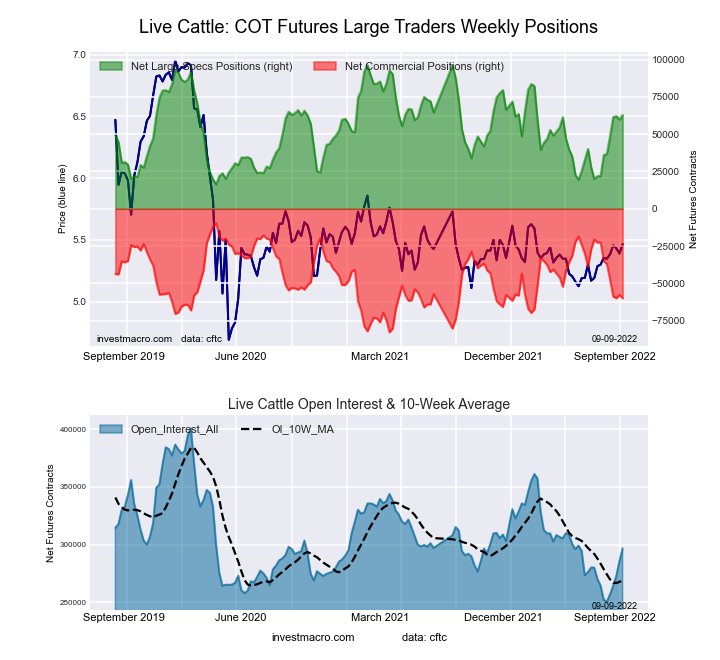
Live Cattle (65.2 percent) vs Live Cattle previous week (58.1 percent)
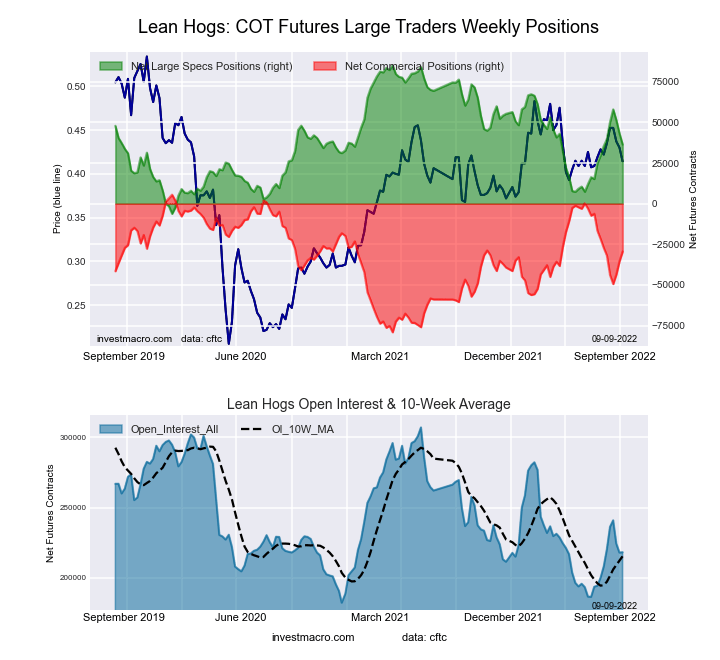
Lean Hogs (49.4 percent) vs Lean Hogs previous week (46.3 percent)
Cotton (49.3 percent) vs Cotton previous week (51.2 percent)
Cocoa (11.0 percent) vs Cocoa previous week (21.3 percent)
Wheat (8.5 percent) vs Wheat previous week (6.4 percent)
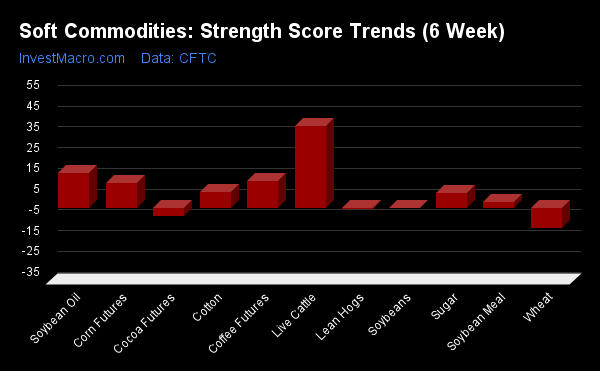
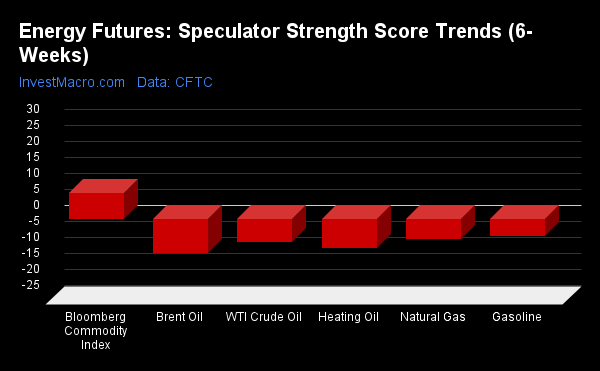
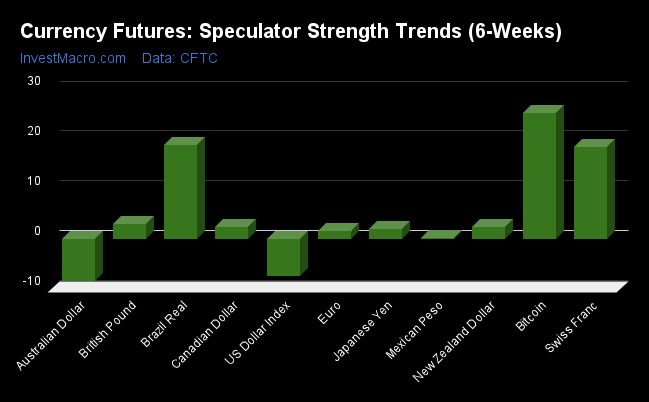
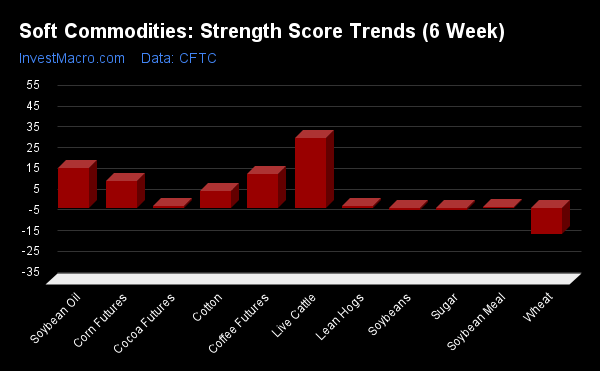
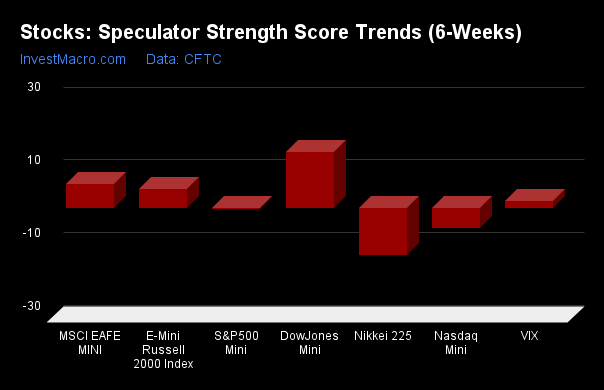
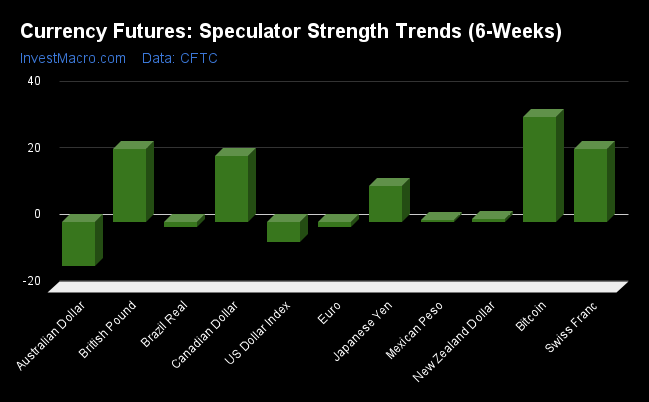
Strength Trends
Strength Score Trends (or move index, calculates the 6-week changes in strength scores) show that Live Cattle (39.5 percent) leads the past six weeks trends for soft commodity markets this week. Soybean Oil (16.6 percent), Coffee (13.0 percent) and Corn (11.9 percent) fill out the next highest top movers in the latest trends data.
Wheat (-9.6 percent) leads the downside trend scores currently while the next market with lower trend scores was Cocoa (-3.9 percent) followed by Lean Hogs (-0.6 percent) and Soybeans (-0.1 percent).
Strength Trend Statistics:
Corn (11.9 percent) vs Corn previous week (12.8 percent)
Sugar (7.0 percent) vs Sugar previous week (-1.3 percent)
Coffee (13.0 percent) vs Coffee previous week (16.0 percent)
Soybeans (-0.1 percent) vs Soybeans previous week (-1.2 percent)
Soybean Oil (16.6 percent) vs Soybean Oil previous week (19.1 percent)
Soybean Meal (2.5 percent) vs Soybean Meal previous week (0.3 percent)
Live Cattle (39.5 percent) vs Live Cattle previous week (33.7 percent)
Lean Hogs (-0.6 percent) vs Lean Hogs previous week (1.0 percent)
Cotton (7.5 percent) vs Cotton previous week (8.0 percent)
Cocoa (-3.9 percent) vs Cocoa previous week (1.0 percent)
Wheat (-9.6 percent) vs Wheat previous week (-12.7 percent)
Individual Markets:
CORN Futures:
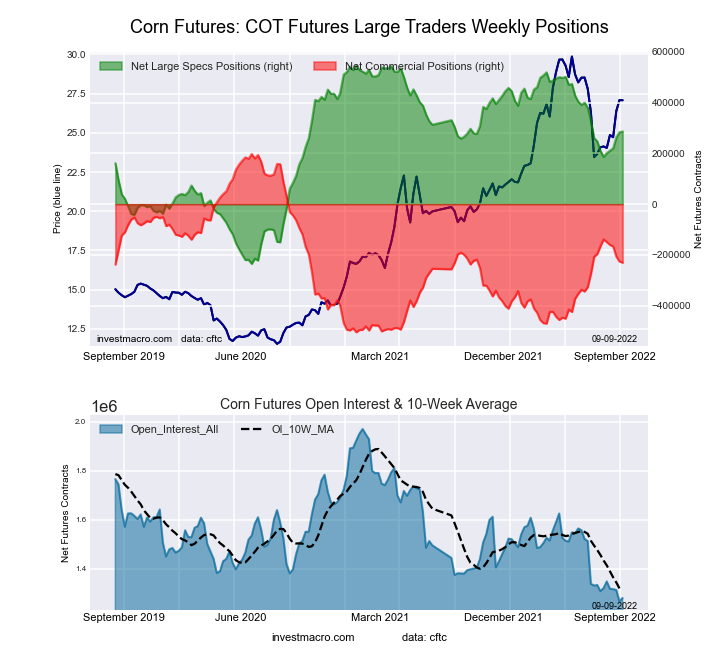
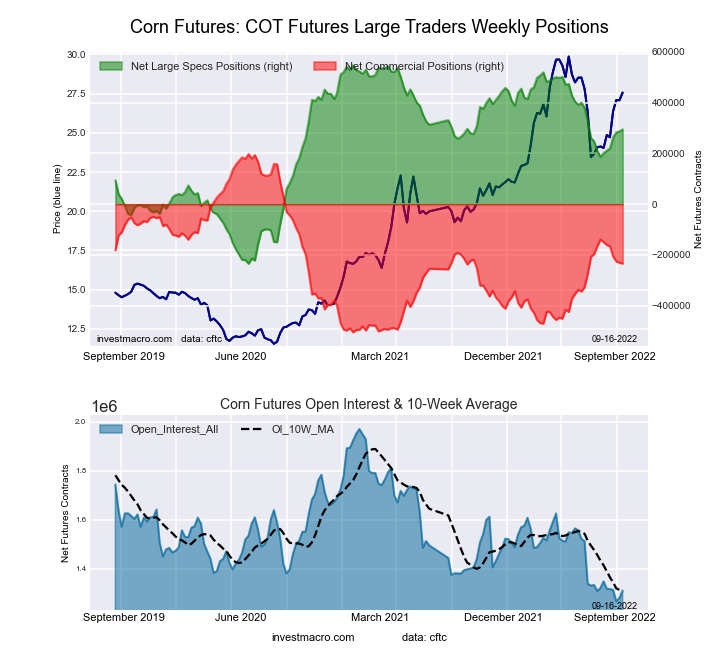 The CORN large speculator standing this week reached a net position of 294,569 contracts in the data reported through Tuesday. This was a weekly boost of 8,022 contracts from the previous week which had a total of 286,547 net contracts.
This week’s current strength score (the trader positioning range over the past three years, measured from 0 to 100) shows the speculators are currently Bullish with a score of 67.7 percent. The commercials are Bearish with a score of 38.5 percent and the small traders (not shown in chart) are Bearish-Extreme with a score of 8.3 percent.
| CORN Futures Statistics | SPECULATORS | COMMERCIALS | SMALL TRADERS |
| – Percent of Open Interest Longs: | 32.4 | 44.9 | 8.9 |
| – Percent of Open Interest Shorts: | 9.9 | 62.8 | 13.5 |
| – Net Position: | 294,569 | -234,179 | -60,390 |
| – Gross Longs: | 424,311 | 588,143 | 116,795 |
| – Gross Shorts: | 129,742 | 822,322 | 177,185 |
| – Long to Short Ratio: | 3.3 to 1 | 0.7 to 1 | 0.7 to 1 |
| NET POSITION TREND: | |||
| – Strength Index Score (3 Year Range Pct): | 67.7 | 38.5 | 8.3 |
| – Strength Index Reading (3 Year Range): | Bullish | Bearish | Bearish-Extreme |
| NET POSITION MOVEMENT INDEX: | |||
| – 6-Week Change in Strength Index: | 11.9 | -12.1 | -4.9 |
SUGAR Futures:
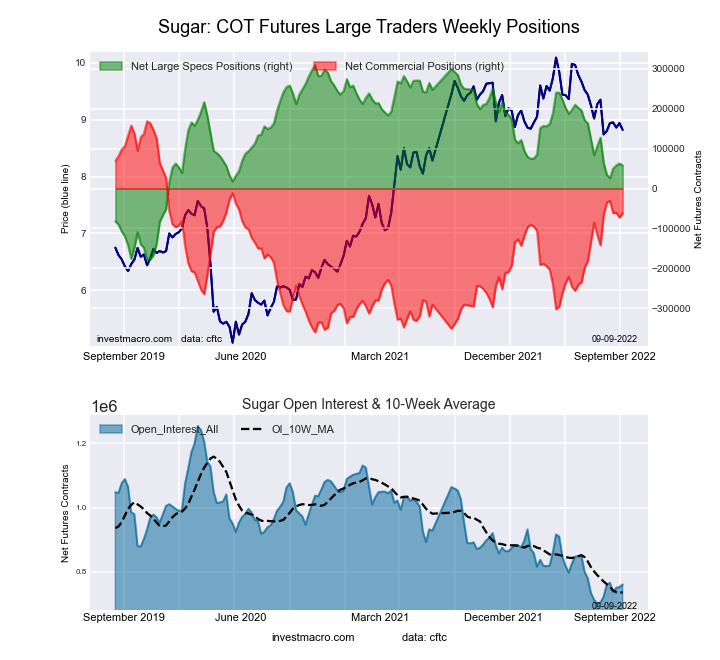
 The SUGAR large speculator standing this week reached a net position of 68,330 contracts in the data reported through Tuesday. This was a weekly boost of 10,559 contracts from the previous week which had a total of 57,771 net contracts.
This week’s current strength score (the trader positioning range over the past three years, measured from 0 to 100) shows the speculators are currently Bullish with a score of 50.7 percent. The commercials are Bullish with a score of 53.1 percent and the small traders (not shown in chart) are Bearish with a score of 21.6 percent.
| SUGAR Futures Statistics | SPECULATORS | COMMERCIALS | SMALL TRADERS |
| – Percent of Open Interest Longs: | 24.3 | 54.1 | 9.0 |
| – Percent of Open Interest Shorts: | 15.2 | 64.6 | 7.5 |
| – Net Position: | 68,330 | -79,426 | 11,096 |
| – Gross Longs: | 182,761 | 406,409 | 67,735 |
| – Gross Shorts: | 114,431 | 485,835 | 56,639 |
| – Long to Short Ratio: | 1.6 to 1 | 0.8 to 1 | 1.2 to 1 |
| NET POSITION TREND: | |||
| – Strength Index Score (3 Year Range Pct): | 50.7 | 53.1 | 21.6 |
| – Strength Index Reading (3 Year Range): | Bullish | Bullish | Bearish |
| NET POSITION MOVEMENT INDEX: | |||
| – 6-Week Change in Strength Index: | 7.0 | -8.4 | 12.7 |
COFFEE Futures:
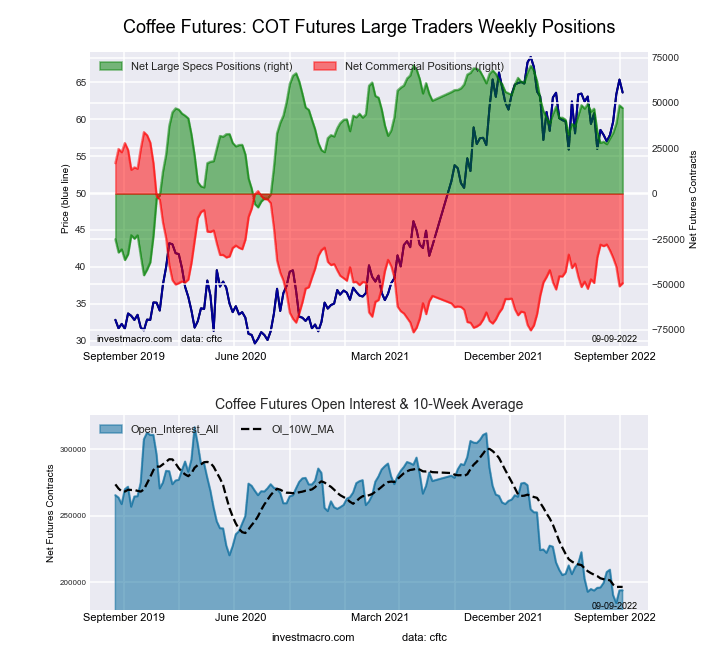
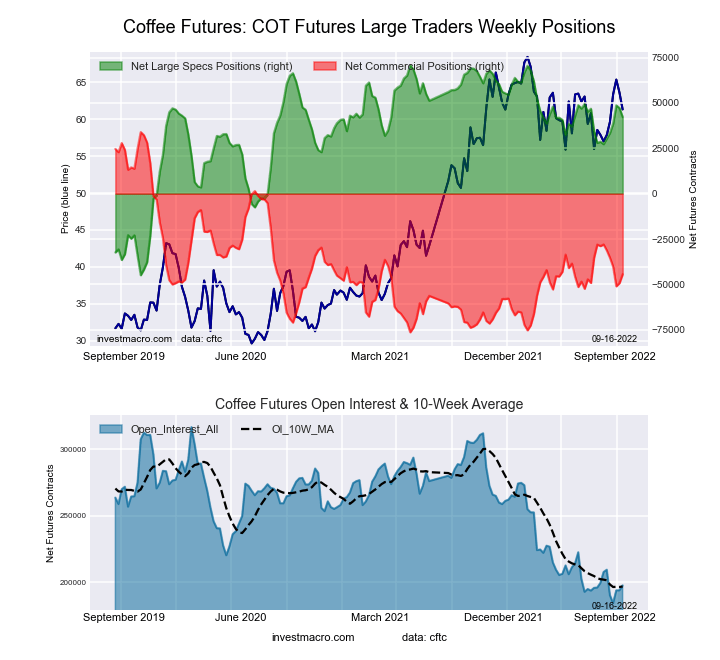 The COFFEE large speculator standing this week reached a net position of 42,267 contracts in the data reported through Tuesday. This was a weekly decrease of -4,901 contracts from the previous week which had a total of 47,168 net contracts.
This week’s current strength score (the trader positioning range over the past three years, measured from 0 to 100) shows the speculators are currently Bullish with a score of 75.4 percent. The commercials are Bearish with a score of 29.0 percent and the small traders (not shown in chart) are Bearish-Extreme with a score of 18.7 percent.
| COFFEE Futures Statistics | SPECULATORS | COMMERCIALS | SMALL TRADERS |
| – Percent of Open Interest Longs: | 27.7 | 47.4 | 4.7 |
| – Percent of Open Interest Shorts: | 6.3 | 69.8 | 3.6 |
| – Net Position: | 42,267 | -44,360 | 2,093 |
| – Gross Longs: | 54,749 | 93,613 | 9,237 |
| – Gross Shorts: | 12,482 | 137,973 | 7,144 |
| – Long to Short Ratio: | 4.4 to 1 | 0.7 to 1 | 1.3 to 1 |
| NET POSITION TREND: | |||
| – Strength Index Score (3 Year Range Pct): | 75.4 | 29.0 | 18.7 |
| – Strength Index Reading (3 Year Range): | Bullish | Bearish | Bearish-Extreme |
| NET POSITION MOVEMENT INDEX: | |||
| – 6-Week Change in Strength Index: | 13.0 | -14.9 | 12.9 |
SOYBEANS Futures:
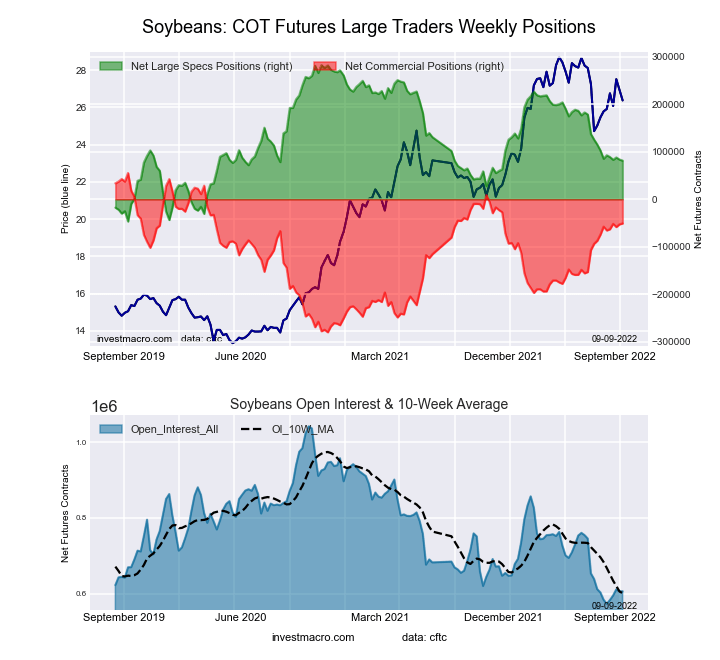
 The SOYBEANS large speculator standing this week reached a net position of 92,110 contracts in the data reported through Tuesday. This was a weekly rise of 10,859 contracts from the previous week which had a total of 81,251 net contracts.
This week’s current strength score (the trader positioning range over the past three years, measured from 0 to 100) shows the speculators are currently Bearish with a score of 41.7 percent. The commercials are Bullish with a score of 67.8 percent and the small traders (not shown in chart) are Bearish-Extreme with a score of 19.2 percent.
| SOYBEANS Futures Statistics | SPECULATORS | COMMERCIALS | SMALL TRADERS |
| – Percent of Open Interest Longs: | 25.4 | 54.2 | 6.3 |
| – Percent of Open Interest Shorts: | 11.1 | 63.8 | 11.0 |
| – Net Position: | 92,110 | -61,424 | -30,686 |
| – Gross Longs: | 163,326 | 348,795 | 40,216 |
| – Gross Shorts: | 71,216 | 410,219 | 70,902 |
| – Long to Short Ratio: | 2.3 to 1 | 0.9 to 1 | 0.6 to 1 |
| NET POSITION TREND: | |||
| – Strength Index Score (3 Year Range Pct): | 41.7 | 67.8 | 19.2 |
| – Strength Index Reading (3 Year Range): | Bearish | Bullish | Bearish-Extreme |
| NET POSITION MOVEMENT INDEX: | |||
| – 6-Week Change in Strength Index: | -0.1 | 1.3 | -6.4 |
SOYBEAN OIL Futures:
 The SOYBEAN OIL large speculator standing this week reached a net position of 54,581 contracts in the data reported through Tuesday. This was a weekly gain of 5,799 contracts from the previous week which had a total of 48,782 net contracts.
This week’s current strength score (the trader positioning range over the past three years, measured from 0 to 100) shows the speculators are currently Bearish with a score of 40.4 percent. The commercials are Bullish with a score of 59.7 percent and the small traders (not shown in chart) are Bullish with a score of 50.2 percent.
| SOYBEAN OIL Futures Statistics | SPECULATORS | COMMERCIALS | SMALL TRADERS |
| – Percent of Open Interest Longs: | 21.7 | 51.0 | 8.1 |
| – Percent of Open Interest Shorts: | 8.0 | 67.2 | 5.6 |
| – Net Position: | 54,581 | -64,417 | 9,836 |
| – Gross Longs: | 86,257 | 203,170 | 32,312 |
| – Gross Shorts: | 31,676 | 267,587 | 22,476 |
| – Long to Short Ratio: | 2.7 to 1 | 0.8 to 1 | 1.4 to 1 |
| NET POSITION TREND: | |||
| – Strength Index Score (3 Year Range Pct): | 40.4 | 59.7 | 50.2 |
| – Strength Index Reading (3 Year Range): | Bearish | Bullish | Bullish |
| NET POSITION MOVEMENT INDEX: | |||
| – 6-Week Change in Strength Index: | 16.6 | -20.6 | 32.1 |
SOYBEAN MEAL Futures:
 The SOYBEAN MEAL large speculator standing this week reached a net position of 114,177 contracts in the data reported through Tuesday. This was a weekly lift of 7,042 contracts from the previous week which had a total of 107,135 net contracts.
This week’s current strength score (the trader positioning range over the past three years, measured from 0 to 100) shows the speculators are currently Bullish-Extreme with a score of 91.0 percent. The commercials are Bearish-Extreme with a score of 11.3 percent and the small traders (not shown in chart) are Bullish with a score of 55.1 percent.
| SOYBEAN MEAL Futures Statistics | SPECULATORS | COMMERCIALS | SMALL TRADERS |
| – Percent of Open Interest Longs: | 33.2 | 42.3 | 12.8 |
| – Percent of Open Interest Shorts: | 3.4 | 78.2 | 6.6 |
| – Net Position: | 114,177 | -137,766 | 23,589 |
| – Gross Longs: | 127,398 | 162,437 | 48,950 |
| – Gross Shorts: | 13,221 | 300,203 | 25,361 |
| – Long to Short Ratio: | 9.6 to 1 | 0.5 to 1 | 1.9 to 1 |
| NET POSITION TREND: | |||
| – Strength Index Score (3 Year Range Pct): | 91.0 | 11.3 | 55.1 |
| – Strength Index Reading (3 Year Range): | Bullish-Extreme | Bearish-Extreme | Bullish |
| NET POSITION MOVEMENT INDEX: | |||
| – 6-Week Change in Strength Index: | 2.5 | -2.9 | 6.2 |
LIVE CATTLE Futures:
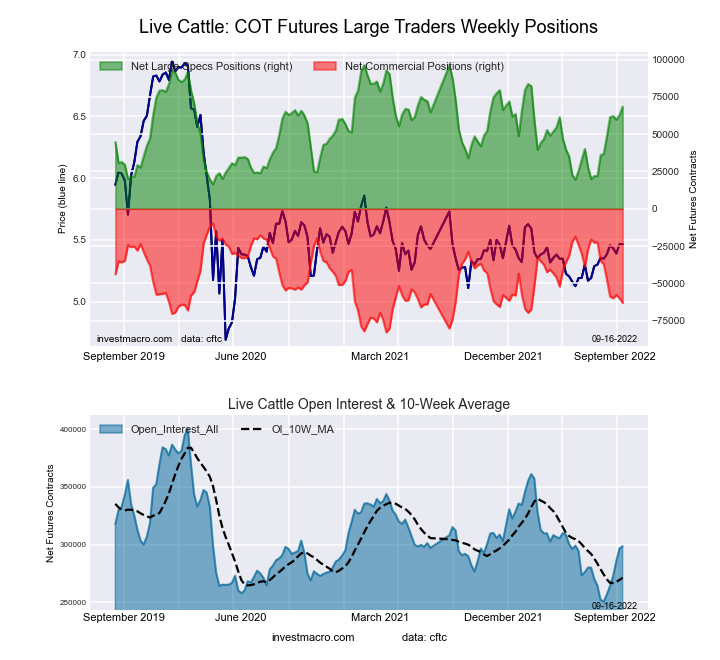 The LIVE CATTLE large speculator standing this week reached a net position of 68,420 contracts in the data reported through Tuesday. This was a weekly lift of 5,590 contracts from the previous week which had a total of 62,830 net contracts.
This week’s current strength score (the trader positioning range over the past three years, measured from 0 to 100) shows the speculators are currently Bullish with a score of 65.2 percent. The commercials are Bearish with a score of 27.0 percent and the small traders (not shown in chart) are Bullish with a score of 66.5 percent.
| LIVE CATTLE Futures Statistics | SPECULATORS | COMMERCIALS | SMALL TRADERS |
| – Percent of Open Interest Longs: | 39.0 | 32.8 | 10.7 |
| – Percent of Open Interest Shorts: | 16.1 | 53.9 | 12.5 |
| – Net Position: | 68,420 | -62,992 | -5,428 |
| – Gross Longs: | 116,375 | 97,896 | 31,907 |
| – Gross Shorts: | 47,955 | 160,888 | 37,335 |
| – Long to Short Ratio: | 2.4 to 1 | 0.6 to 1 | 0.9 to 1 |
| NET POSITION TREND: | |||
| – Strength Index Score (3 Year Range Pct): | 65.2 | 27.0 | 66.5 |
| – Strength Index Reading (3 Year Range): | Bullish | Bearish | Bullish |
| NET POSITION MOVEMENT INDEX: | |||
| – 6-Week Change in Strength Index: | 39.5 | -35.6 | -20.4 |
LEAN HOGS Futures:
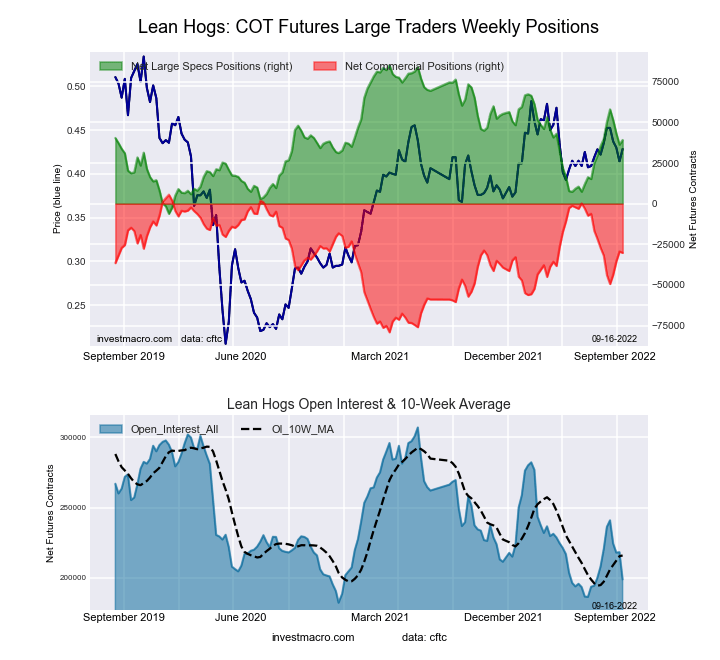 The LEAN HOGS large speculator standing this week reached a net position of 39,162 contracts in the data reported through Tuesday. This was a weekly rise of 2,821 contracts from the previous week which had a total of 36,341 net contracts.
This week’s current strength score (the trader positioning range over the past three years, measured from 0 to 100) shows the speculators are currently Bearish with a score of 49.4 percent. The commercials are Bullish with a score of 57.7 percent and the small traders (not shown in chart) are Bullish with a score of 50.3 percent.
| LEAN HOGS Futures Statistics | SPECULATORS | COMMERCIALS | SMALL TRADERS |
| – Percent of Open Interest Longs: | 38.0 | 36.7 | 9.4 |
| – Percent of Open Interest Shorts: | 18.3 | 51.9 | 13.9 |
| – Net Position: | 39,162 | -30,253 | -8,909 |
| – Gross Longs: | 75,480 | 72,966 | 18,664 |
| – Gross Shorts: | 36,318 | 103,219 | 27,573 |
| – Long to Short Ratio: | 2.1 to 1 | 0.7 to 1 | 0.7 to 1 |
| NET POSITION TREND: | |||
| – Strength Index Score (3 Year Range Pct): | 49.4 | 57.7 | 50.3 |
| – Strength Index Reading (3 Year Range): | Bearish | Bullish | Bullish |
| NET POSITION MOVEMENT INDEX: | |||
| – 6-Week Change in Strength Index: | -0.6 | 1.9 | -5.5 |
COTTON Futures:
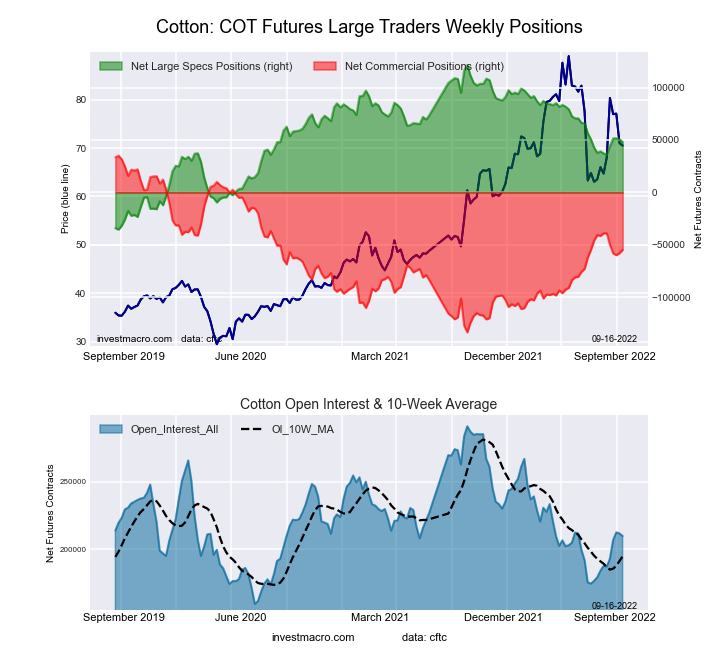 The COTTON large speculator standing this week reached a net position of 48,040 contracts in the data reported through Tuesday. This was a weekly reduction of -2,672 contracts from the previous week which had a total of 50,712 net contracts.
This week’s current strength score (the trader positioning range over the past three years, measured from 0 to 100) shows the speculators are currently Bearish with a score of 49.3 percent. The commercials are Bullish with a score of 50.6 percent and the small traders (not shown in chart) are Bullish with a score of 53.3 percent.
| COTTON Futures Statistics | SPECULATORS | COMMERCIALS | SMALL TRADERS |
| – Percent of Open Interest Longs: | 35.8 | 45.6 | 6.9 |
| – Percent of Open Interest Shorts: | 12.9 | 71.7 | 3.7 |
| – Net Position: | 48,040 | -54,685 | 6,645 |
| – Gross Longs: | 74,992 | 95,659 | 14,436 |
| – Gross Shorts: | 26,952 | 150,344 | 7,791 |
| – Long to Short Ratio: | 2.8 to 1 | 0.6 to 1 | 1.9 to 1 |
| NET POSITION TREND: | |||
| – Strength Index Score (3 Year Range Pct): | 49.3 | 50.6 | 53.3 |
| – Strength Index Reading (3 Year Range): | Bearish | Bullish | Bullish |
| NET POSITION MOVEMENT INDEX: | |||
| – 6-Week Change in Strength Index: | 7.5 | -10.2 | 31.9 |
COCOA Futures:
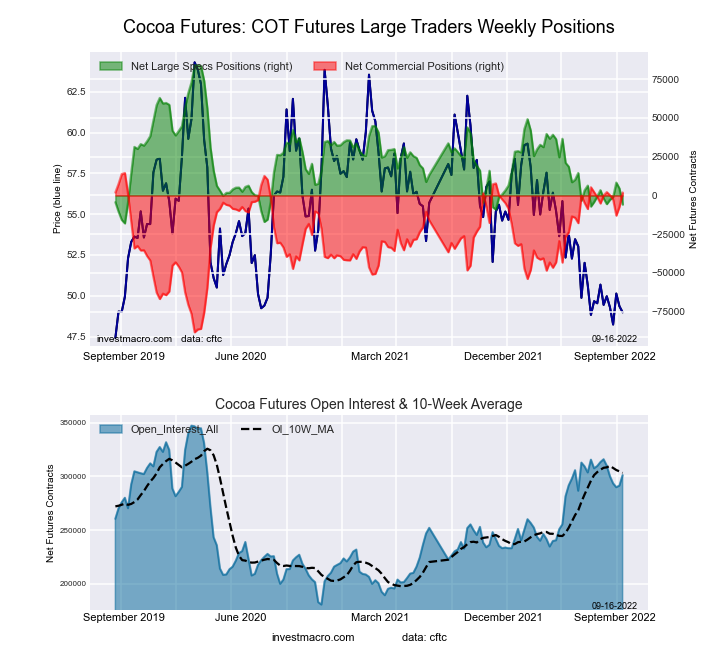 The COCOA large speculator standing this week reached a net position of -5,874 contracts in the data reported through Tuesday. This was a weekly reduction of -10,338 contracts from the previous week which had a total of 4,464 net contracts.
This week’s current strength score (the trader positioning range over the past three years, measured from 0 to 100) shows the speculators are currently Bearish-Extreme with a score of 11.0 percent. The commercials are Bullish-Extreme with a score of 89.4 percent and the small traders (not shown in chart) are Bearish with a score of 36.1 percent.
| COCOA Futures Statistics | SPECULATORS | COMMERCIALS | SMALL TRADERS |
| – Percent of Open Interest Longs: | 32.8 | 46.6 | 4.9 |
| – Percent of Open Interest Shorts: | 34.7 | 46.0 | 3.6 |
| – Net Position: | -5,874 | 1,917 | 3,957 |
| – Gross Longs: | 98,670 | 140,388 | 14,705 |
| – Gross Shorts: | 104,544 | 138,471 | 10,748 |
| – Long to Short Ratio: | 0.9 to 1 | 1.0 to 1 | 1.4 to 1 |
| NET POSITION TREND: | |||
| – Strength Index Score (3 Year Range Pct): | 11.0 | 89.4 | 36.1 |
| – Strength Index Reading (3 Year Range): | Bearish-Extreme | Bullish-Extreme | Bearish |
| NET POSITION MOVEMENT INDEX: | |||
| – 6-Week Change in Strength Index: | -3.9 | 1.8 | 20.7 |
WHEAT Futures:
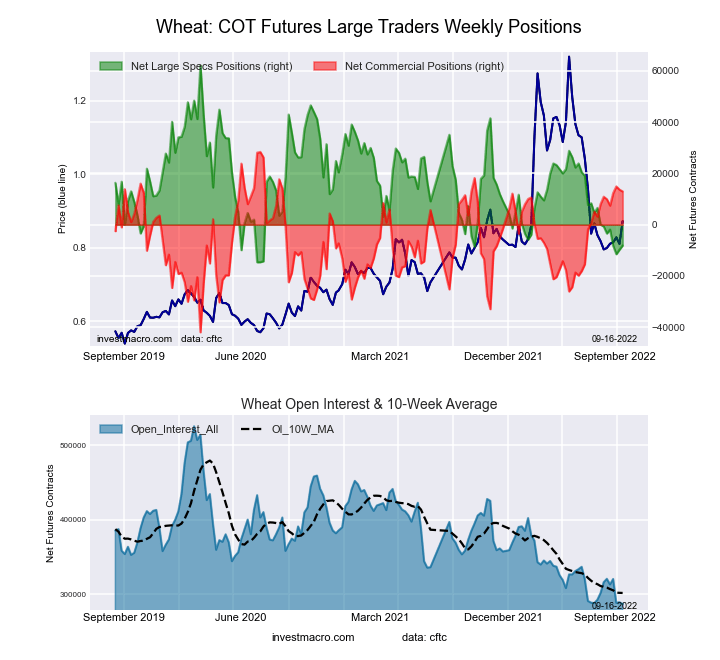 The WHEAT large speculator standing this week reached a net position of -8,128 contracts in the data reported through Tuesday. This was a weekly increase of 1,631 contracts from the previous week which had a total of -9,759 net contracts.
This week’s current strength score (the trader positioning range over the past three years, measured from 0 to 100) shows the speculators are currently Bearish-Extreme with a score of 8.5 percent. The commercials are Bullish with a score of 78.1 percent and the small traders (not shown in chart) are Bullish-Extreme with a score of 85.2 percent.
| WHEAT Futures Statistics | SPECULATORS | COMMERCIALS | SMALL TRADERS |
| – Percent of Open Interest Longs: | 30.7 | 41.5 | 9.8 |
| – Percent of Open Interest Shorts: | 33.5 | 37.0 | 11.5 |
| – Net Position: | -8,128 | 12,977 | -4,849 |
| – Gross Longs: | 88,091 | 119,219 | 28,202 |
| – Gross Shorts: | 96,219 | 106,242 | 33,051 |
| – Long to Short Ratio: | 0.9 to 1 | 1.1 to 1 | 0.9 to 1 |
| NET POSITION TREND: | |||
| – Strength Index Score (3 Year Range Pct): | 8.5 | 78.1 | 85.2 |
| – Strength Index Reading (3 Year Range): | Bearish-Extreme | Bullish | Bullish-Extreme |
| NET POSITION MOVEMENT INDEX: | |||
| – 6-Week Change in Strength Index: | -9.6 | 3.0 | 27.6 |
Article By InvestMacro – Receive our weekly COT Reports by Email
*COT Reports: The COT data, released weekly to the public each Friday, is updated through the most recent Tuesday (data is 3 days old) and shows a quick view of how large speculators or non-commercials (for-profit traders) were positioned in the futures markets.
The CFTC categorizes trader positions according to commercial hedgers (traders who use futures contracts for hedging as part of the business), non-commercials (large traders who speculate to realize trading profits) and nonreportable traders (usually small traders/speculators) as well as their open interest (contracts open in the market at time of reporting). See CFTC criteria here.


