By InvestMacro
Here are the latest charts and statistics for the Commitment of Traders (COT) reports data published by the Commodities Futures Trading Commission (CFTC).
The latest COT data is updated through Tuesday January 21st and shows a quick view of how large traders (for-profit speculators and commercial entities) were positioned in the futures markets.
Weekly Speculator Changes led by Corn & Wheat
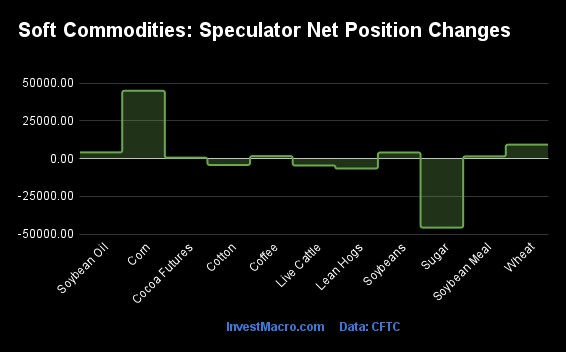
The COT soft commodities markets speculator bets were higher this week as seven out of the eleven softs markets we cover had higher positioning while the other four markets had lower speculator contracts.
Leading the gains for the softs markets was Corn (44,848 contracts) with Wheat (9,200 contracts), Soybean Oil (4,098 contracts), Soybeans (4,031 contracts), Coffee (1,649 contracts), Soybean Meal (1,428 contracts) and Cocoa (605 contracts) also showing positive weeks.
The markets with the declines in speculator bets this week were Sugar (-45,629 contracts), Lean Hogs (-6,566 contracts), Live Cattle (-4,553 contracts) and Cotton (-4,210 contracts) also registering lower bets on the week.
Soft Commodities Net Speculators Leaderboard
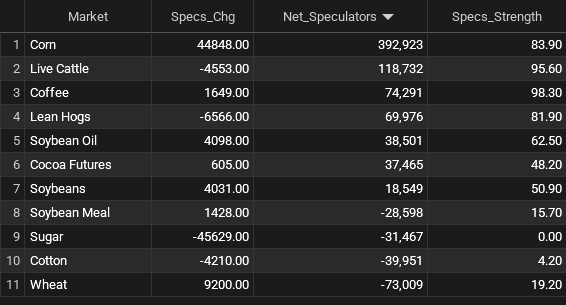
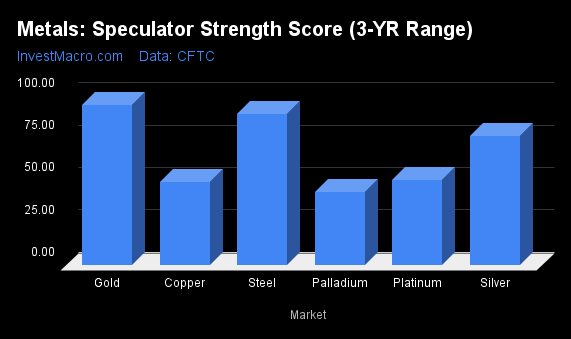
Legend: Weekly Speculators Change | Speculators Current Net Position | Speculators Strength Score compared to last 3-Years (0-100 range)
Strength Scores led by Coffee & Live Cattle
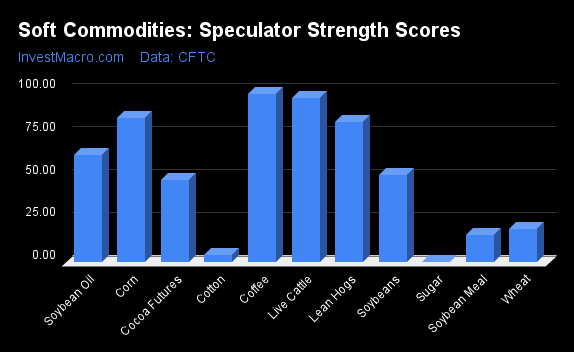
COT Strength Scores (a normalized measure of Speculator positions over a 3-Year range, from 0 to 100 where above 80 is Extreme-Bullish and below 20 is Extreme-Bearish) showed that Coffee (98 percent) and Live Cattle (96 percent) lead the softs markets this week. Corn (84 percent), Lean Hogs (82 percent) and Soybean Oil (63 percent) come in as the next highest in the weekly strength scores.
On the downside, Sugar (0 percent), Cotton (4 percent), Soybean Meal (16 percent) and Wheat (19 percent) come in at the lowest strength levels currently and are in Extreme-Bearish territory (below 20 percent).
Strength Statistics:
Corn (83.9 percent) vs Corn previous week (78.2 percent)
Sugar (0.0 percent) vs Sugar previous week (14.7 percent)
Coffee (98.3 percent) vs Coffee previous week (96.7 percent)
Soybeans (50.9 percent) vs Soybeans previous week (50.0 percent)
Soybean Oil (62.5 percent) vs Soybean Oil previous week (60.3 percent)
Soybean Meal (15.7 percent) vs Soybean Meal previous week (15.1 percent)
Live Cattle (95.6 percent) vs Live Cattle previous week (100.0 percent)
Lean Hogs (81.9 percent) vs Lean Hogs previous week (87.0 percent)
Cotton (4.2 percent) vs Cotton previous week (7.0 percent)
Cocoa (48.2 percent) vs Cocoa previous week (47.6 percent)
Wheat (19.2 percent) vs Wheat previous week (11.9 percent)
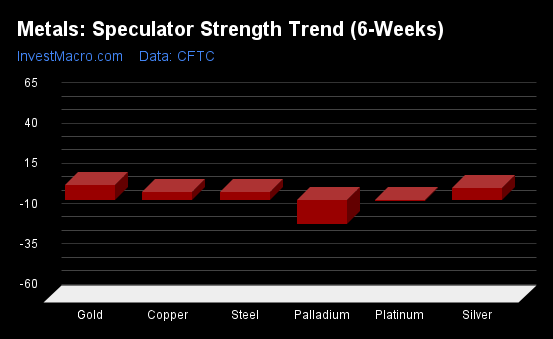
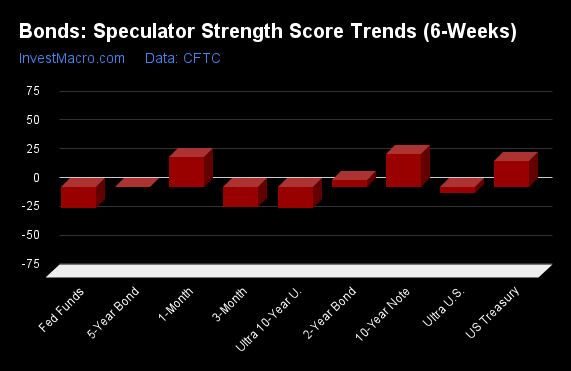
Soybeans & Corn top the 6-Week Strength Trends
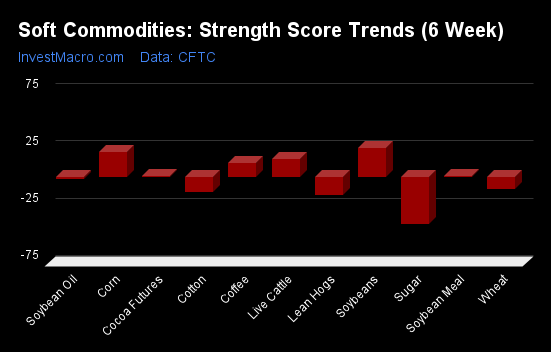
COT Strength Score Trends (or move index, calculates the 6-week changes in strength scores) showed that Soybeans (25 percent) and Corn (21 percent) lead the past six weeks trends for soft commodities. Live Cattle (15 percent) and Coffee (12 percent) are the next highest positive movers in the latest trends data.
Sugar (-41 percent) leads the downside trend scores currently with Lean Hogs (-17 percent), Cotton (-14 percent) and Wheat (-11 percent) following next with lower trend scores.
Strength Trend Statistics:
Corn (21.5 percent) vs Corn previous week (26.8 percent)
Sugar (-41.4 percent) vs Sugar previous week (-23.8 percent)
Coffee (11.9 percent) vs Coffee previous week (5.8 percent)
Soybeans (24.7 percent) vs Soybeans previous week (26.7 percent)
Soybean Oil (-2.4 percent) vs Soybean Oil previous week (4.1 percent)
Soybean Meal (0.3 percent) vs Soybean Meal previous week (1.6 percent)
Live Cattle (15.5 percent) vs Live Cattle previous week (25.3 percent)
Lean Hogs (-16.6 percent) vs Lean Hogs previous week (-11.7 percent)
Cotton (-13.8 percent) vs Cotton previous week (-14.9 percent)
Cocoa (0.5 percent) vs Cocoa previous week (-0.3 percent)
Wheat (-10.9 percent) vs Wheat previous week (-16.4 percent)
Individual Soft Commodities Markets:
CORN Futures:
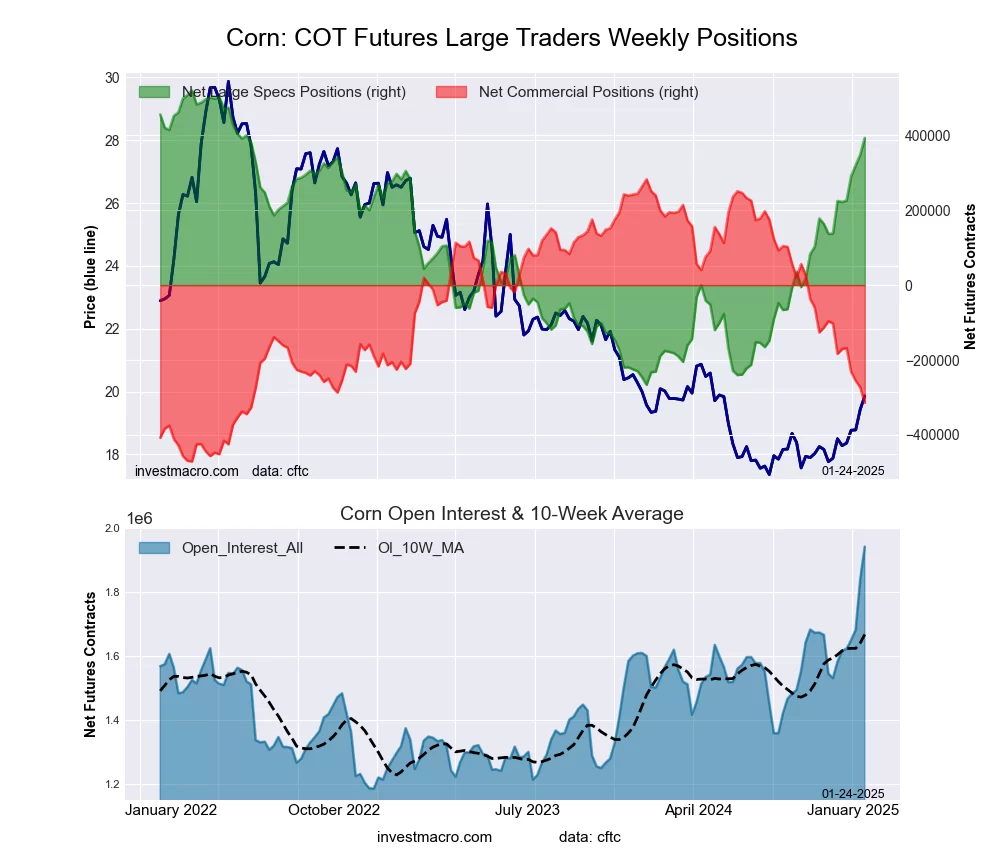 The CORN large speculator standing this week resulted in a net position of 392,923 contracts in the data reported through Tuesday. This was a weekly boost of 44,848 contracts from the previous week which had a total of 348,075 net contracts.
This week’s current strength score (the trader positioning range over the past three years, measured from 0 to 100) shows the speculators are currently Bullish-Extreme with a score of 83.9 percent. The commercials are Bearish with a score of 20.8 percent and the small traders (not shown in chart) are Bearish-Extreme with a score of 3.0 percent.
Price Trend-Following Model: Strong Uptrend
Our weekly trend-following model classifies the current market price position as: Strong Uptrend.
| CORN Futures Statistics | SPECULATORS | COMMERCIALS | SMALL TRADERS |
| – Percent of Open Interest Longs: | 30.2 | 41.7 | 6.2 |
| – Percent of Open Interest Shorts: | 10.0 | 57.9 | 10.2 |
| – Net Position: | 392,923 | -314,101 | -78,822 |
| – Gross Longs: | 587,335 | 810,136 | 120,226 |
| – Gross Shorts: | 194,412 | 1,124,237 | 199,048 |
| – Long to Short Ratio: | 3.0 to 1 | 0.7 to 1 | 0.6 to 1 |
| NET POSITION TREND: | | | |
| – Strength Index Score (3 Year Range Pct): | 83.9 | 20.8 | 3.0 |
| – Strength Index Reading (3 Year Range): | Bullish-Extreme | Bearish | Bearish-Extreme |
| NET POSITION MOVEMENT INDEX: | | | |
| – 6-Week Change in Strength Index: | 21.5 | -17.3 | -50.2 |
SUGAR Futures:
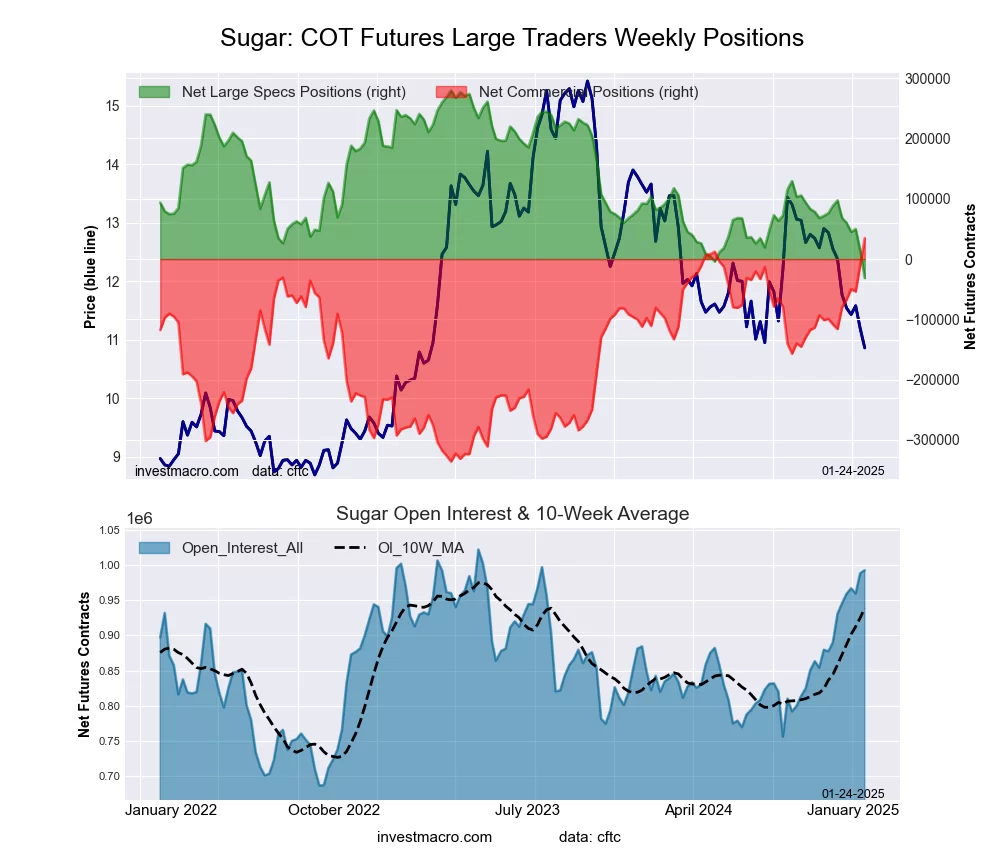 The SUGAR large speculator standing this week resulted in a net position of -31,467 contracts in the data reported through Tuesday. This was a weekly decline of -45,629 contracts from the previous week which had a total of 14,162 net contracts.
This week’s current strength score (the trader positioning range over the past three years, measured from 0 to 100) shows the speculators are currently Bearish-Extreme with a score of 0.0 percent. The commercials are Bullish-Extreme with a score of 100.0 percent and the small traders (not shown in chart) are Bearish-Extreme with a score of 15.1 percent.
Price Trend-Following Model: Strong Downtrend
Our weekly trend-following model classifies the current market price position as: Strong Downtrend.
| SUGAR Futures Statistics | SPECULATORS | COMMERCIALS | SMALL TRADERS |
| – Percent of Open Interest Longs: | 23.3 | 54.3 | 7.0 |
| – Percent of Open Interest Shorts: | 26.5 | 50.7 | 7.3 |
| – Net Position: | -31,467 | 34,888 | -3,421 |
| – Gross Longs: | 231,219 | 538,361 | 69,175 |
| – Gross Shorts: | 262,686 | 503,473 | 72,596 |
| – Long to Short Ratio: | 0.9 to 1 | 1.1 to 1 | 1.0 to 1 |
| NET POSITION TREND: | | | |
| – Strength Index Score (3 Year Range Pct): | 0.0 | 100.0 | 15.1 |
| – Strength Index Reading (3 Year Range): | Bearish-Extreme | Bullish-Extreme | Bearish-Extreme |
| NET POSITION MOVEMENT INDEX: | | | |
| – 6-Week Change in Strength Index: | -41.4 | 40.7 | -28.7 |
COFFEE Futures:
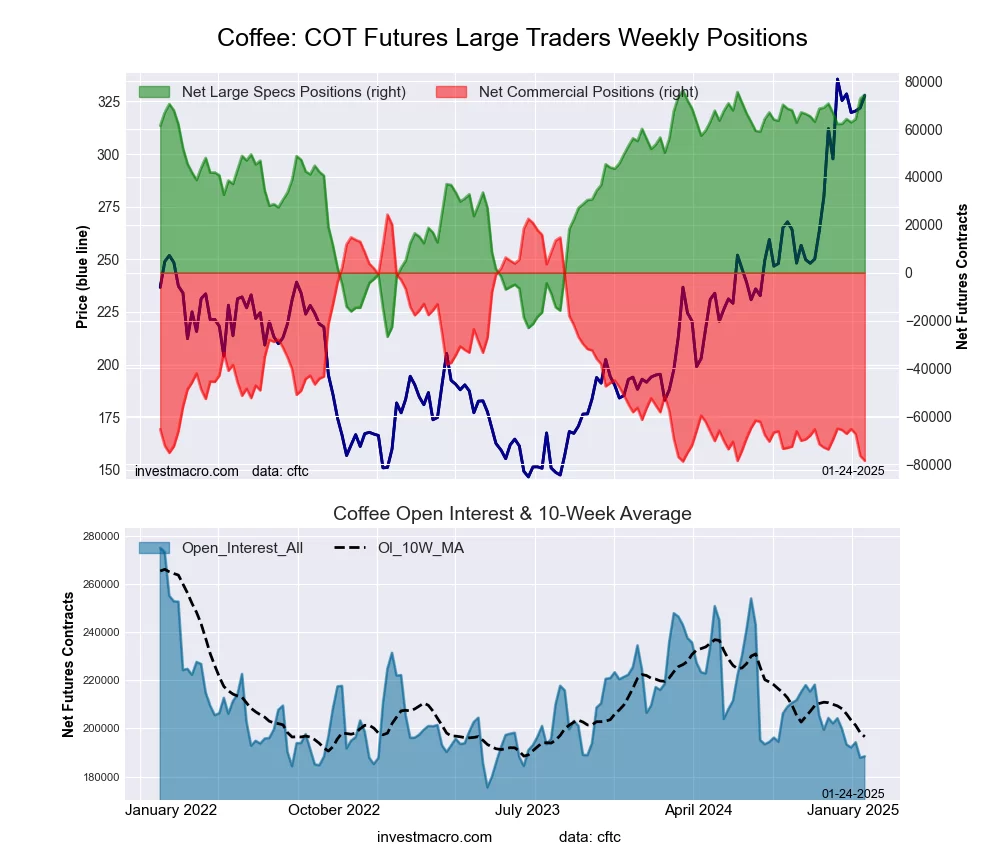 The COFFEE large speculator standing this week resulted in a net position of 74,291 contracts in the data reported through Tuesday. This was a weekly gain of 1,649 contracts from the previous week which had a total of 72,642 net contracts.
This week’s current strength score (the trader positioning range over the past three years, measured from 0 to 100) shows the speculators are currently Bullish-Extreme with a score of 98.3 percent. The commercials are Bearish-Extreme with a score of 0.3 percent and the small traders (not shown in chart) are Bullish-Extreme with a score of 82.1 percent.
Price Trend-Following Model: Strong Uptrend
Our weekly trend-following model classifies the current market price position as: Strong Uptrend.
| COFFEE Futures Statistics | SPECULATORS | COMMERCIALS | SMALL TRADERS |
| – Percent of Open Interest Longs: | 44.0 | 29.8 | 5.9 |
| – Percent of Open Interest Shorts: | 4.6 | 71.5 | 3.7 |
| – Net Position: | 74,291 | -78,526 | 4,235 |
| – Gross Longs: | 83,011 | 56,217 | 11,170 |
| – Gross Shorts: | 8,720 | 134,743 | 6,935 |
| – Long to Short Ratio: | 9.5 to 1 | 0.4 to 1 | 1.6 to 1 |
| NET POSITION TREND: | | | |
| – Strength Index Score (3 Year Range Pct): | 98.3 | 0.3 | 82.1 |
| – Strength Index Reading (3 Year Range): | Bullish-Extreme | Bearish-Extreme | Bullish-Extreme |
| NET POSITION MOVEMENT INDEX: | | | |
| – 6-Week Change in Strength Index: | 11.9 | -13.0 | 18.4 |
SOYBEANS Futures:
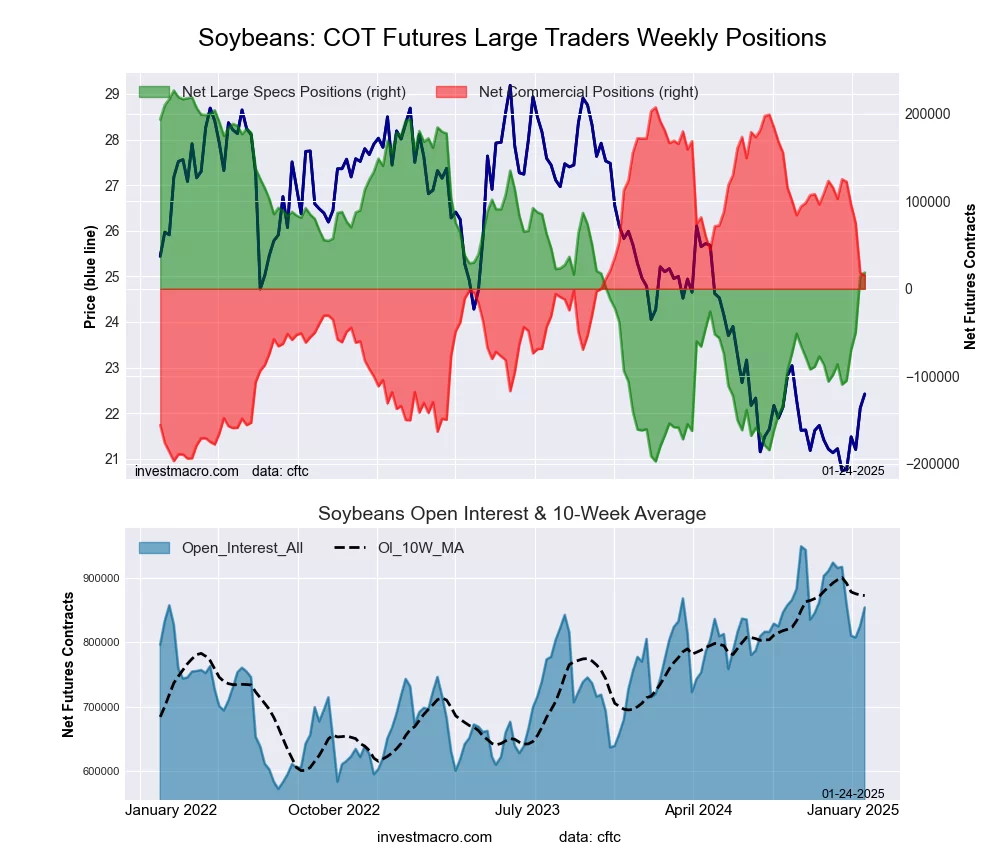 The SOYBEANS large speculator standing this week resulted in a net position of 18,549 contracts in the data reported through Tuesday. This was a weekly lift of 4,031 contracts from the previous week which had a total of 14,518 net contracts.
This week’s current strength score (the trader positioning range over the past three years, measured from 0 to 100) shows the speculators are currently Bullish with a score of 50.9 percent. The commercials are Bullish with a score of 52.4 percent and the small traders (not shown in chart) are Bearish with a score of 25.3 percent.
Price Trend-Following Model: Weak Downtrend
Our weekly trend-following model classifies the current market price position as: Weak Downtrend.
| SOYBEANS Futures Statistics | SPECULATORS | COMMERCIALS | SMALL TRADERS |
| – Percent of Open Interest Longs: | 21.9 | 56.7 | 4.6 |
| – Percent of Open Interest Shorts: | 19.8 | 55.0 | 8.5 |
| – Net Position: | 18,549 | 14,875 | -33,424 |
| – Gross Longs: | 187,255 | 484,417 | 39,381 |
| – Gross Shorts: | 168,706 | 469,542 | 72,805 |
| – Long to Short Ratio: | 1.1 to 1 | 1.0 to 1 | 0.5 to 1 |
| NET POSITION TREND: | | | |
| – Strength Index Score (3 Year Range Pct): | 50.9 | 52.4 | 25.3 |
| – Strength Index Reading (3 Year Range): | Bullish | Bullish | Bearish |
| NET POSITION MOVEMENT INDEX: | | | |
| – 6-Week Change in Strength Index: | 24.7 | -21.7 | -44.5 |
SOYBEAN OIL Futures:
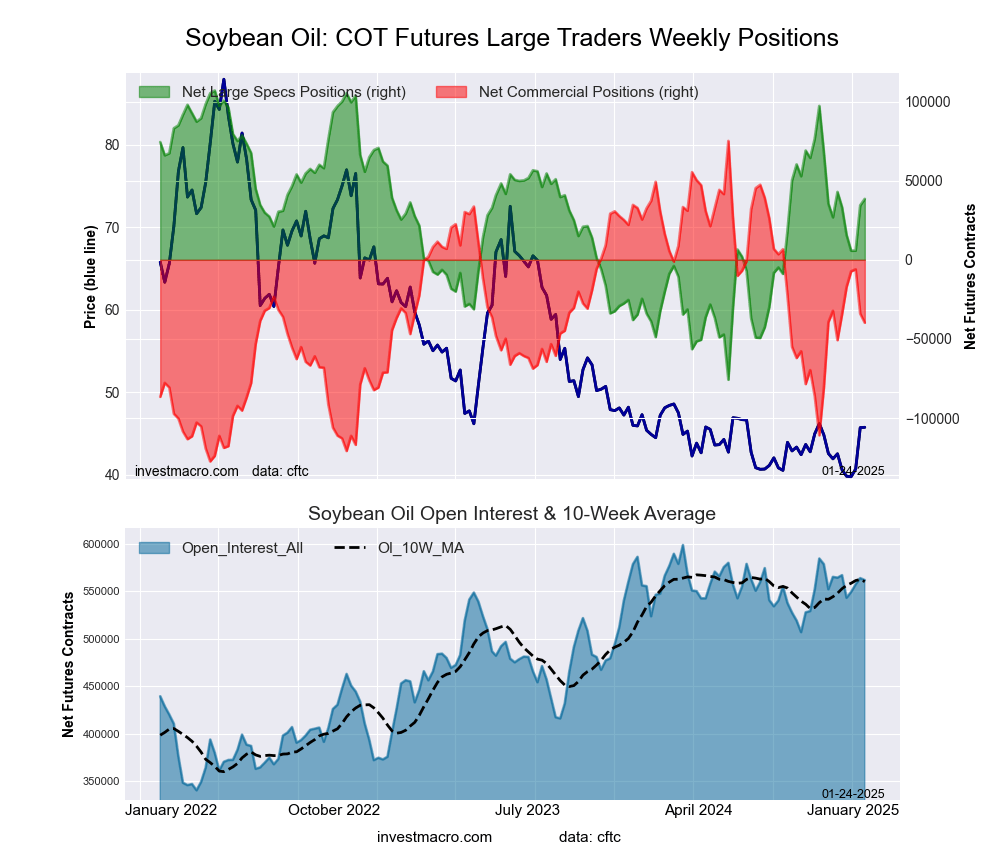 The SOYBEAN OIL large speculator standing this week resulted in a net position of 38,501 contracts in the data reported through Tuesday. This was a weekly advance of 4,098 contracts from the previous week which had a total of 34,403 net contracts.
This week’s current strength score (the trader positioning range over the past three years, measured from 0 to 100) shows the speculators are currently Bullish with a score of 62.5 percent. The commercials are Bearish with a score of 43.3 percent and the small traders (not shown in chart) are Bearish-Extreme with a score of 18.9 percent.
Price Trend-Following Model: Strong Uptrend
Our weekly trend-following model classifies the current market price position as: Strong Uptrend.
| SOYBEAN OIL Futures Statistics | SPECULATORS | COMMERCIALS | SMALL TRADERS |
| – Percent of Open Interest Longs: | 22.0 | 55.5 | 5.2 |
| – Percent of Open Interest Shorts: | 15.1 | 62.5 | 5.0 |
| – Net Position: | 38,501 | -39,732 | 1,231 |
| – Gross Longs: | 123,527 | 311,698 | 29,376 |
| – Gross Shorts: | 85,026 | 351,430 | 28,145 |
| – Long to Short Ratio: | 1.5 to 1 | 0.9 to 1 | 1.0 to 1 |
| NET POSITION TREND: | | | |
| – Strength Index Score (3 Year Range Pct): | 62.5 | 43.3 | 18.9 |
| – Strength Index Reading (3 Year Range): | Bullish | Bearish | Bearish-Extreme |
| NET POSITION MOVEMENT INDEX: | | | |
| – 6-Week Change in Strength Index: | -2.4 | 5.4 | -25.8 |
SOYBEAN MEAL Futures:
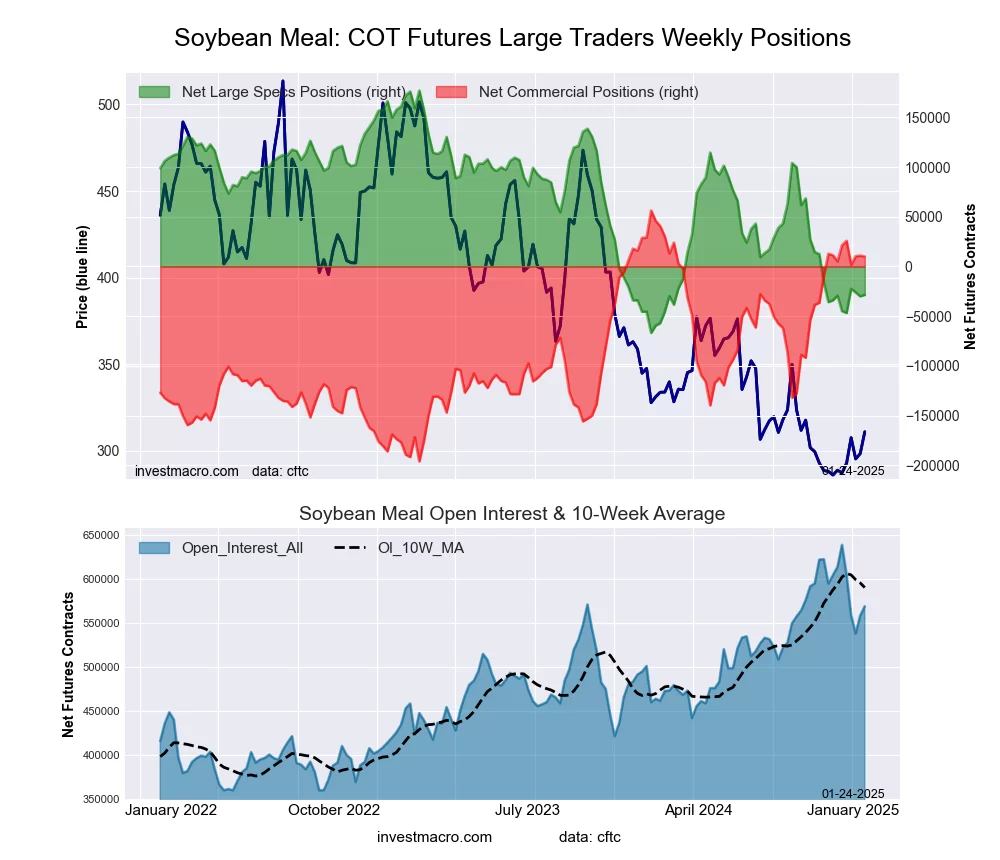 The SOYBEAN MEAL large speculator standing this week resulted in a net position of -28,598 contracts in the data reported through Tuesday. This was a weekly lift of 1,428 contracts from the previous week which had a total of -30,026 net contracts.
This week’s current strength score (the trader positioning range over the past three years, measured from 0 to 100) shows the speculators are currently Bearish-Extreme with a score of 15.7 percent. The commercials are Bullish-Extreme with a score of 81.7 percent and the small traders (not shown in chart) are Bearish with a score of 39.4 percent.
Price Trend-Following Model: Weak Downtrend
Our weekly trend-following model classifies the current market price position as: Weak Downtrend.
| SOYBEAN MEAL Futures Statistics | SPECULATORS | COMMERCIALS | SMALL TRADERS |
| – Percent of Open Interest Longs: | 17.4 | 49.7 | 8.8 |
| – Percent of Open Interest Shorts: | 22.5 | 48.0 | 5.5 |
| – Net Position: | -28,598 | 9,974 | 18,624 |
| – Gross Longs: | 99,189 | 282,710 | 50,002 |
| – Gross Shorts: | 127,787 | 272,736 | 31,378 |
| – Long to Short Ratio: | 0.8 to 1 | 1.0 to 1 | 1.6 to 1 |
| NET POSITION TREND: | | | |
| – Strength Index Score (3 Year Range Pct): | 15.7 | 81.7 | 39.4 |
| – Strength Index Reading (3 Year Range): | Bearish-Extreme | Bullish-Extreme | Bearish |
| NET POSITION MOVEMENT INDEX: | | | |
| – 6-Week Change in Strength Index: | 0.3 | 2.0 | -25.2 |
LIVE CATTLE Futures:
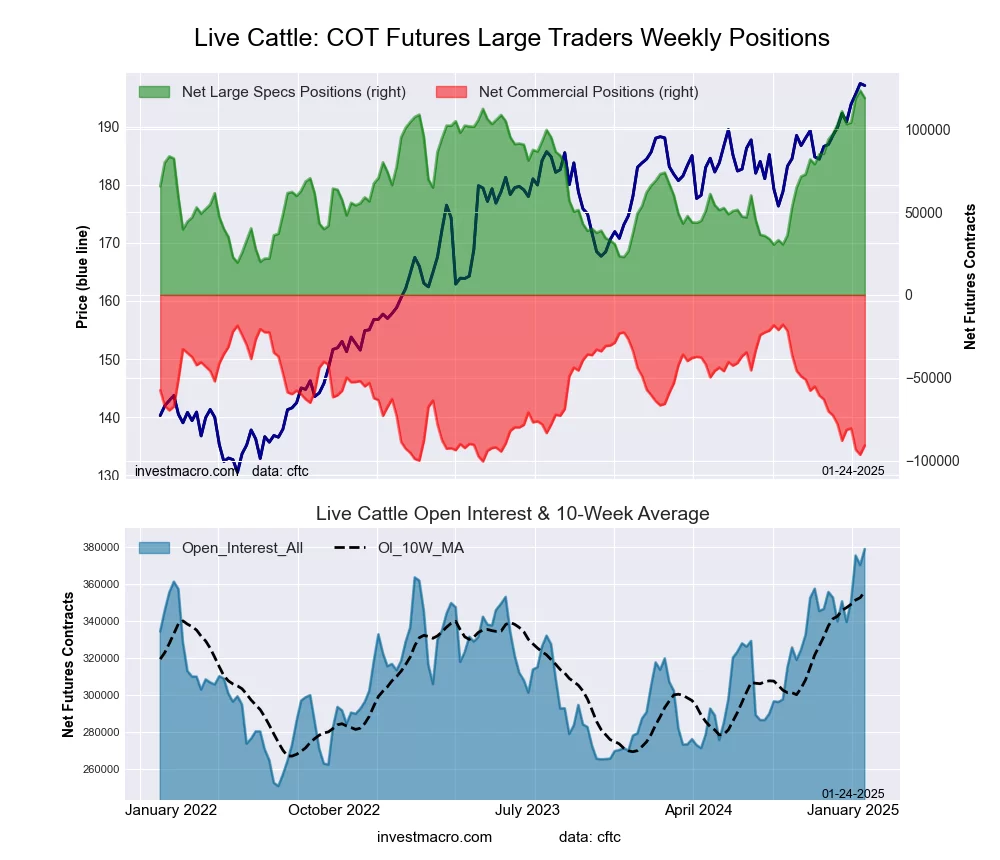 The LIVE CATTLE large speculator standing this week resulted in a net position of 118,732 contracts in the data reported through Tuesday. This was a weekly decline of -4,553 contracts from the previous week which had a total of 123,285 net contracts.
This week’s current strength score (the trader positioning range over the past three years, measured from 0 to 100) shows the speculators are currently Bullish-Extreme with a score of 95.6 percent. The commercials are Bearish-Extreme with a score of 11.7 percent and the small traders (not shown in chart) are Bearish-Extreme with a score of 0.0 percent.
Price Trend-Following Model: Strong Uptrend
Our weekly trend-following model classifies the current market price position as: Strong Uptrend.
| LIVE CATTLE Futures Statistics | SPECULATORS | COMMERCIALS | SMALL TRADERS |
| – Percent of Open Interest Longs: | 50.7 | 28.3 | 7.1 |
| – Percent of Open Interest Shorts: | 19.4 | 52.3 | 14.5 |
| – Net Position: | 118,732 | -90,810 | -27,922 |
| – Gross Longs: | 192,157 | 107,106 | 26,966 |
| – Gross Shorts: | 73,425 | 197,916 | 54,888 |
| – Long to Short Ratio: | 2.6 to 1 | 0.5 to 1 | 0.5 to 1 |
| NET POSITION TREND: | | | |
| – Strength Index Score (3 Year Range Pct): | 95.6 | 11.7 | 0.0 |
| – Strength Index Reading (3 Year Range): | Bullish-Extreme | Bearish-Extreme | Bearish-Extreme |
| NET POSITION MOVEMENT INDEX: | | | |
| – 6-Week Change in Strength Index: | 15.5 | -15.6 | -10.5 |
LEAN HOGS Futures:
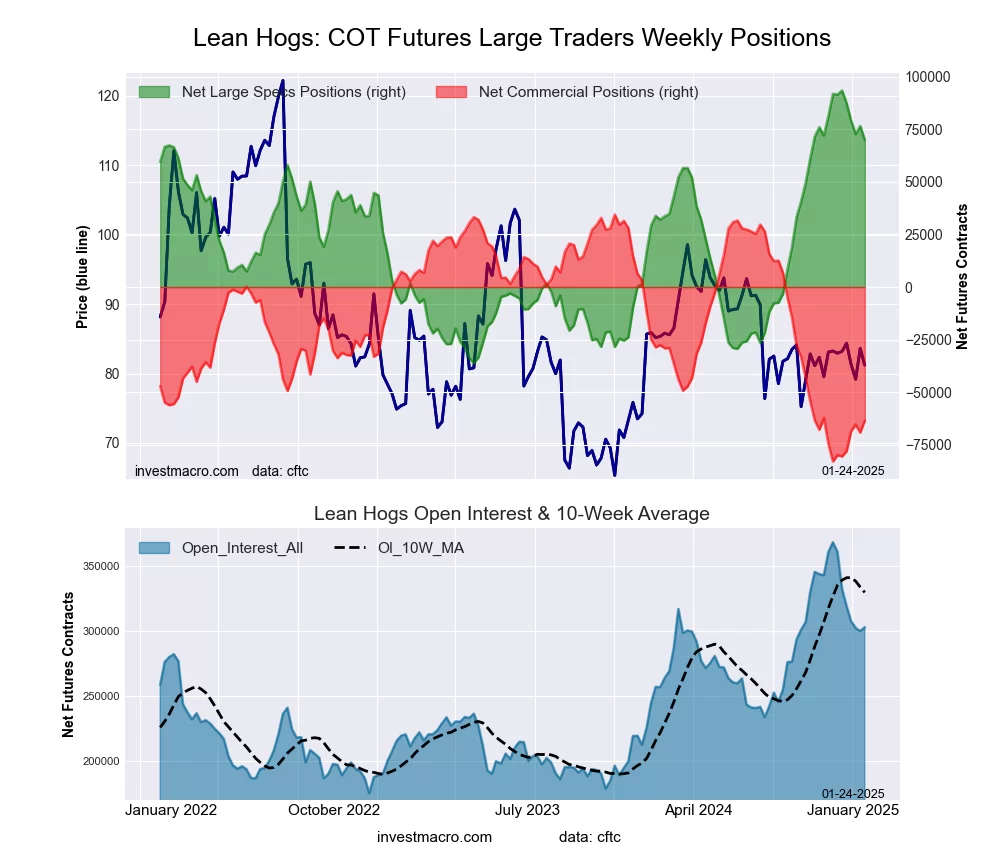 The LEAN HOGS large speculator standing this week resulted in a net position of 69,976 contracts in the data reported through Tuesday. This was a weekly fall of -6,566 contracts from the previous week which had a total of 76,542 net contracts.
This week’s current strength score (the trader positioning range over the past three years, measured from 0 to 100) shows the speculators are currently Bullish-Extreme with a score of 81.9 percent. The commercials are Bearish-Extreme with a score of 16.6 percent and the small traders (not shown in chart) are Bearish with a score of 38.5 percent.
Price Trend-Following Model: Uptrend
Our weekly trend-following model classifies the current market price position as: Uptrend.
| LEAN HOGS Futures Statistics | SPECULATORS | COMMERCIALS | SMALL TRADERS |
| – Percent of Open Interest Longs: | 41.7 | 32.9 | 7.3 |
| – Percent of Open Interest Shorts: | 18.6 | 53.9 | 9.4 |
| – Net Position: | 69,976 | -63,497 | -6,479 |
| – Gross Longs: | 126,358 | 99,831 | 22,147 |
| – Gross Shorts: | 56,382 | 163,328 | 28,626 |
| – Long to Short Ratio: | 2.2 to 1 | 0.6 to 1 | 0.8 to 1 |
| NET POSITION TREND: | | | |
| – Strength Index Score (3 Year Range Pct): | 81.9 | 16.6 | 38.5 |
| – Strength Index Reading (3 Year Range): | Bullish-Extreme | Bearish-Extreme | Bearish |
| NET POSITION MOVEMENT INDEX: | | | |
| – 6-Week Change in Strength Index: | -16.6 | 14.0 | 31.0 |
COTTON Futures:
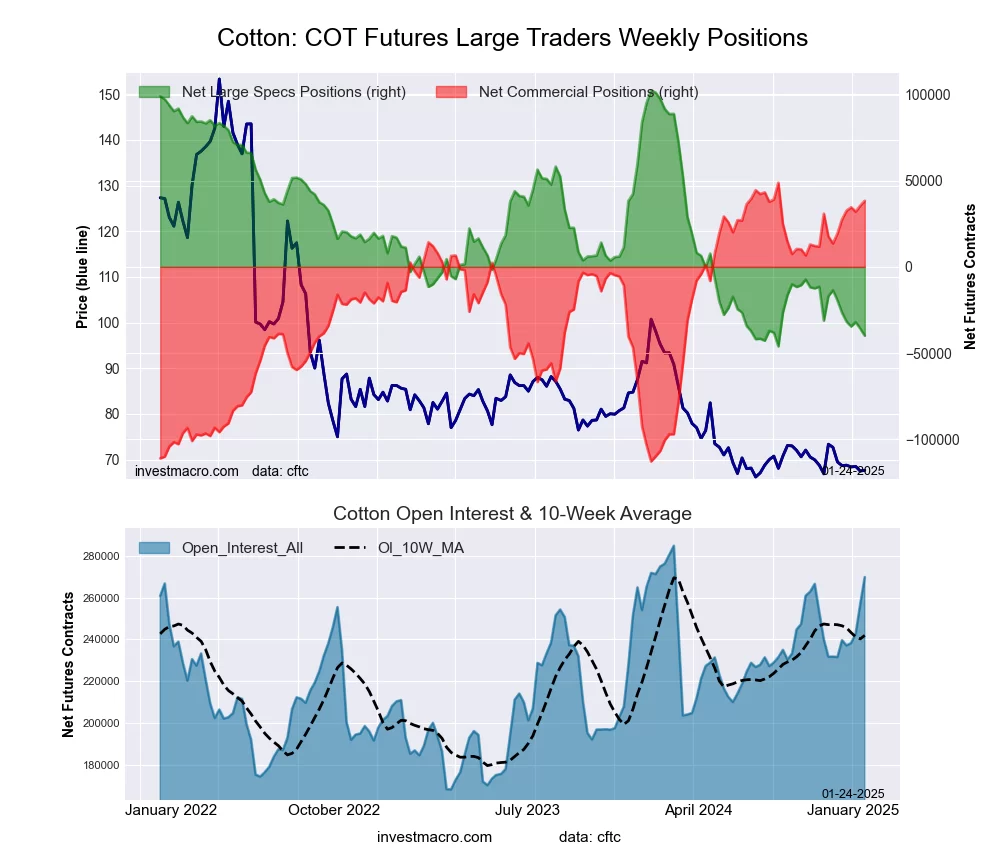 The COTTON large speculator standing this week resulted in a net position of -39,951 contracts in the data reported through Tuesday. This was a weekly decrease of -4,210 contracts from the previous week which had a total of -35,741 net contracts.
This week’s current strength score (the trader positioning range over the past three years, measured from 0 to 100) shows the speculators are currently Bearish-Extreme with a score of 4.2 percent. The commercials are Bullish-Extreme with a score of 93.5 percent and the small traders (not shown in chart) are Bearish with a score of 26.4 percent.
Price Trend-Following Model: Strong Downtrend
Our weekly trend-following model classifies the current market price position as: Strong Downtrend.
| COTTON Futures Statistics | SPECULATORS | COMMERCIALS | SMALL TRADERS |
| – Percent of Open Interest Longs: | 24.6 | 48.9 | 5.7 |
| – Percent of Open Interest Shorts: | 39.4 | 34.7 | 5.1 |
| – Net Position: | -39,951 | 38,335 | 1,616 |
| – Gross Longs: | 66,257 | 131,973 | 15,453 |
| – Gross Shorts: | 106,208 | 93,638 | 13,837 |
| – Long to Short Ratio: | 0.6 to 1 | 1.4 to 1 | 1.1 to 1 |
| NET POSITION TREND: | | | |
| – Strength Index Score (3 Year Range Pct): | 4.2 | 93.5 | 26.4 |
| – Strength Index Reading (3 Year Range): | Bearish-Extreme | Bullish-Extreme | Bearish |
| NET POSITION MOVEMENT INDEX: | | | |
| – 6-Week Change in Strength Index: | -13.8 | 11.7 | 9.0 |
COCOA Futures:
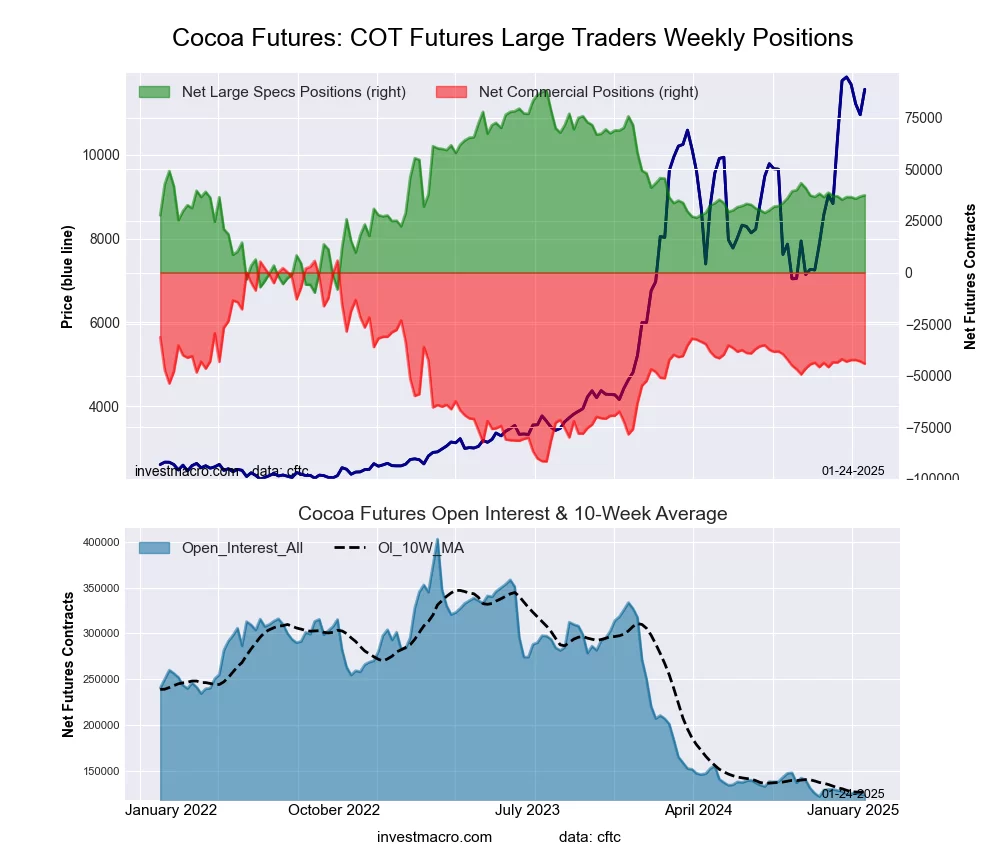 The COCOA large speculator standing this week resulted in a net position of 37,465 contracts in the data reported through Tuesday. This was a weekly lift of 605 contracts from the previous week which had a total of 36,860 net contracts.
This week’s current strength score (the trader positioning range over the past three years, measured from 0 to 100) shows the speculators are currently Bearish with a score of 48.2 percent. The commercials are Bearish with a score of 48.6 percent and the small traders (not shown in chart) are Bullish with a score of 69.9 percent.
Price Trend-Following Model: Strong Uptrend
Our weekly trend-following model classifies the current market price position as: Strong Uptrend.
| COCOA Futures Statistics | SPECULATORS | COMMERCIALS | SMALL TRADERS |
| – Percent of Open Interest Longs: | 40.5 | 37.4 | 9.6 |
| – Percent of Open Interest Shorts: | 10.4 | 73.0 | 4.1 |
| – Net Position: | 37,465 | -44,243 | 6,778 |
| – Gross Longs: | 50,408 | 46,552 | 11,924 |
| – Gross Shorts: | 12,943 | 90,795 | 5,146 |
| – Long to Short Ratio: | 3.9 to 1 | 0.5 to 1 | 2.3 to 1 |
| NET POSITION TREND: | | | |
| – Strength Index Score (3 Year Range Pct): | 48.2 | 48.6 | 69.9 |
| – Strength Index Reading (3 Year Range): | Bearish | Bearish | Bullish |
| NET POSITION MOVEMENT INDEX: | | | |
| – 6-Week Change in Strength Index: | 0.5 | -0.6 | 1.1 |
WHEAT Futures:
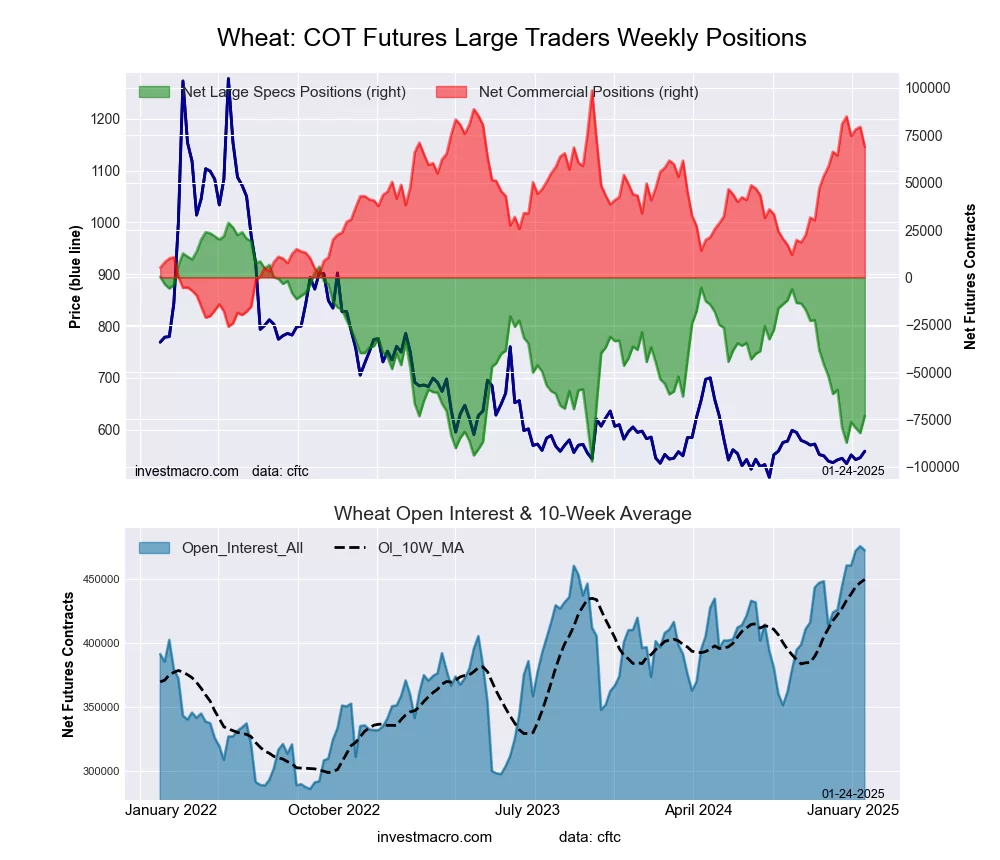 The WHEAT large speculator standing this week resulted in a net position of -73,009 contracts in the data reported through Tuesday. This was a weekly boost of 9,200 contracts from the previous week which had a total of -82,209 net contracts.
This week’s current strength score (the trader positioning range over the past three years, measured from 0 to 100) shows the speculators are currently Bearish-Extreme with a score of 19.2 percent. The commercials are Bullish with a score of 76.1 percent and the small traders (not shown in chart) are Bullish with a score of 79.6 percent.
Price Trend-Following Model: Downtrend
Our weekly trend-following model classifies the current market price position as: Downtrend.
| WHEAT Futures Statistics | SPECULATORS | COMMERCIALS | SMALL TRADERS |
| – Percent of Open Interest Longs: | 29.4 | 33.8 | 7.5 |
| – Percent of Open Interest Shorts: | 44.9 | 19.2 | 6.6 |
| – Net Position: | -73,009 | 68,865 | 4,144 |
| – Gross Longs: | 138,911 | 159,618 | 35,248 |
| – Gross Shorts: | 211,920 | 90,753 | 31,104 |
| – Long to Short Ratio: | 0.7 to 1 | 1.8 to 1 | 1.1 to 1 |
| NET POSITION TREND: | | | |
| – Strength Index Score (3 Year Range Pct): | 19.2 | 76.1 | 79.6 |
| – Strength Index Reading (3 Year Range): | Bearish-Extreme | Bullish | Bullish |
| NET POSITION MOVEMENT INDEX: | | | |
| – 6-Week Change in Strength Index: | -10.9 | 3.7 | 50.8 |
Article By InvestMacro – Receive our weekly COT Newsletter
*COT Report: The COT data, released weekly to the public each Friday, is updated through the most recent Tuesday (data is 3 days old) and shows a quick view of how large speculators or non-commercials (for-profit traders) were positioned in the futures markets.
The CFTC categorizes trader positions according to commercial hedgers (traders who use futures contracts for hedging as part of the business), non-commercials (large traders who speculate to realize trading profits) and nonreportable traders (usually small traders/speculators) as well as their open interest (contracts open in the market at time of reporting). See CFTC criteria here.