By InvestMacro
Here are the latest charts and statistics for the Commitment of Traders (COT) data published by the Commodities Futures Trading Commission (CFTC).
The latest COT data is updated through Tuesday January 21st and shows a quick view of how large traders (for-profit speculators and commercial entities) were positioned in the futures markets.
Weekly Speculator Changes led by Nasdaq-Mini & DowJones-Mini
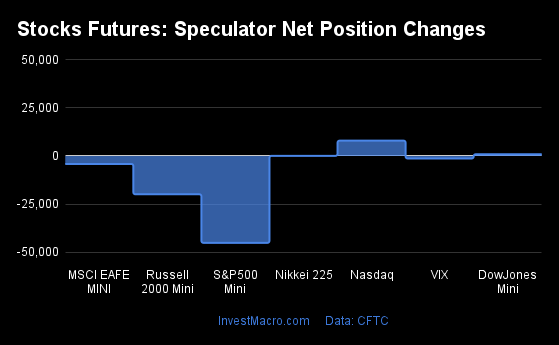
The COT stock markets speculator bets were slightly lower this week as three out of the seven stock markets we cover had higher positioning while the other four markets had lower speculator contracts.
Leading the gains for the stock markets was the Nasdaq-Mini (7,955 contracts) with the DowJones-Mini (881 contracts) and the Nikkei 225 (60 contracts) also showing positive weeks.
The markets with the declines in speculator bets this week were the S&P500-Mini (-45,173 contracts), the Russell-Mini (-19,932 contracts), the MSCI EAFE-Mini (-4,166 contracts) and with the VIX (-1,330 contracts) also registering lower bets on the week.
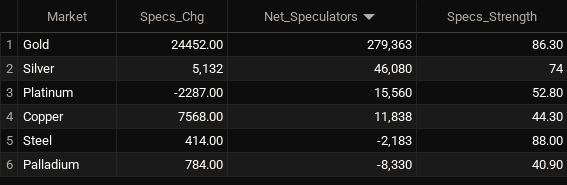
Stock Market Net Speculators Leaderboard
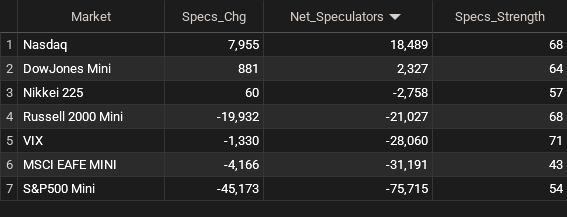
Legend: Weekly Speculators Change | Speculators Current Net Position | Speculators Strength Score compared to last 3-Years (0-100 range)
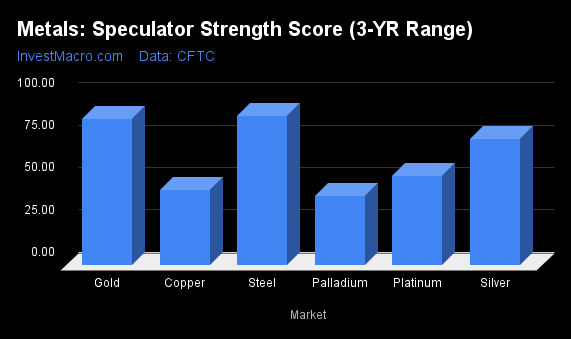
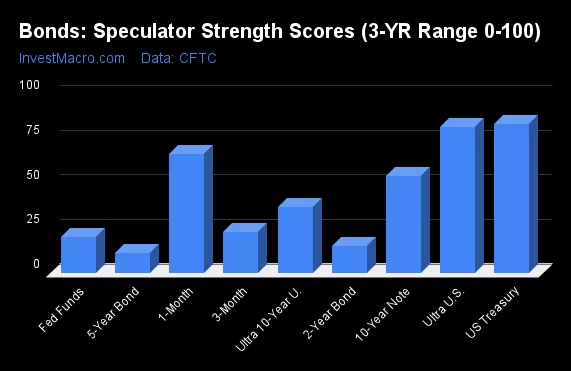
Strength Scores led by VIX & Nasdaq-Mini
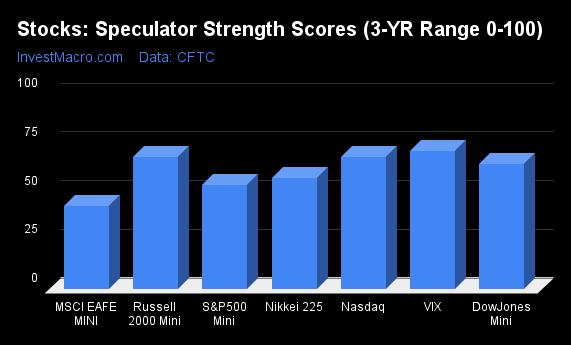
COT Strength Scores (a normalized measure of Speculator positions over a 3-Year range, from 0 to 100 where above 80 is Extreme-Bullish and below 20 is Extreme-Bearish) showed that the VIX (71 percent) and the Nasdaq-Mini (68 percent) lead the stock markets this week. The Russell-Mini (68 percent) and DowJones-Mini (64 percent) come in as the next highest in the weekly strength scores.
On the downside, the MSCI EAFE-Mini (43 percent) comes in at the lowest strength level currently.
Strength Statistics:
VIX (70.9 percent) vs VIX previous week (72.1 percent)
S&P500-Mini (53.5 percent) vs S&P500-Mini previous week (60.2 percent)
DowJones-Mini (64.1 percent) vs DowJones-Mini previous week (62.7 percent)
Nasdaq-Mini (67.8 percent) vs Nasdaq-Mini previous week (55.5 percent)
Russell2000-Mini (67.6 percent) vs Russell2000-Mini previous week (81.2 percent)
Nikkei USD (56.7 percent) vs Nikkei USD previous week (56.1 percent)
EAFE-Mini (42.7 percent) vs EAFE-Mini previous week (48.1 percent)
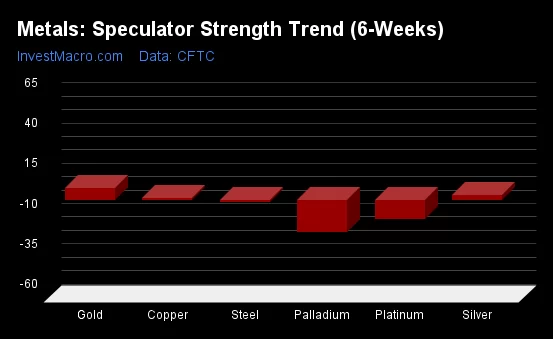
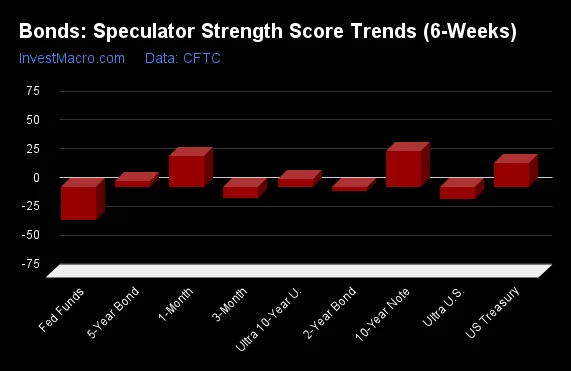
VIX tops the 6-Week Strength Trends
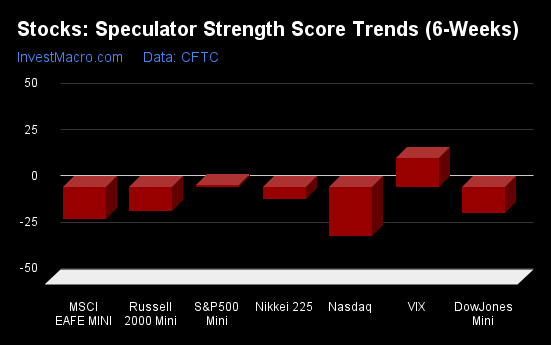
COT Strength Score Trends (or move index, calculates the 6-week changes in strength scores) showed that the VIX (16 percent) leads the past six weeks trends for the stock markets.
The Nasdaq-Mini (-26 percent) leads the downside trend scores currently with the MSCI EAFE-Mini (-17 percent) coming in as the next market with lower trend scores.
Strength Trend Statistics:
VIX (15.5 percent) vs VIX previous week (5.9 percent)
S&P500-Mini (1.1 percent) vs S&P500-Mini previous week (11.6 percent)
DowJones-Mini (-14.2 percent) vs DowJones-Mini previous week (-14.7 percent)
Nasdaq-Mini (-26.5 percent) vs Nasdaq-Mini previous week (-29.7 percent)
Russell2000-Mini (-12.9 percent) vs Russell2000-Mini previous week (7.2 percent)
Nikkei USD (-6.8 percent) vs Nikkei USD previous week (-3.2 percent)
EAFE-Mini (-17.1 percent) vs EAFE-Mini previous week (5.4 percent)
Individual Stock Market Charts:
VIX Volatility Futures:
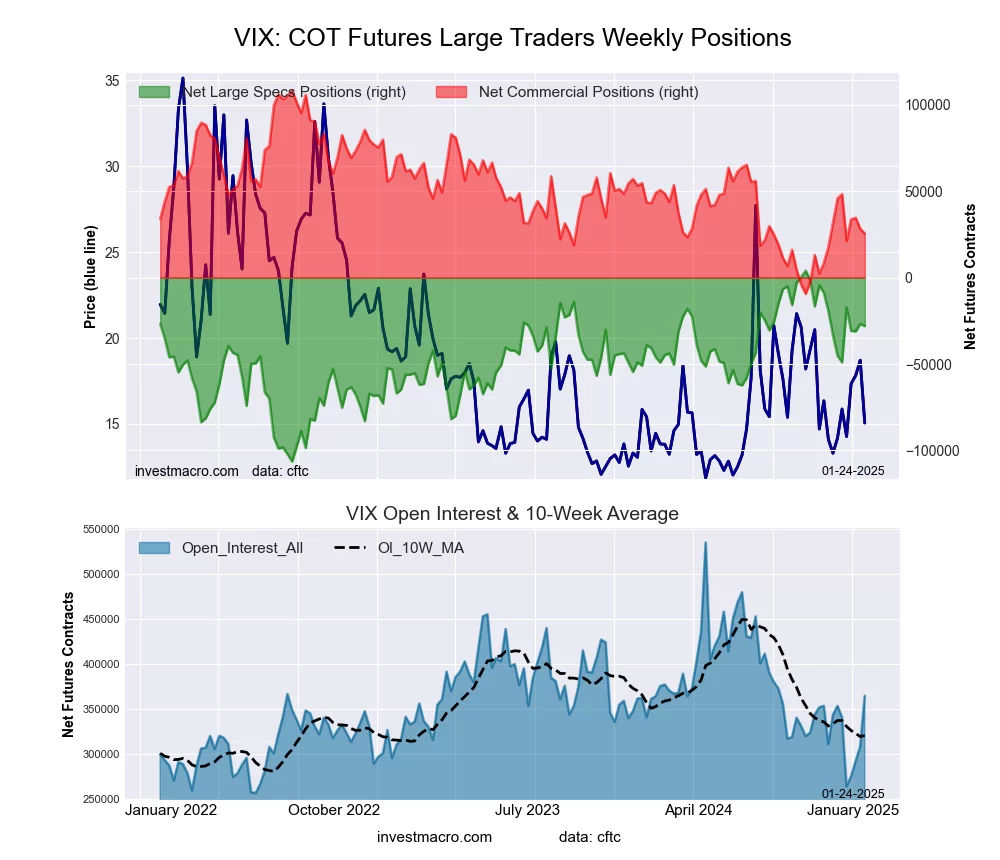 The VIX Volatility large speculator standing this week recorded a net position of -28,060 contracts in the data reported through Tuesday. This was a weekly reduction of -1,330 contracts from the previous week which had a total of -26,730 net contracts.
This week’s current strength score (the trader positioning range over the past three years, measured from 0 to 100) shows the speculators are currently Bullish with a score of 70.9 percent. The commercials are Bearish with a score of 29.6 percent and the small traders (not shown in chart) are Bullish-Extreme with a score of 88.8 percent.
Price Trend-Following Model: Strong Downtrend
Our weekly trend-following model classifies the current market price position as: Strong Downtrend.
| VIX Volatility Futures Statistics | SPECULATORS | COMMERCIALS | SMALL TRADERS |
| – Percent of Open Interest Longs: | 18.0 | 45.4 | 11.3 |
| – Percent of Open Interest Shorts: | 25.7 | 38.4 | 10.6 |
| – Net Position: | -28,060 | 25,429 | 2,631 |
| – Gross Longs: | 65,618 | 165,576 | 41,409 |
| – Gross Shorts: | 93,678 | 140,147 | 38,778 |
| – Long to Short Ratio: | 0.7 to 1 | 1.2 to 1 | 1.1 to 1 |
| NET POSITION TREND: | |||
| – Strength Index Score (3 Year Range Pct): | 70.9 | 29.6 | 88.8 |
| – Strength Index Reading (3 Year Range): | Bullish | Bearish | Bullish-Extreme |
| NET POSITION MOVEMENT INDEX: | |||
| – 6-Week Change in Strength Index: | 15.5 | -17.3 | 13.2 |
S&P500 Mini Futures:
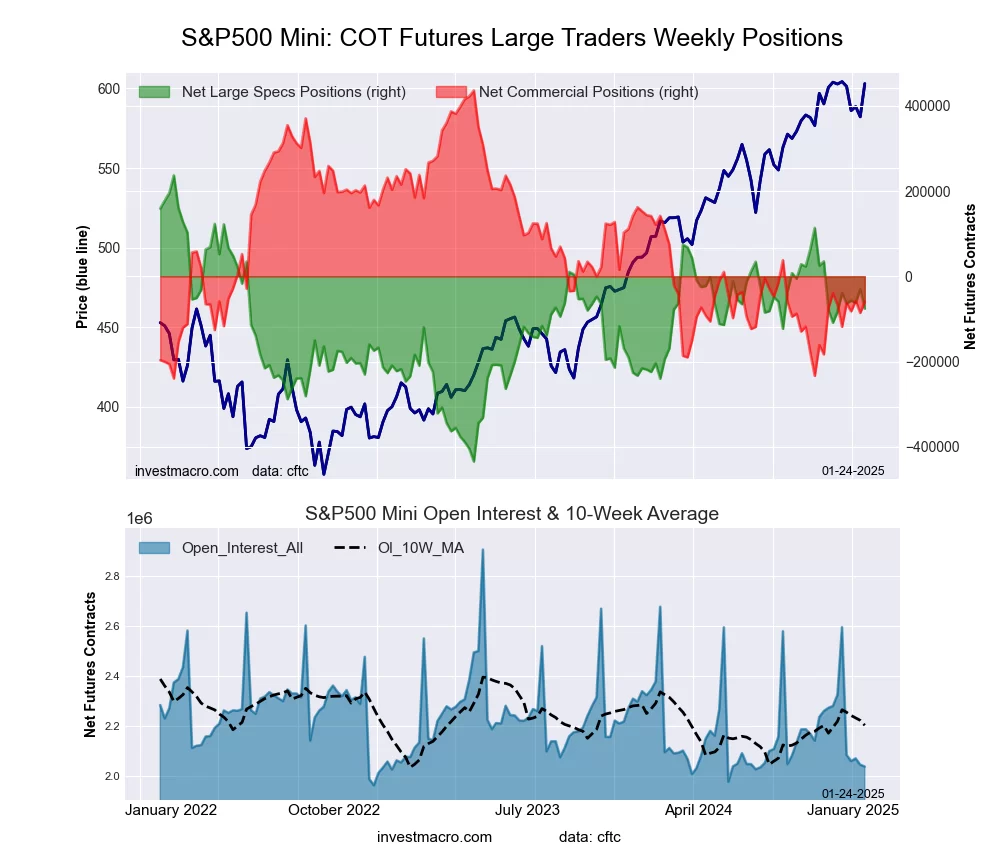 The S&P500 Mini large speculator standing this week recorded a net position of -75,715 contracts in the data reported through Tuesday. This was a weekly reduction of -45,173 contracts from the previous week which had a total of -30,542 net contracts.
This week’s current strength score (the trader positioning range over the past three years, measured from 0 to 100) shows the speculators are currently Bullish with a score of 53.5 percent. The commercials are Bearish with a score of 26.5 percent and the small traders (not shown in chart) are Bullish-Extreme with a score of 91.2 percent.
Price Trend-Following Model: Strong Uptrend
Our weekly trend-following model classifies the current market price position as: Strong Uptrend.
| S&P500 Mini Futures Statistics | SPECULATORS | COMMERCIALS | SMALL TRADERS |
| – Percent of Open Interest Longs: | 13.0 | 71.4 | 13.7 |
| – Percent of Open Interest Shorts: | 16.7 | 74.4 | 7.0 |
| – Net Position: | -75,715 | -60,433 | 136,148 |
| – Gross Longs: | 263,815 | 1,453,774 | 279,487 |
| – Gross Shorts: | 339,530 | 1,514,207 | 143,339 |
| – Long to Short Ratio: | 0.8 to 1 | 1.0 to 1 | 1.9 to 1 |
| NET POSITION TREND: | |||
| – Strength Index Score (3 Year Range Pct): | 53.5 | 26.5 | 91.2 |
| – Strength Index Reading (3 Year Range): | Bullish | Bearish | Bullish-Extreme |
| NET POSITION MOVEMENT INDEX: | |||
| – 6-Week Change in Strength Index: | 1.1 | 0.9 | -5.5 |
Dow Jones Mini Futures:
 The Dow Jones Mini large speculator standing this week recorded a net position of 2,327 contracts in the data reported through Tuesday. This was a weekly boost of 881 contracts from the previous week which had a total of 1,446 net contracts.
This week’s current strength score (the trader positioning range over the past three years, measured from 0 to 100) shows the speculators are currently Bullish with a score of 64.1 percent. The commercials are Bearish with a score of 30.2 percent and the small traders (not shown in chart) are Bullish with a score of 73.2 percent.
Price Trend-Following Model: Strong Uptrend
Our weekly trend-following model classifies the current market price position as: Strong Uptrend.
| Dow Jones Mini Futures Statistics | SPECULATORS | COMMERCIALS | SMALL TRADERS |
| – Percent of Open Interest Longs: | 16.4 | 65.1 | 17.5 |
| – Percent of Open Interest Shorts: | 13.5 | 71.9 | 13.6 |
| – Net Position: | 2,327 | -5,564 | 3,237 |
| – Gross Longs: | 13,377 | 53,190 | 14,317 |
| – Gross Shorts: | 11,050 | 58,754 | 11,080 |
| – Long to Short Ratio: | 1.2 to 1 | 0.9 to 1 | 1.3 to 1 |
| NET POSITION TREND: | |||
| – Strength Index Score (3 Year Range Pct): | 64.1 | 30.2 | 73.2 |
| – Strength Index Reading (3 Year Range): | Bullish | Bearish | Bullish |
| NET POSITION MOVEMENT INDEX: | |||
| – 6-Week Change in Strength Index: | -14.2 | 15.6 | -11.9 |
Nasdaq Mini Futures:
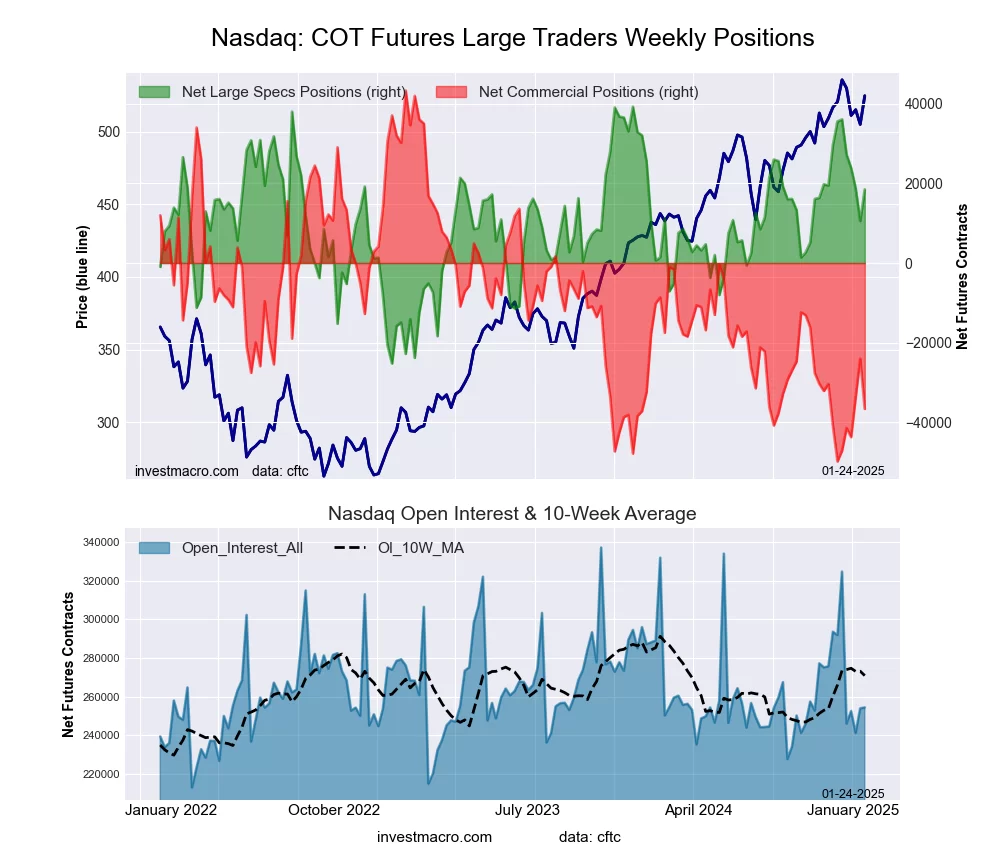 The Nasdaq Mini large speculator standing this week recorded a net position of 18,489 contracts in the data reported through Tuesday. This was a weekly boost of 7,955 contracts from the previous week which had a total of 10,534 net contracts.
This week’s current strength score (the trader positioning range over the past three years, measured from 0 to 100) shows the speculators are currently Bullish with a score of 67.8 percent. The commercials are Bearish-Extreme with a score of 14.2 percent and the small traders (not shown in chart) are Bullish-Extreme with a score of 89.2 percent.
Price Trend-Following Model: Uptrend
Our weekly trend-following model classifies the current market price position as: Uptrend.
| Nasdaq Mini Futures Statistics | SPECULATORS | COMMERCIALS | SMALL TRADERS |
| – Percent of Open Interest Longs: | 28.1 | 53.2 | 17.2 |
| – Percent of Open Interest Shorts: | 20.8 | 67.6 | 10.1 |
| – Net Position: | 18,489 | -36,654 | 18,165 |
| – Gross Longs: | 71,503 | 135,402 | 43,768 |
| – Gross Shorts: | 53,014 | 172,056 | 25,603 |
| – Long to Short Ratio: | 1.3 to 1 | 0.8 to 1 | 1.7 to 1 |
| NET POSITION TREND: | |||
| – Strength Index Score (3 Year Range Pct): | 67.8 | 14.2 | 89.2 |
| – Strength Index Reading (3 Year Range): | Bullish | Bearish-Extreme | Bullish-Extreme |
| NET POSITION MOVEMENT INDEX: | |||
| – 6-Week Change in Strength Index: | -26.5 | 14.2 | 7.4 |
Russell 2000 Mini Futures:
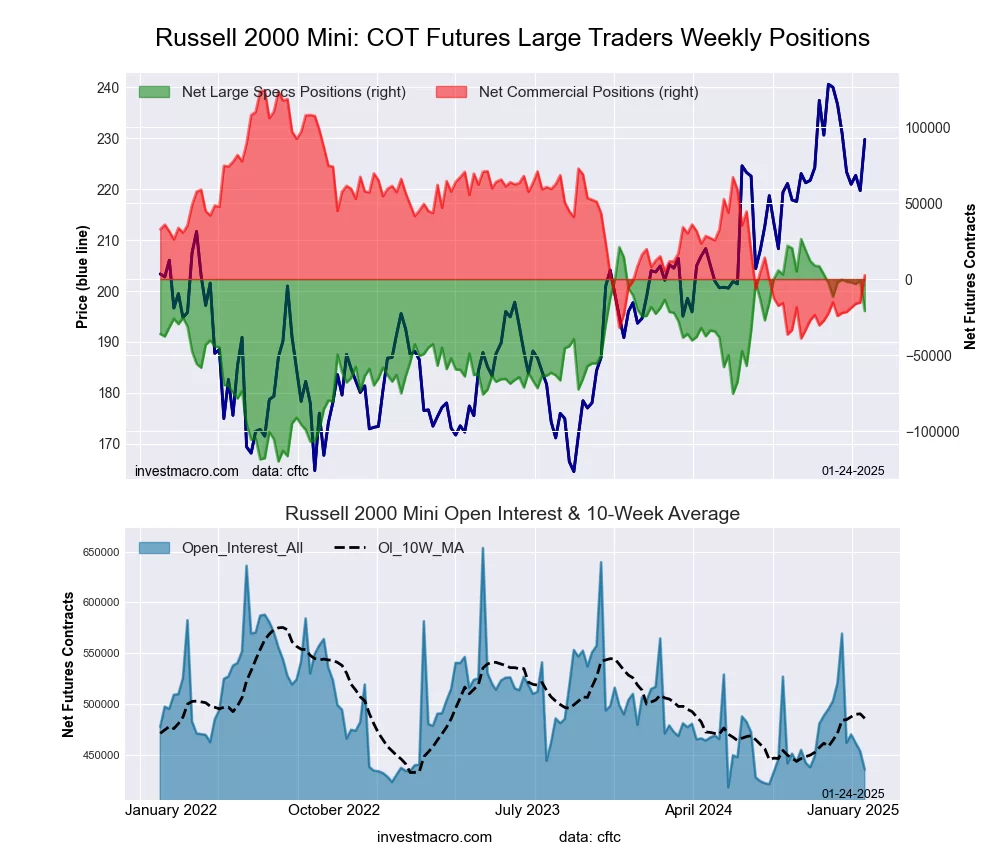 The Russell 2000 Mini large speculator standing this week recorded a net position of -21,027 contracts in the data reported through Tuesday. This was a weekly decrease of -19,932 contracts from the previous week which had a total of -1,095 net contracts.
This week’s current strength score (the trader positioning range over the past three years, measured from 0 to 100) shows the speculators are currently Bullish with a score of 67.6 percent. The commercials are Bearish with a score of 25.5 percent and the small traders (not shown in chart) are Bullish with a score of 76.6 percent.
Price Trend-Following Model: Uptrend
Our weekly trend-following model classifies the current market price position as: Uptrend.
| Russell 2000 Mini Futures Statistics | SPECULATORS | COMMERCIALS | SMALL TRADERS |
| – Percent of Open Interest Longs: | 11.6 | 76.7 | 8.5 |
| – Percent of Open Interest Shorts: | 16.4 | 76.1 | 4.3 |
| – Net Position: | -21,027 | 2,547 | 18,480 |
| – Gross Longs: | 50,530 | 334,235 | 37,263 |
| – Gross Shorts: | 71,557 | 331,688 | 18,783 |
| – Long to Short Ratio: | 0.7 to 1 | 1.0 to 1 | 2.0 to 1 |
| NET POSITION TREND: | |||
| – Strength Index Score (3 Year Range Pct): | 67.6 | 25.5 | 76.6 |
| – Strength Index Reading (3 Year Range): | Bullish | Bearish | Bullish |
| NET POSITION MOVEMENT INDEX: | |||
| – 6-Week Change in Strength Index: | -12.9 | 16.5 | -22.6 |
Nikkei Stock Average (USD) Futures:
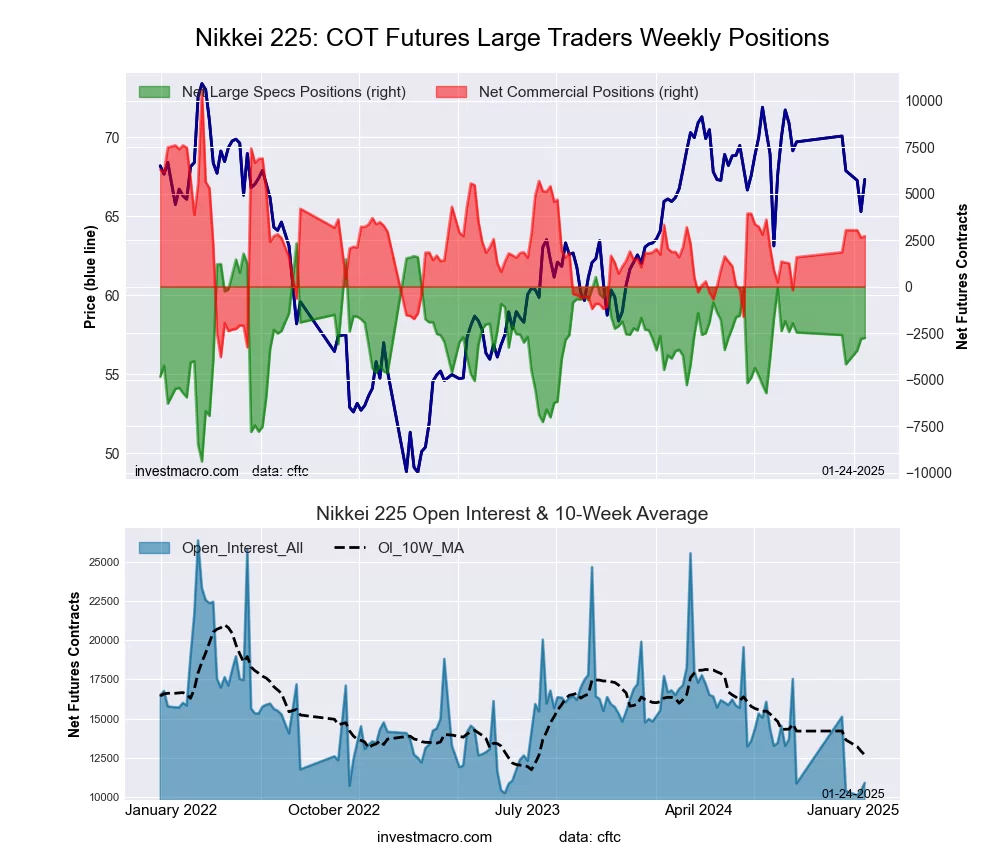 The Nikkei Stock Average (USD) large speculator standing this week recorded a net position of -2,758 contracts in the data reported through Tuesday. This was a weekly advance of 60 contracts from the previous week which had a total of -2,818 net contracts.
This week’s current strength score (the trader positioning range over the past three years, measured from 0 to 100) shows the speculators are currently Bullish with a score of 56.7 percent. The commercials are Bearish with a score of 45.4 percent and the small traders (not shown in chart) are Bearish with a score of 44.1 percent.
Price Trend-Following Model: Downtrend
Our weekly trend-following model classifies the current market price position as: Downtrend.
| Nikkei Stock Average Futures Statistics | SPECULATORS | COMMERCIALS | SMALL TRADERS |
| – Percent of Open Interest Longs: | 8.6 | 70.2 | 21.2 |
| – Percent of Open Interest Shorts: | 33.9 | 45.3 | 20.7 |
| – Net Position: | -2,758 | 2,709 | 49 |
| – Gross Longs: | 937 | 7,647 | 2,305 |
| – Gross Shorts: | 3,695 | 4,938 | 2,256 |
| – Long to Short Ratio: | 0.3 to 1 | 1.5 to 1 | 1.0 to 1 |
| NET POSITION TREND: | |||
| – Strength Index Score (3 Year Range Pct): | 56.7 | 45.4 | 44.1 |
| – Strength Index Reading (3 Year Range): | Bullish | Bearish | Bearish |
| NET POSITION MOVEMENT INDEX: | |||
| – 6-Week Change in Strength Index: | -6.8 | 20.3 | -40.5 |
MSCI EAFE Mini Futures:
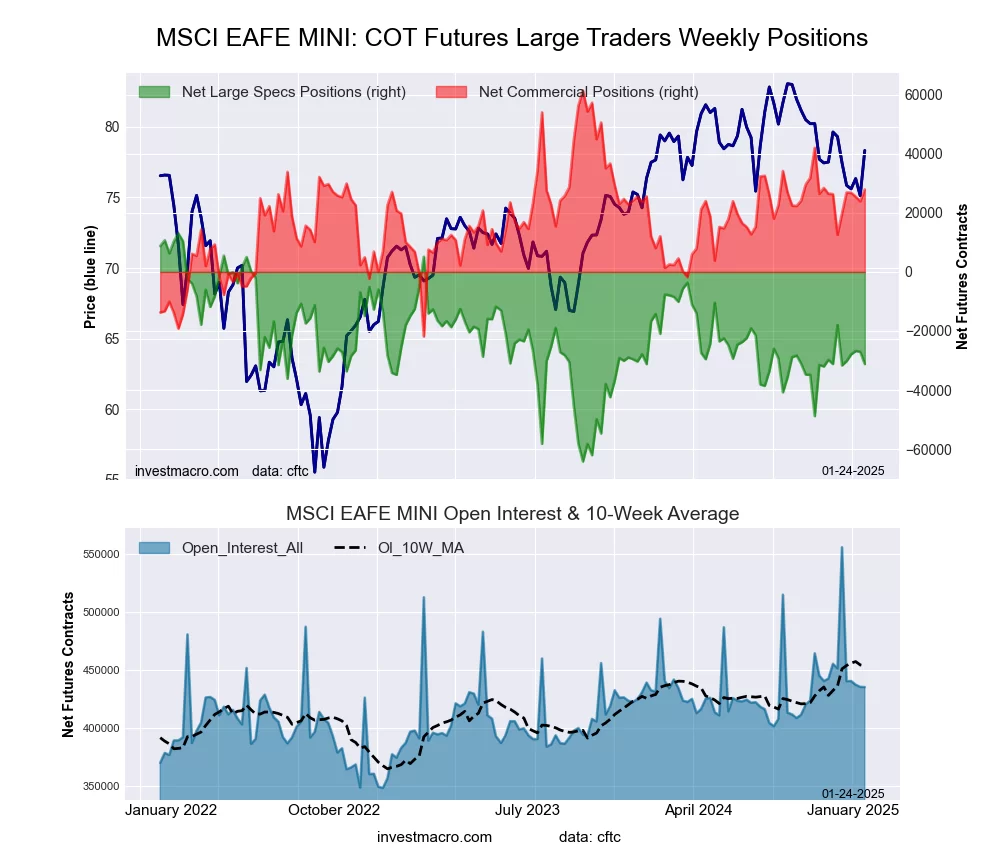 The MSCI EAFE Mini large speculator standing this week recorded a net position of -31,191 contracts in the data reported through Tuesday. This was a weekly lowering of -4,166 contracts from the previous week which had a total of -27,025 net contracts.
This week’s current strength score (the trader positioning range over the past three years, measured from 0 to 100) shows the speculators are currently Bearish with a score of 42.7 percent. The commercials are Bullish with a score of 59.7 percent and the small traders (not shown in chart) are Bearish with a score of 33.5 percent.
Price Trend-Following Model: Weak Downtrend
Our weekly trend-following model classifies the current market price position as: Weak Downtrend.
| MSCI EAFE Mini Futures Statistics | SPECULATORS | COMMERCIALS | SMALL TRADERS |
| – Percent of Open Interest Longs: | 8.6 | 88.2 | 2.6 |
| – Percent of Open Interest Shorts: | 15.7 | 81.8 | 1.8 |
| – Net Position: | -31,191 | 27,899 | 3,292 |
| – Gross Longs: | 37,252 | 384,146 | 11,192 |
| – Gross Shorts: | 68,443 | 356,247 | 7,900 |
| – Long to Short Ratio: | 0.5 to 1 | 1.1 to 1 | 1.4 to 1 |
| NET POSITION TREND: | |||
| – Strength Index Score (3 Year Range Pct): | 42.7 | 59.7 | 33.5 |
| – Strength Index Reading (3 Year Range): | Bearish | Bullish | Bearish |
| NET POSITION MOVEMENT INDEX: | |||
| – 6-Week Change in Strength Index: | -17.1 | 18.4 | -10.6 |
Article By InvestMacro – Receive our weekly COT Newsletter
*COT Report: The COT data, released weekly to the public each Friday, is updated through the most recent Tuesday (data is 3 days old) and shows a quick view of how large speculators or non-commercials (for-profit traders) were positioned in the futures markets.
The CFTC categorizes trader positions according to commercial hedgers (traders who use futures contracts for hedging as part of the business), non-commercials (large traders who speculate to realize trading profits) and nonreportable traders (usually small traders/speculators) as well as their open interest (contracts open in the market at time of reporting). See CFTC criteria here.