
By RoboForex Analytical Department
The Australian dollar against the US dollar is currently experiencing a pause in its recent upward trajectory, stabilising around 0.6525 on the H4 chart. After three sessions of gains, the currency pair is undergoing a period of consolidation, likely preparing for a return to a stable ascending trend.
The slight retreat in the US dollar, driven by profit-taking after its rally and anticipation of new developments in the US Treasury under President Donald Trump, has influenced the performance of the AUD.
The minutes from the Reserve Bank of Australia’s latest meeting highlight the bank’s commitment to maintaining a restrictive monetary policy until inflation consistently approaches the target range. The RBA remains open to adjusting its policy stance in response to changing economic conditions, with market expectations leaning towards a potential rate cut in the coming months, with a 37% probability in February and 58% in April.
Technical analysis of AUD/USD
Free Reports:
 Get our Weekly Commitment of Traders Reports - See where the biggest traders (Hedge Funds and Commercial Hedgers) are positioned in the futures markets on a weekly basis.
 Sign Up for Our Stock Market Newsletter – Get updated on News, Charts & Rankings of Public Companies when you join our Stocks Newsletter
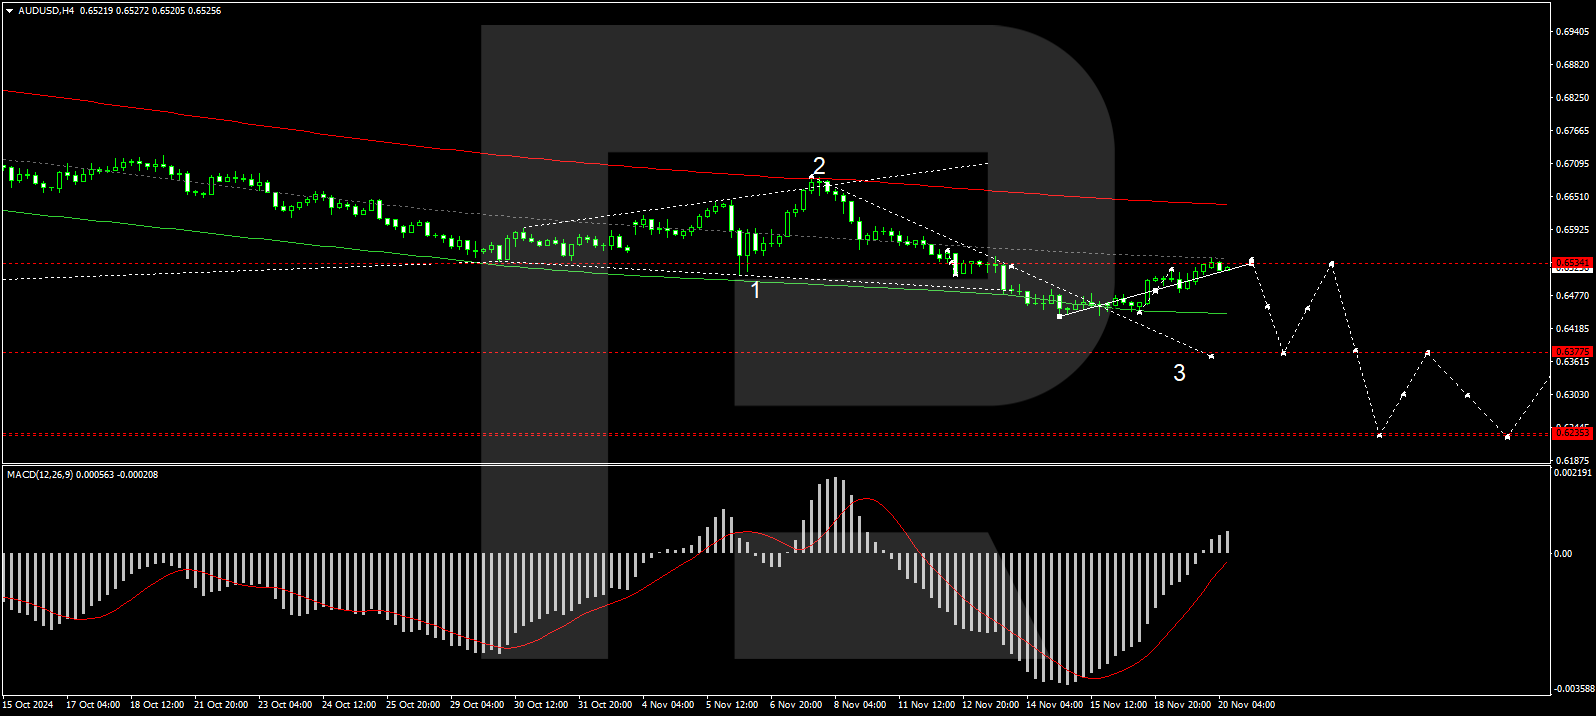
H4 chart: The AUD/USD pair is currently in a phase of correction following a downturn that saw the local decline target at 0.6440 reached. The market is forming a corrective wave towards 0.6543. If this correction is completed, a new downtrend towards 0.6380 is anticipated. The MACD indicator supports this bearish AUD/USD outlook, positioned below the zero line and poised to descend to new lows.

H1 chart: On the H1 chart, AUD/USD is approaching the correction target near 0.6543, forming a consolidation pattern just below this level. The breakout from this consolidation is expected to be downwards, initiating another phase of decline. The immediate target for this decline is set at 0.6464. The Stochastic oscillator reinforces this bearish forecast, with its signal line pointing downwards towards the 20 mark, indicating potential further declines.
Disclaimer
Any forecasts contained herein are based on the author’s particular opinion. This analysis may not be treated as trading advice. RoboForex bears no responsibility for trading results based on trading recommendations and reviews contained herein.

- Geopolitical and macroeconomic conditions continue to pressure market sentiment Jul 20, 2026
- USD/JPY Poised to Continue Gains as Expensive Oil and Lack of Support Weigh on Yen Jul 20, 2026
- COT Metals Charts: Weekly Speculator Bets led by Copper & Steel Jul 18, 2026
- COT Bonds Charts: Weekly Speculator Bets led by 2-Year, SOFR 3M & 5-Year Bonds Jul 18, 2026
- COT Energy Charts: Weekly Speculator Bets led by Brent Oil & Heating Oil Jul 18, 2026
- COT Soft Commodities Charts: Weekly Speculator Bets led by Wheat, Corn & Soybean Meal Jul 18, 2026
- The Bank of Canada kept its interest rate unchanged. Platinum prices reached a three‑week high Jul 16, 2026
- Stock indices rose after the release of US inflation data. China’s GDP slowed sharply Jul 15, 2026
- GBP/USD Awaits Political News: What Will Happen Next Jul 15, 2026
- USD/JPY Holds at Highs: Pressure Lingers on Yen Jul 14, 2026