
By RoboForex Analytical Department
The USD/JPY pair remains stable at approximately 154.30 amid global economic fluctuations and expectations of potential Japanese stimulus measures.
Japan’s latest inflation data for October revealed a decline to 2.3%, marking the lowest level in nine months and potentially easing pressure on the Bank of Japan (BoJ) for immediate rate hikes. However, BoJ Governor Kazuo Ueda has hinted at a possible rate increase in December due to the yen’s prolonged weakness.
Japan’s manufacturing sector contracted more than anticipated in November, while the service sector showed expansion, highlighting a mixed economic outlook.
Reports suggest the Japanese government may introduce a significant stimulus package worth 90 billion USD to mitigate the impact of inflation on households. While details remain undisclosed, the possibility of such measures has generated some optimism around the yen.
Technical analysis of USD/JPY
Free Reports:
 Sign Up for Our Stock Market Newsletter – Get updated on News, Charts & Rankings of Public Companies when you join our Stocks Newsletter
 Get our Weekly Commitment of Traders Reports - See where the biggest traders (Hedge Funds and Commercial Hedgers) are positioned in the futures markets on a weekly basis.
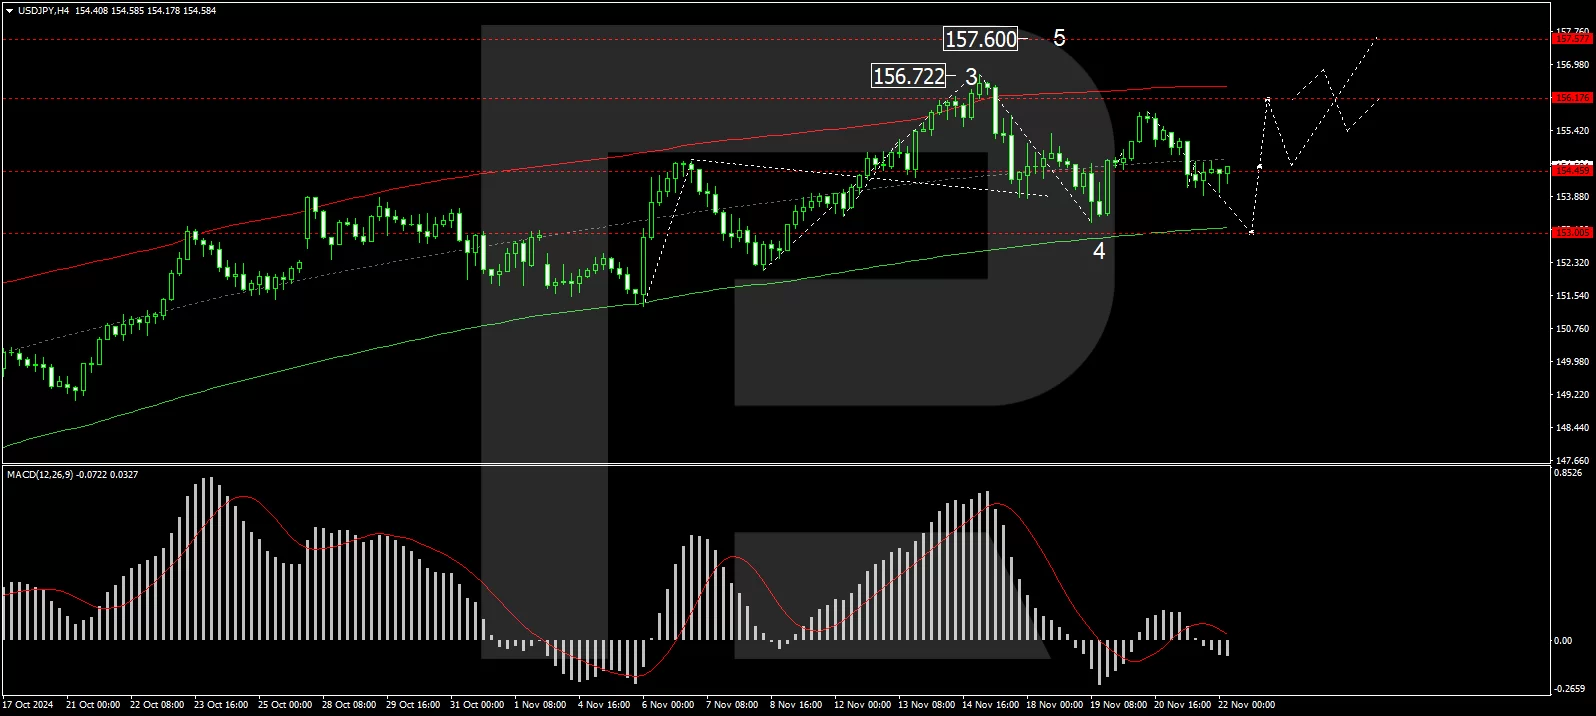
H4 Chart: the USD/JPY is forming a consolidation pattern around 154.45. A downward breakout could lead to further movement towards 153.00, while an upward breakout might pave the way to 156.20, potentially extending to 157.60. The MACD indicator supports this USD/JPY outlook, with its signal line positioned above zero but trending downwards, suggesting the pair is approaching a critical decision point.
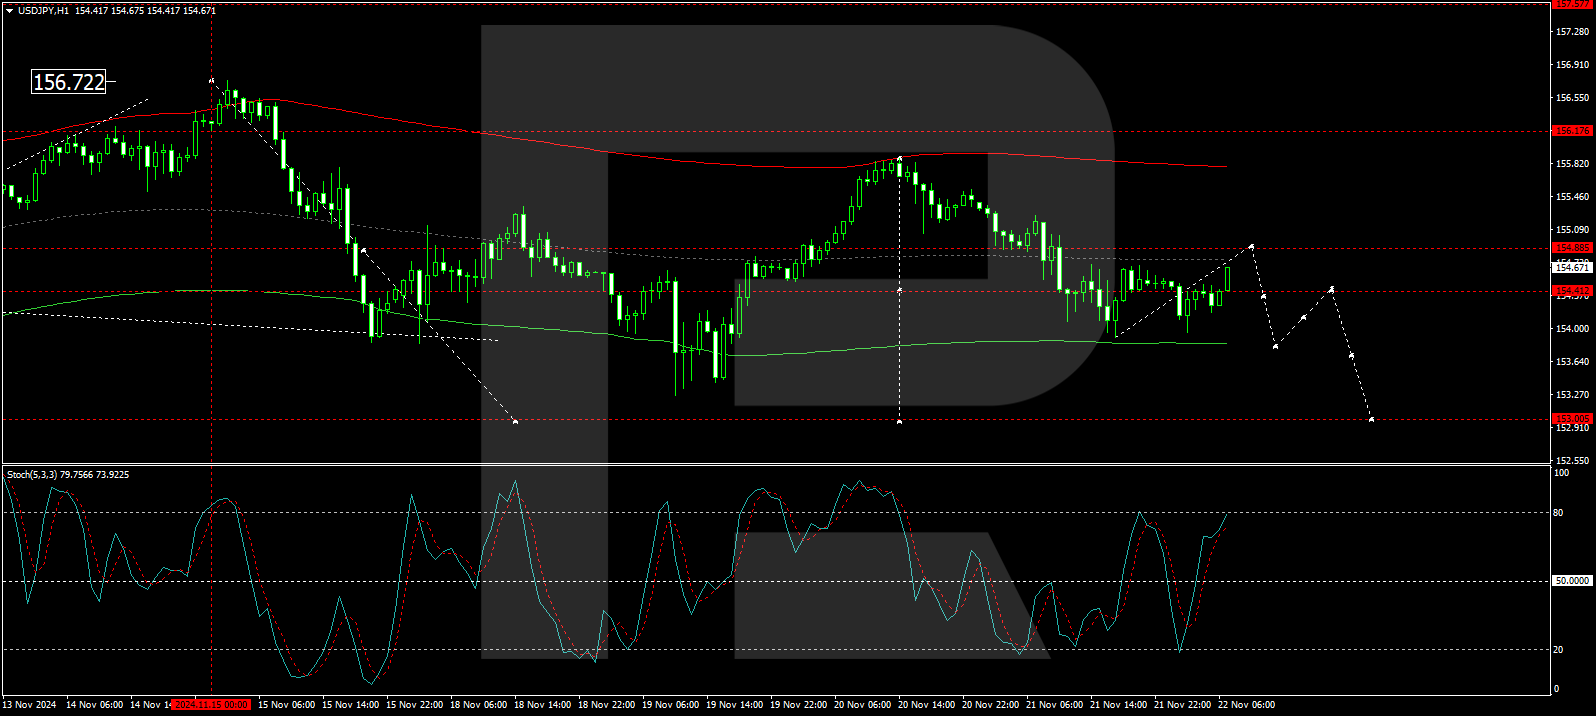
H1 Chart: a consolidation around 154.45, potentially extending to 154.88, sets the stage for possible corrective movements towards 153.00. A subsequent recovery could push the pair to 156.20, marking a new growth phase. The Stochastic oscillator, currently above 80, indicates overbought conditions, signalling a likely retraction to lower levels, aligning with the potential for a near-term correction.
Disclaimer
Any forecasts contained herein are based on the author’s particular opinion. This analysis may not be treated as trading advice. RoboForex bears no responsibility for trading results based on trading recommendations and reviews contained herein.

- Geopolitical and macroeconomic conditions continue to pressure market sentiment Jul 20, 2026
- USD/JPY Poised to Continue Gains as Expensive Oil and Lack of Support Weigh on Yen Jul 20, 2026
- COT Metals Charts: Weekly Speculator Bets led by Copper & Steel Jul 18, 2026
- COT Bonds Charts: Weekly Speculator Bets led by 2-Year, SOFR 3M & 5-Year Bonds Jul 18, 2026
- COT Energy Charts: Weekly Speculator Bets led by Brent Oil & Heating Oil Jul 18, 2026
- COT Soft Commodities Charts: Weekly Speculator Bets led by Wheat, Corn & Soybean Meal Jul 18, 2026
- The Bank of Canada kept its interest rate unchanged. Platinum prices reached a three‑week high Jul 16, 2026
- Stock indices rose after the release of US inflation data. China’s GDP slowed sharply Jul 15, 2026
- GBP/USD Awaits Political News: What Will Happen Next Jul 15, 2026
- USD/JPY Holds at Highs: Pressure Lingers on Yen Jul 14, 2026