By RoboForex Analytical Department
GBP/USD reached a seven-month peak at 1.3423 — its highest level since 26 September 2024 — before entering a corrective phase.
Key Drivers Behind GBP/USD Movements
Market concerns over US President Donald Trump’s criticism of Federal Reserve Chair Jerome Powell have eased. Trump has since clarified that Powell will not be dismissed, though he expressed frustration over the Fed’s reluctance to cut interest rates sooner.
The US Dollar’s rebound against the Pound followed the release of UK inflation data and a slightly weaker outlook for the labour market. Although the figures were published last week, the market has only now fully digested their implications.
In March, the UK Consumer Price Index (CPI) slowed to a three-month low. Meanwhile, the employment sector appears vulnerable ahead of another planned rise in employer taxes, due by the end of April.
Current market expectations suggest the Bank of England (BoE) will cut interest rates by 25 basis points (bps) in May, with an additional 85 bps of easing anticipated by year-end.
While US tariff policies are unlikely to directly impact UK inflation, their broader effect may contribute to lower rather than higher price pressures.
Technical Analysis: GBP/USD
H4 Chart Overview
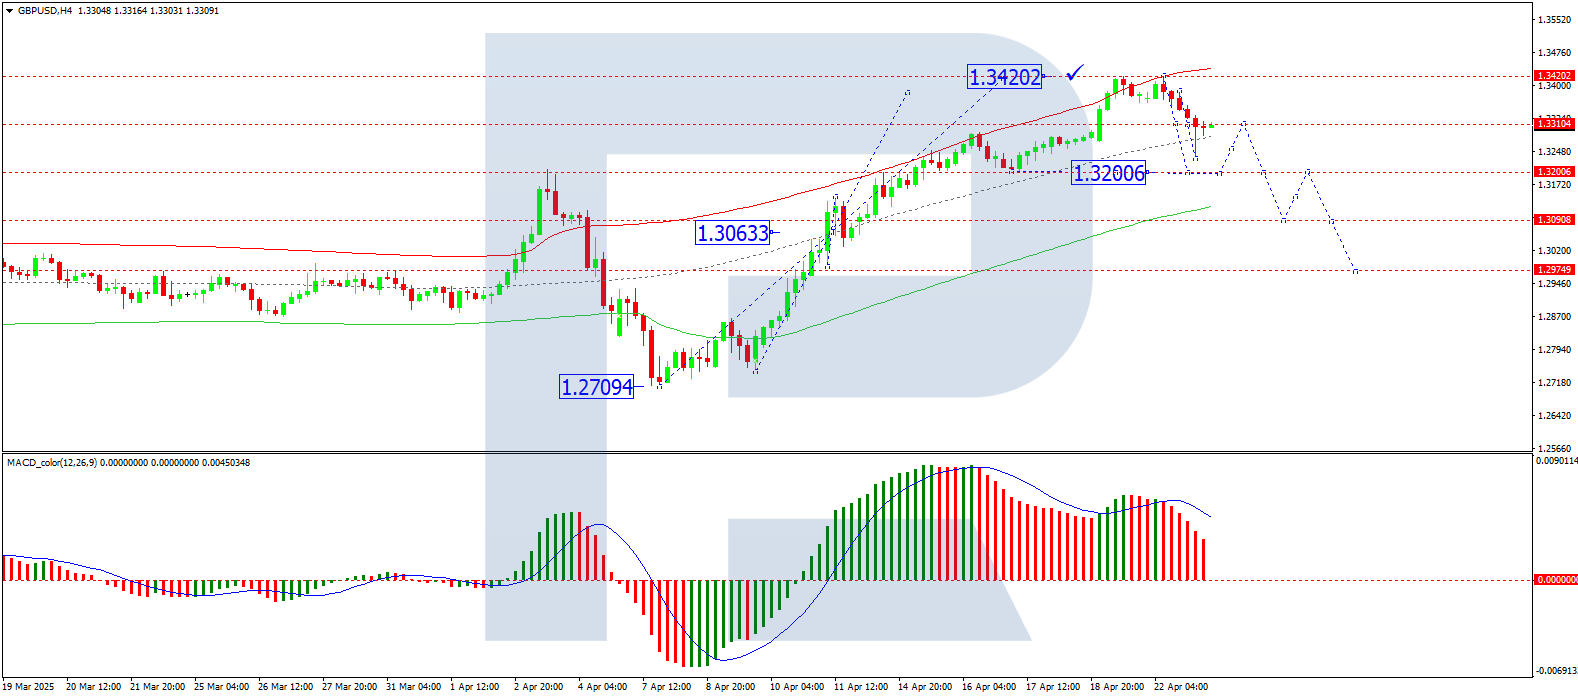
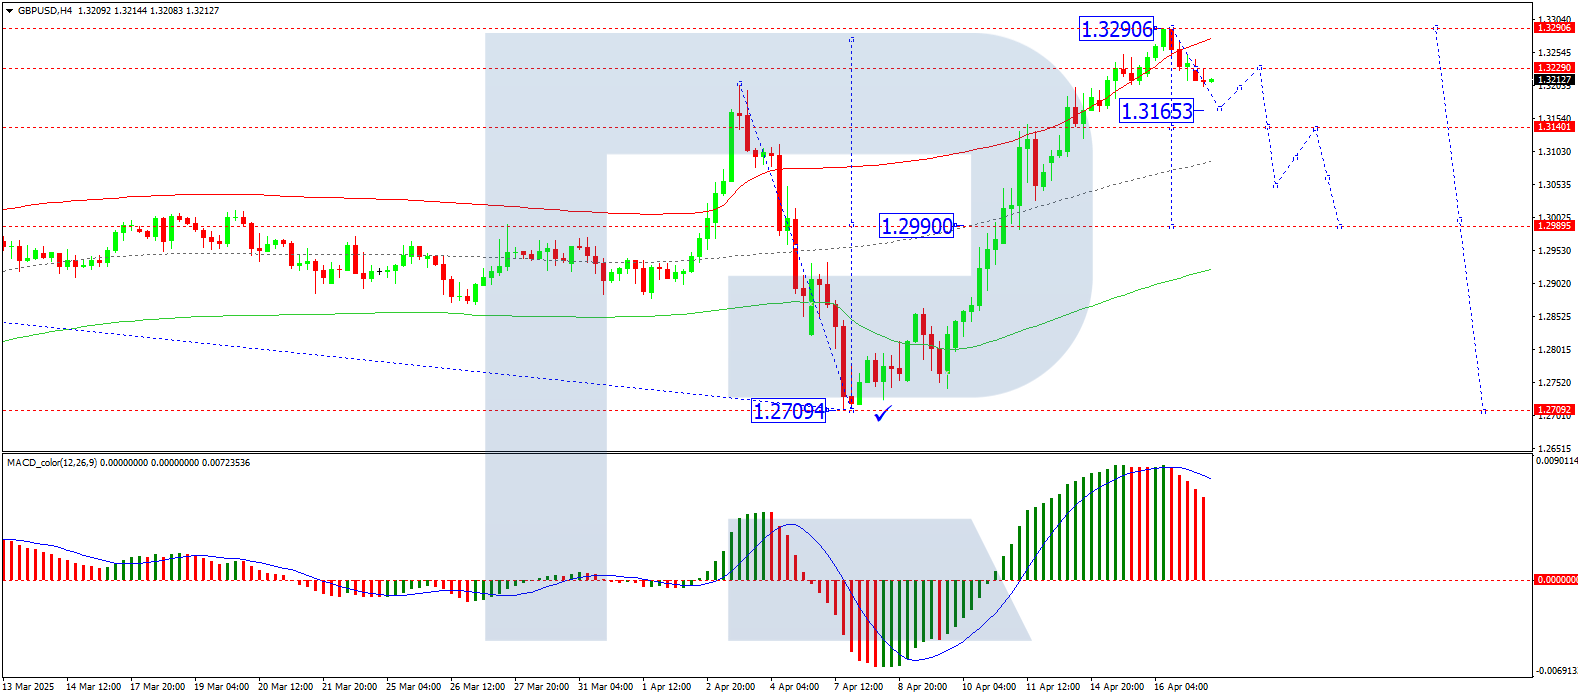
- The pair formed a consolidation range near 1.3066 before breaking upwards in a wave structure towards 1.3420.
- A corrective pullback to 1.3200 is now underway.
- The next phase may see a resumption of upward momentum towards 1.3310, potentially establishing a new consolidation range around this level.
- The MACD indicator supports this outlook, with its signal line exiting the histogram area and pointing sharply downward, suggesting near-term bearish momentum.
H1 Chart Overview
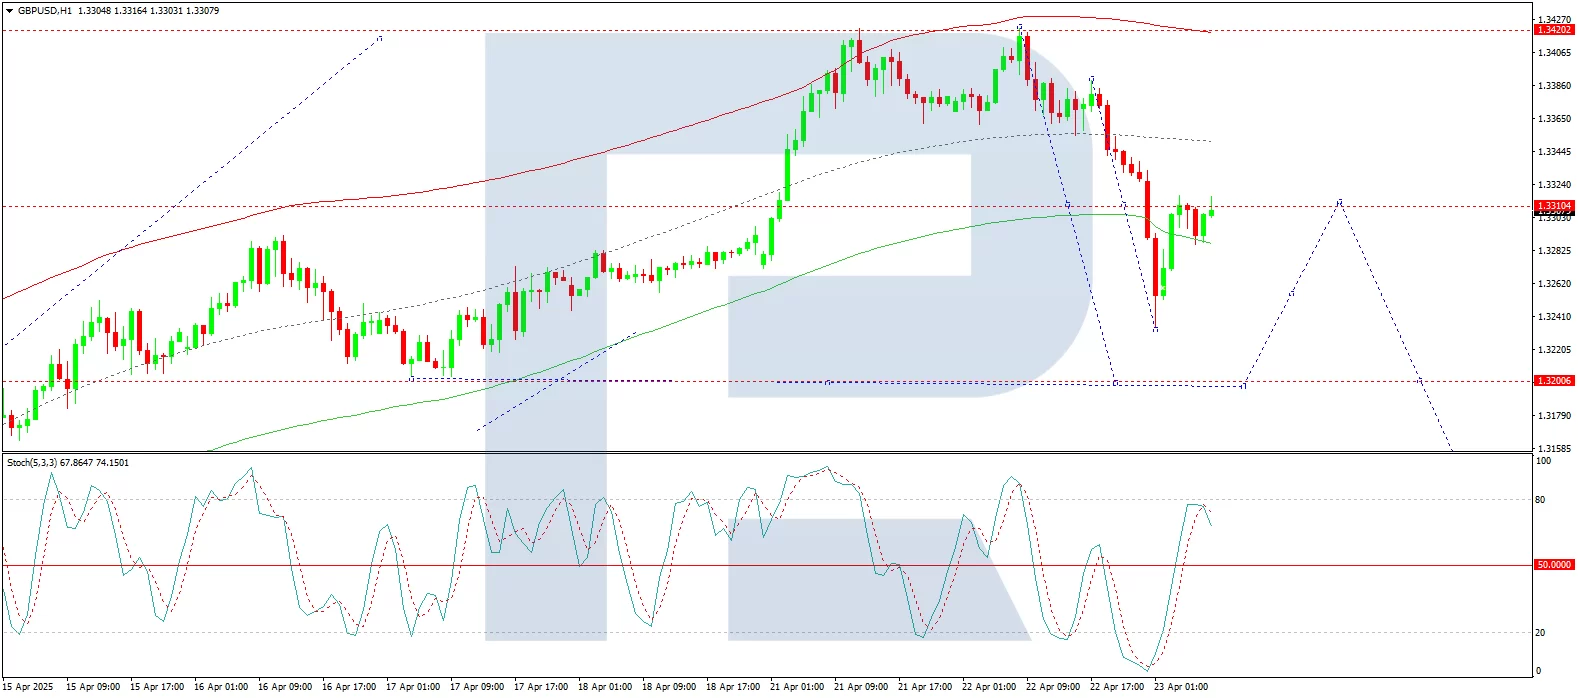
- GBP/USD broke below 1.3310, hitting a local downside target at 1.3233.
- Today, the pair retested 1.3310 from below, and further downside movement towards 1.3200 is now in focus.
- The Stochastic oscillator aligns with this view, as its signal line remains below 80 and is trending downward towards 20, indicating weakening bullish momentum.
Conclusion
The GBP/USD rally has paused as traders assess mixed UK economic data and shifting Fed policy expectations. While near-term corrections are likely, the broader trend could see renewed upside if key support levels hold. Technical indicators suggest further consolidation before the next decisive move.
Disclaimer
Any forecasts contained herein are based on the author’s particular opinion. This analysis may not be treated as trading advice. RoboForex bears no responsibility for trading results based on trading recommendations and reviews contained herein.