By InvestMacro
Here are the latest charts and statistics for the Commitment of Traders (COT) data published by the Commodities Futures Trading Commission (CFTC).
The latest COT data is updated through Tuesday April 22nd and shows a quick view of how large traders (for-profit speculators and commercial entities) were positioned in the futures markets.
Weekly Speculator Changes led lower by Gold
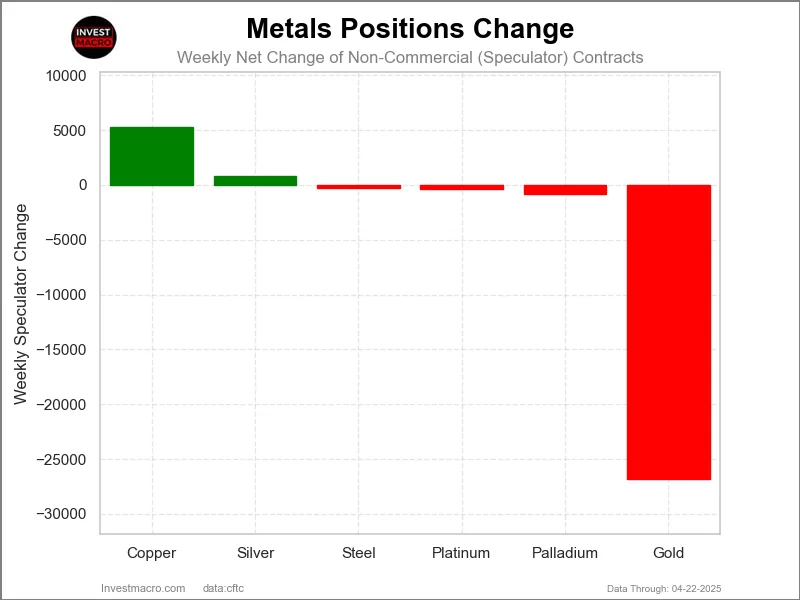
The COT metals markets speculator bets were overall lower this week as just two out of the six metals markets we cover had higher positioning while the other four markets had lower speculator contracts.
Leading the gains for the metals was Copper (5,288 contracts) with Silver (777 contracts) also recording a small positive week.
The markets with declines in speculator bets for the week were Gold (-26,832 contracts), Palladium (-835 contracts), Platinum (-357 contracts) and with Steel (-327 contracts) also showing lower bets on the week.
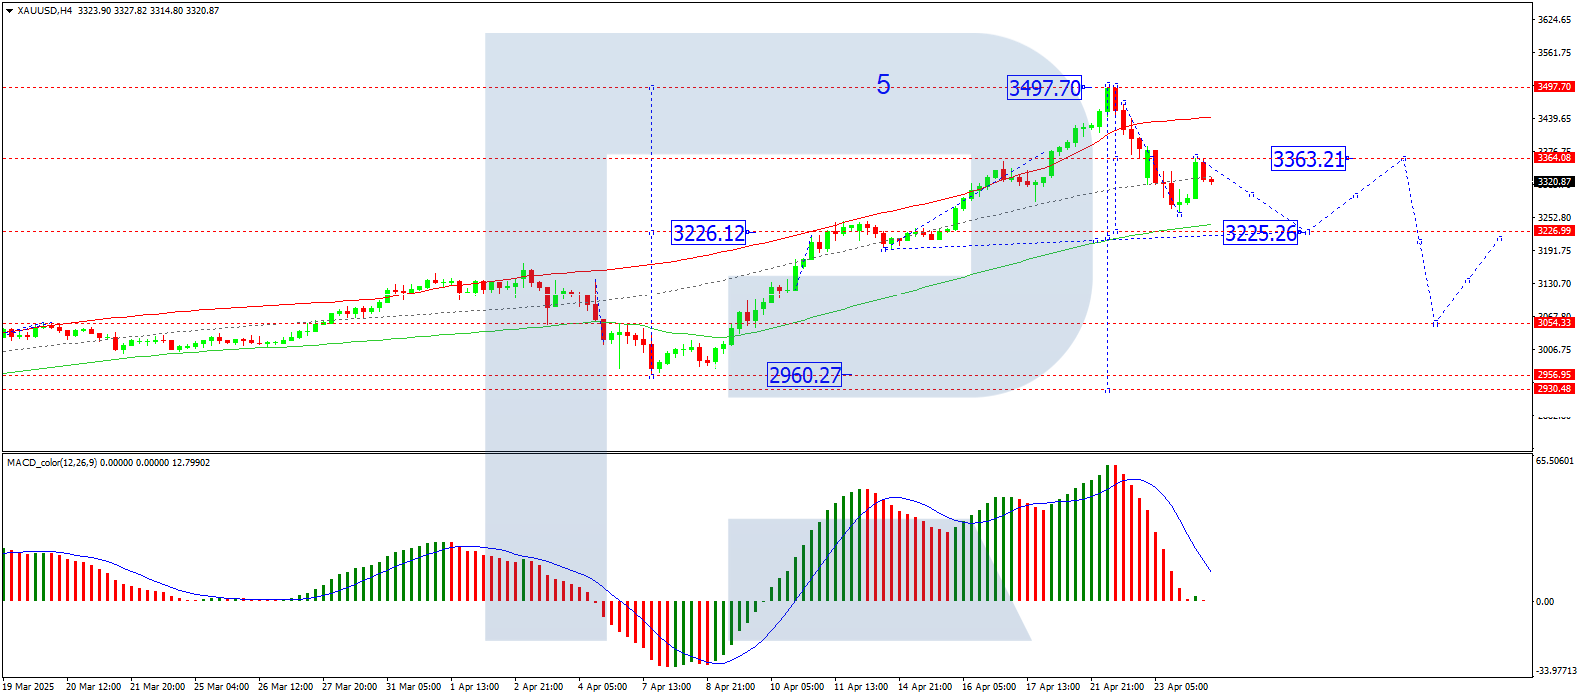
The Gold speculator bets continued their recent cool off over the past couple of months despite the metal’s rapid ascent to all-time high levels. Gold speculator positions have now fallen in nine out of the past eleven weeks and since February 12th, gold speculator bets have been on the decline with -127,130 contracts coming out of the bullish position that was at +302,508 contracts on February 4th. The gold futures price this week surged to an all-time high above $3,500 but did u-turn mid-week and closed the week almost unchanged at right around $3,300.
Metals Data:
 Legend: Weekly Speculators Change | Speculators Current Net Position | Speculators Strength Score compared to last 3-Years (0-100 range)
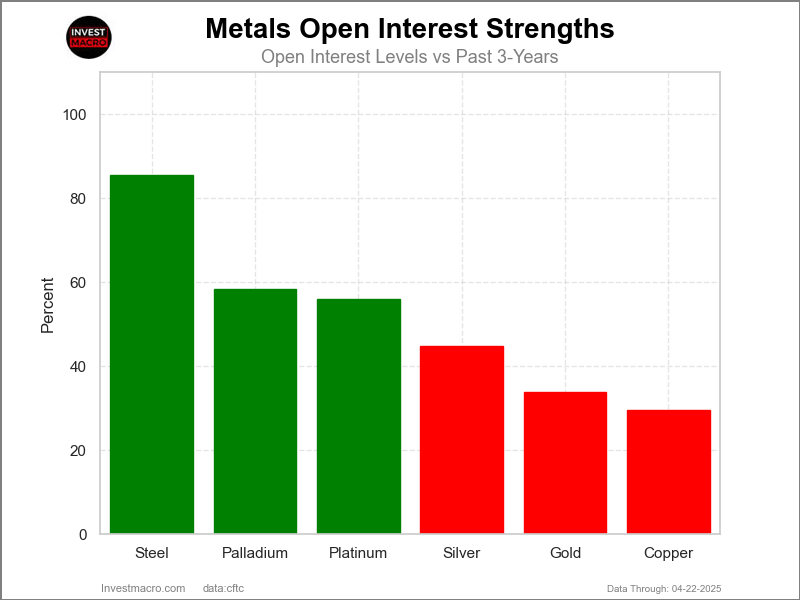
Strength Scores led by Steel & Silver

COT Strength Scores (a normalized measure of Speculator positions over a 3-Year range, from 0 to 100 where above 80 is Extreme-Bullish and below 20 is Extreme-Bearish) showed that Steel (82 percent) and Silver (73 percent) lead the metals markets this week. Copper (56 percent) comes in as the next highest in the weekly strength scores.
On the downside, Palladium (23 percent) and Platinum (29 percent) come in at the lowest strength level currently.
Strength Statistics:
Gold (46.8 percent) vs Gold previous week (57.0 percent)
Silver (72.7 percent) vs Silver previous week (71.7 percent)
Copper (56.3 percent) vs Copper previous week (51.4 percent)
Platinum (29.4 percent) vs Platinum previous week (30.2 percent)
Palladium (23.1 percent) vs Palladium previous week (29.3 percent)
Steel (81.6 percent) vs Palladium previous week (83.1 percent)
Copper tops the 6-Week Strength Trends

COT Strength Score Trends (or move index, calculates the 6-week changes in strength scores) showed that Copper (6 percent) leads the past six weeks trends for metals and is the only market with a positive trend.
Platinum (-24 percent), Gold (-23 percent) and Silver (-19 percent) lead the downside trend scores.
Move Statistics:
Gold (-23.1 percent) vs Gold previous week (-15.6 percent)
Silver (-18.7 percent) vs Silver previous week (-11.8 percent)
Copper (5.7 percent) vs Copper previous week (6.0 percent)
Platinum (-23.8 percent) vs Platinum previous week (-18.5 percent)
Palladium (-17.5 percent) vs Palladium previous week (-11.2 percent)
Steel (-15.7 percent) vs Steel previous week (-8.8 percent)
Individual Markets:
Gold Comex Futures:
 The Gold Comex Futures large speculator standing this week recorded a net position of 175,378 contracts in the data reported through Tuesday. This was a weekly lowering of -26,832 contracts from the previous week which had a total of 202,210 net contracts.
This week’s current strength score (the trader positioning range over the past three years, measured from 0 to 100) shows the speculators are currently Bearish with a score of 46.8 percent. The commercials are Bearish with a score of 49.5 percent and the small traders (not shown in chart) are Bullish with a score of 71.4 percent.
Price Trend-Following Model: Strong Uptrend
Our weekly trend-following model classifies the current market price position as: Strong Uptrend.
| Gold Futures Statistics | SPECULATORS | COMMERCIALS | SMALL TRADERS |
| – Percent of Open Interest Longs: | 55.6 | 19.6 | 10.9 |
| – Percent of Open Interest Shorts: | 17.9 | 63.0 | 5.2 |
| – Net Position: | 175,378 | -202,268 | 26,890 |
| – Gross Longs: | 258,896 | 91,128 | 50,904 |
| – Gross Shorts: | 83,518 | 293,396 | 24,014 |
| – Long to Short Ratio: | 3.1 to 1 | 0.3 to 1 | 2.1 to 1 |
| NET POSITION TREND: | |||
| – Strength Index Score (3 Year Range Pct): | 46.8 | 49.5 | 71.4 |
| – Strength Index Reading (3 Year Range): | Bearish | Bearish | Bullish |
| NET POSITION MOVEMENT INDEX: | |||
| – 6-Week Change in Strength Index: | -23.1 | 22.7 | -8.3 |
Silver Comex Futures:
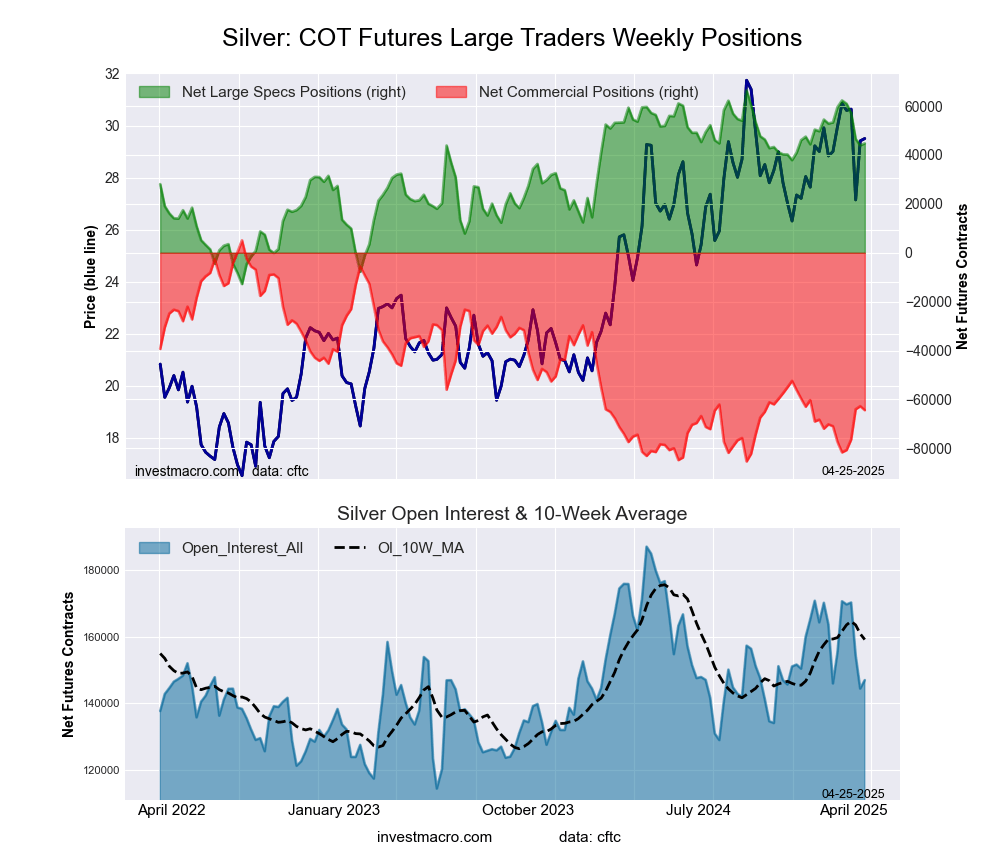 The Silver Comex Futures large speculator standing this week recorded a net position of 44,726 contracts in the data reported through Tuesday. This was a weekly gain of 777 contracts from the previous week which had a total of 43,949 net contracts.
This week’s current strength score (the trader positioning range over the past three years, measured from 0 to 100) shows the speculators are currently Bullish with a score of 72.7 percent. The commercials are Bearish with a score of 23.2 percent and the small traders (not shown in chart) are Bullish with a score of 65.8 percent.
Price Trend-Following Model: Uptrend
Our weekly trend-following model classifies the current market price position as: Uptrend.
| Silver Futures Statistics | SPECULATORS | COMMERCIALS | SMALL TRADERS |
| – Percent of Open Interest Longs: | 44.0 | 27.6 | 20.4 |
| – Percent of Open Interest Shorts: | 13.6 | 71.4 | 7.0 |
| – Net Position: | 44,726 | -64,374 | 19,648 |
| – Gross Longs: | 64,693 | 40,479 | 29,975 |
| – Gross Shorts: | 19,967 | 104,853 | 10,327 |
| – Long to Short Ratio: | 3.2 to 1 | 0.4 to 1 | 2.9 to 1 |
| NET POSITION TREND: | |||
| – Strength Index Score (3 Year Range Pct): | 72.7 | 23.2 | 65.8 |
| – Strength Index Reading (3 Year Range): | Bullish | Bearish | Bullish |
| NET POSITION MOVEMENT INDEX: | |||
| – 6-Week Change in Strength Index: | -18.7 | 14.4 | 8.8 |
Copper Grade #1 Futures:
 The Copper Grade #1 Futures large speculator standing this week recorded a net position of 24,765 contracts in the data reported through Tuesday. This was a weekly lift of 5,288 contracts from the previous week which had a total of 19,477 net contracts.
This week’s current strength score (the trader positioning range over the past three years, measured from 0 to 100) shows the speculators are currently Bullish with a score of 56.3 percent. The commercials are Bullish with a score of 50.1 percent and the small traders (not shown in chart) are Bearish-Extreme with a score of 11.0 percent.
Price Trend-Following Model: Uptrend
Our weekly trend-following model classifies the current market price position as: Uptrend.
| Copper Futures Statistics | SPECULATORS | COMMERCIALS | SMALL TRADERS |
| – Percent of Open Interest Longs: | 40.0 | 32.1 | 6.2 |
| – Percent of Open Interest Shorts: | 27.4 | 44.2 | 6.8 |
| – Net Position: | 24,765 | -23,650 | -1,115 |
| – Gross Longs: | 78,607 | 63,199 | 12,266 |
| – Gross Shorts: | 53,842 | 86,849 | 13,381 |
| – Long to Short Ratio: | 1.5 to 1 | 0.7 to 1 | 0.9 to 1 |
| NET POSITION TREND: | |||
| – Strength Index Score (3 Year Range Pct): | 56.3 | 50.1 | 11.0 |
| – Strength Index Reading (3 Year Range): | Bullish | Bullish | Bearish-Extreme |
| NET POSITION MOVEMENT INDEX: | |||
| – 6-Week Change in Strength Index: | 5.7 | -1.4 | -27.7 |
Platinum Futures:
 The Platinum Futures large speculator standing this week recorded a net position of 5,677 contracts in the data reported through Tuesday. This was a weekly decrease of -357 contracts from the previous week which had a total of 6,034 net contracts.
This week’s current strength score (the trader positioning range over the past three years, measured from 0 to 100) shows the speculators are currently Bearish with a score of 29.4 percent. The commercials are Bullish with a score of 66.8 percent and the small traders (not shown in chart) are Bullish with a score of 56.1 percent.
Price Trend-Following Model: Uptrend
Our weekly trend-following model classifies the current market price position as: Uptrend.
| Platinum Futures Statistics | SPECULATORS | COMMERCIALS | SMALL TRADERS |
| – Percent of Open Interest Longs: | 57.9 | 23.7 | 12.9 |
| – Percent of Open Interest Shorts: | 50.6 | 38.7 | 5.3 |
| – Net Position: | 5,677 | -11,652 | 5,975 |
| – Gross Longs: | 45,094 | 18,459 | 10,067 |
| – Gross Shorts: | 39,417 | 30,111 | 4,092 |
| – Long to Short Ratio: | 1.1 to 1 | 0.6 to 1 | 2.5 to 1 |
| NET POSITION TREND: | |||
| – Strength Index Score (3 Year Range Pct): | 29.4 | 66.8 | 56.1 |
| – Strength Index Reading (3 Year Range): | Bearish | Bullish | Bullish |
| NET POSITION MOVEMENT INDEX: | |||
| – 6-Week Change in Strength Index: | -23.8 | 21.7 | 5.9 |
Palladium Futures:
 The Palladium Futures large speculator standing this week recorded a net position of -10,843 contracts in the data reported through Tuesday. This was a weekly reduction of -835 contracts from the previous week which had a total of -10,008 net contracts.
This week’s current strength score (the trader positioning range over the past three years, measured from 0 to 100) shows the speculators are currently Bearish with a score of 23.1 percent. The commercials are Bullish with a score of 72.9 percent and the small traders (not shown in chart) are Bullish with a score of 73.6 percent.
Price Trend-Following Model: Weak Uptrend
Our weekly trend-following model classifies the current market price position as: Weak Uptrend.
| Palladium Futures Statistics | SPECULATORS | COMMERCIALS | SMALL TRADERS |
| – Percent of Open Interest Longs: | 31.1 | 53.7 | 11.4 |
| – Percent of Open Interest Shorts: | 84.1 | 5.2 | 6.9 |
| – Net Position: | -10,843 | 9,913 | 930 |
| – Gross Longs: | 6,365 | 10,984 | 2,337 |
| – Gross Shorts: | 17,208 | 1,071 | 1,407 |
| – Long to Short Ratio: | 0.4 to 1 | 10.3 to 1 | 1.7 to 1 |
| NET POSITION TREND: | |||
| – Strength Index Score (3 Year Range Pct): | 23.1 | 72.9 | 73.6 |
| – Strength Index Reading (3 Year Range): | Bearish | Bullish | Bullish |
| NET POSITION MOVEMENT INDEX: | |||
| – 6-Week Change in Strength Index: | -17.5 | 18.2 | -2.7 |
Steel Futures Futures:
 The Steel Futures large speculator standing this week recorded a net position of 1,118 contracts in the data reported through Tuesday. This was a weekly decline of -327 contracts from the previous week which had a total of 1,445 net contracts.
This week’s current strength score (the trader positioning range over the past three years, measured from 0 to 100) shows the speculators are currently Bullish-Extreme with a score of 81.6 percent. The commercials are Bearish with a score of 20.1 percent and the small traders (not shown in chart) are Bearish with a score of 23.1 percent.
Price Trend-Following Model: Uptrend
Our weekly trend-following model classifies the current market price position as: Uptrend.
| Steel Futures Statistics | SPECULATORS | COMMERCIALS | SMALL TRADERS |
| – Percent of Open Interest Longs: | 29.0 | 64.4 | 0.4 |
| – Percent of Open Interest Shorts: | 26.1 | 67.2 | 0.6 |
| – Net Position: | 1,118 | -1,033 | -85 |
| – Gross Longs: | 11,012 | 24,447 | 147 |
| – Gross Shorts: | 9,894 | 25,480 | 232 |
| – Long to Short Ratio: | 1.1 to 1 | 1.0 to 1 | 0.6 to 1 |
| NET POSITION TREND: | |||
| – Strength Index Score (3 Year Range Pct): | 81.6 | 20.1 | 23.1 |
| – Strength Index Reading (3 Year Range): | Bullish-Extreme | Bearish | Bearish |
| NET POSITION MOVEMENT INDEX: | |||
| – 6-Week Change in Strength Index: | -15.7 | 17.1 | -29.4 |
Article By InvestMacro – Receive our weekly COT Newsletter
*COT Report: The COT data, released weekly to the public each Friday, is updated through the most recent Tuesday (data is 3 days old) and shows a quick view of how large speculators or non-commercials (for-profit traders) were positioned in the futures markets.
The CFTC categorizes trader positions according to commercial hedgers (traders who use futures contracts for hedging as part of the business), non-commercials (large traders who speculate to realize trading profits) and nonreportable traders (usually small traders/speculators) as well as their open interest (contracts open in the market at time of reporting). See CFTC criteria here.